S-1/A: General form of registration statement for all companies including face-amount certificate companies
Published on October 15, 2024
Table of Contents
As filed with the Securities and Exchange Commission on October 15, 2024.
Registration No. 333-282404
UNITED STATES
SECURITIES AND EXCHANGE COMMISSION
Washington, D.C. 20549
AMENDMENT NO. 1 TO
FORM S-1
REGISTRATION STATEMENT
Under
The Securities Act of 1933
INGRAM MICRO HOLDING CORPORATION
(Exact name of registrant as specified in its charter)
| Delaware | 5045 | 86-2249729 | ||
| (State or other jurisdiction of incorporation or organization) |
(Primary Standard Industrial Classification Code Number) |
(I.R.S. Employer Identification Number) |
3351 Michelson Drive, Suite 100
Irvine, CA 92612
Telephone: (714) 566-1000
(Address, including zip code, and telephone number, including area code, of registrants principal executive offices)
Paul Bay
Chief Executive Officer
3351 Michelson Drive, Suite 100
Irvine, CA 92612
Telephone: (714) 566-1000
(Name, address, including zip code, and telephone number, including area code, of agent for service)
With copies to:
| Cristopher Greer, Esq. Anne L. Barrett, Esq. Willkie Farr & Gallagher LLP 787 Seventh Avenue New York, New York 10019-6099 (212) 728-8000 |
Augusto Aragone, Esq. General Counsel 7509 NW 99th Avenue Doral, FL 33178 (786) 547-6045 |
James J. Clark, Esq. William J. Miller, Esq. Meghan McDermott, Esq. Cahill Gordon & Reindel LLP 32 Old Slip New York, NY 10005 (212) 701-3000 |
Approximate date of commencement of proposed sale to the public: As soon as practicable after this Registration Statement is declared effective.
If any of the securities being registered on this Form are to be offered on a delayed or continuous basis pursuant to Rule 415 under the Securities Act of 1933, check the following box.: ☐
If this Form is filed to register additional securities for an offering pursuant to Rule 462(b) under the Securities Act, please check the following box and list the Securities Act registration statement number of the earlier effective registration statement for the same offering. ☐
If this Form is a post-effective amendment filed pursuant to Rule 462(c) under the Securities Act, check the following box and list the Securities Act registration statement number of the earlier effective registration statement for the same offering. ☐
If this Form is a post-effective amendment filed pursuant to Rule 462(d) under the Securities Act, check the following box and list the Securities Act registration statement number of the earlier effective registration statement for the same offering. ☐
Indicate by check mark whether the registrant is a large accelerated filer, an accelerated filer, a non-accelerated filer, a smaller reporting company, or an emerging growth company. See the definitions of large accelerated filer, accelerated filer, smaller reporting company, and emerging growth company in Rule 12b-2 of the Exchange Act.
| Large accelerated filer | ☐ | Accelerated filer | ☐ | |||
| Non-accelerated filer | ☒ | Smaller reporting company | ☐ | |||
| Emerging growth company | ☐ | |||||
If an emerging growth company, indicate by check mark if the registrant has elected not to use the extended transition period for complying with any new or revised financial accounting standards provided pursuant to Section 7(a)(2)(B) of the Securities Act. ☐
The Registrant hereby amends this Registration Statement on such date or dates as may be necessary to delay its effective date until the Registrant shall file a further amendment which specifically states that this Registration Statement shall thereafter become effective in accordance with Section 8(a) of the Securities Act of 1933, as amended, or until the Registration Statement shall become effective on such date as the Securities and Exchange Commission, acting pursuant to said Section 8(a), may determine.
Table of Contents
The information in this preliminary prospectus is not complete and may be changed. These securities may not be sold until the registration statement filed with the Securities and Exchange Commission is effective. This preliminary prospectus is not an offer to sell these securities and it is not soliciting an offer to buy these securities in any jurisdiction where the offer or sale is not permitted. SUBJECT TO COMPLETION, DATED, 2022. Shares MICRO Ingram Micro Holding Corporation Common Stock This is the initial public offering of common stock of Ingram Micro Holding Corporation (the Common Stock). We are offering shares of our Common Stock. Currently, no public market exists for our shares of our Common Stock. We expect that the initial public offering price of our Common Stock will be between $and $per share. We have applied to have our Common Stock listed on the New York Stock Exchange (the NYSE) under the symbol INGM. After the completion of this offering, Imola JV Holdings L.P., an investment vehicle ultimately controlled by Platinum Equity, LLC, will continue to beneficially own % of the voting power of all of our outstanding shares of Common Stock. As a result, we will be a controlled company within the meaning of the corporate governance rules of the NYSE. See ManagementBoard Independence. We intend to use the proceeds from this offering of the Common Stock to repay a portion of the outstanding borrowings under our Term Loan Credit Facility (as defined herein). See Use of Proceeds. Investing in our Common Stock involves risk. See Risk Factors beginning on page 38 to read about factors you should consider before buying shares of our Common Stock. Neither the Securities and Exchange Commission nor any state securities commission has approved or disapproved of these securities or passed upon the adequacy or accuracy of this prospectus. Any representation to the contrary is a criminal offense. Per Share Total(1) Initial public offering price $$ Underwriting discounts and commissions(2)$$Proceeds, before expenses, to us $ $ (1) Assumes no exercise of the underwriters option to purchase additional shares of Common Stock from the selling stockholder as described below.(2) Please see the section entitled Underwriting for a description of compensation payable to the underwriters. The selling stockholder identified in this prospectus has granted the underwriters an option to purchase up to additional shares of Common Stock, at the initial public offering price, less the underwriting discount, for 30 days from the date of this prospectus. We will not receive any of the proceeds from the sale of shares by the selling stockholder upon such exercise. The underwriters expect to deliver the shares of our Common Stock to our investors on or about,. Morgan Stanley Goldman Sachs & Co. LLC J.P. Morgan The date of this prospectus is , 2022.
Table of Contents

Table of Contents

Table of Contents
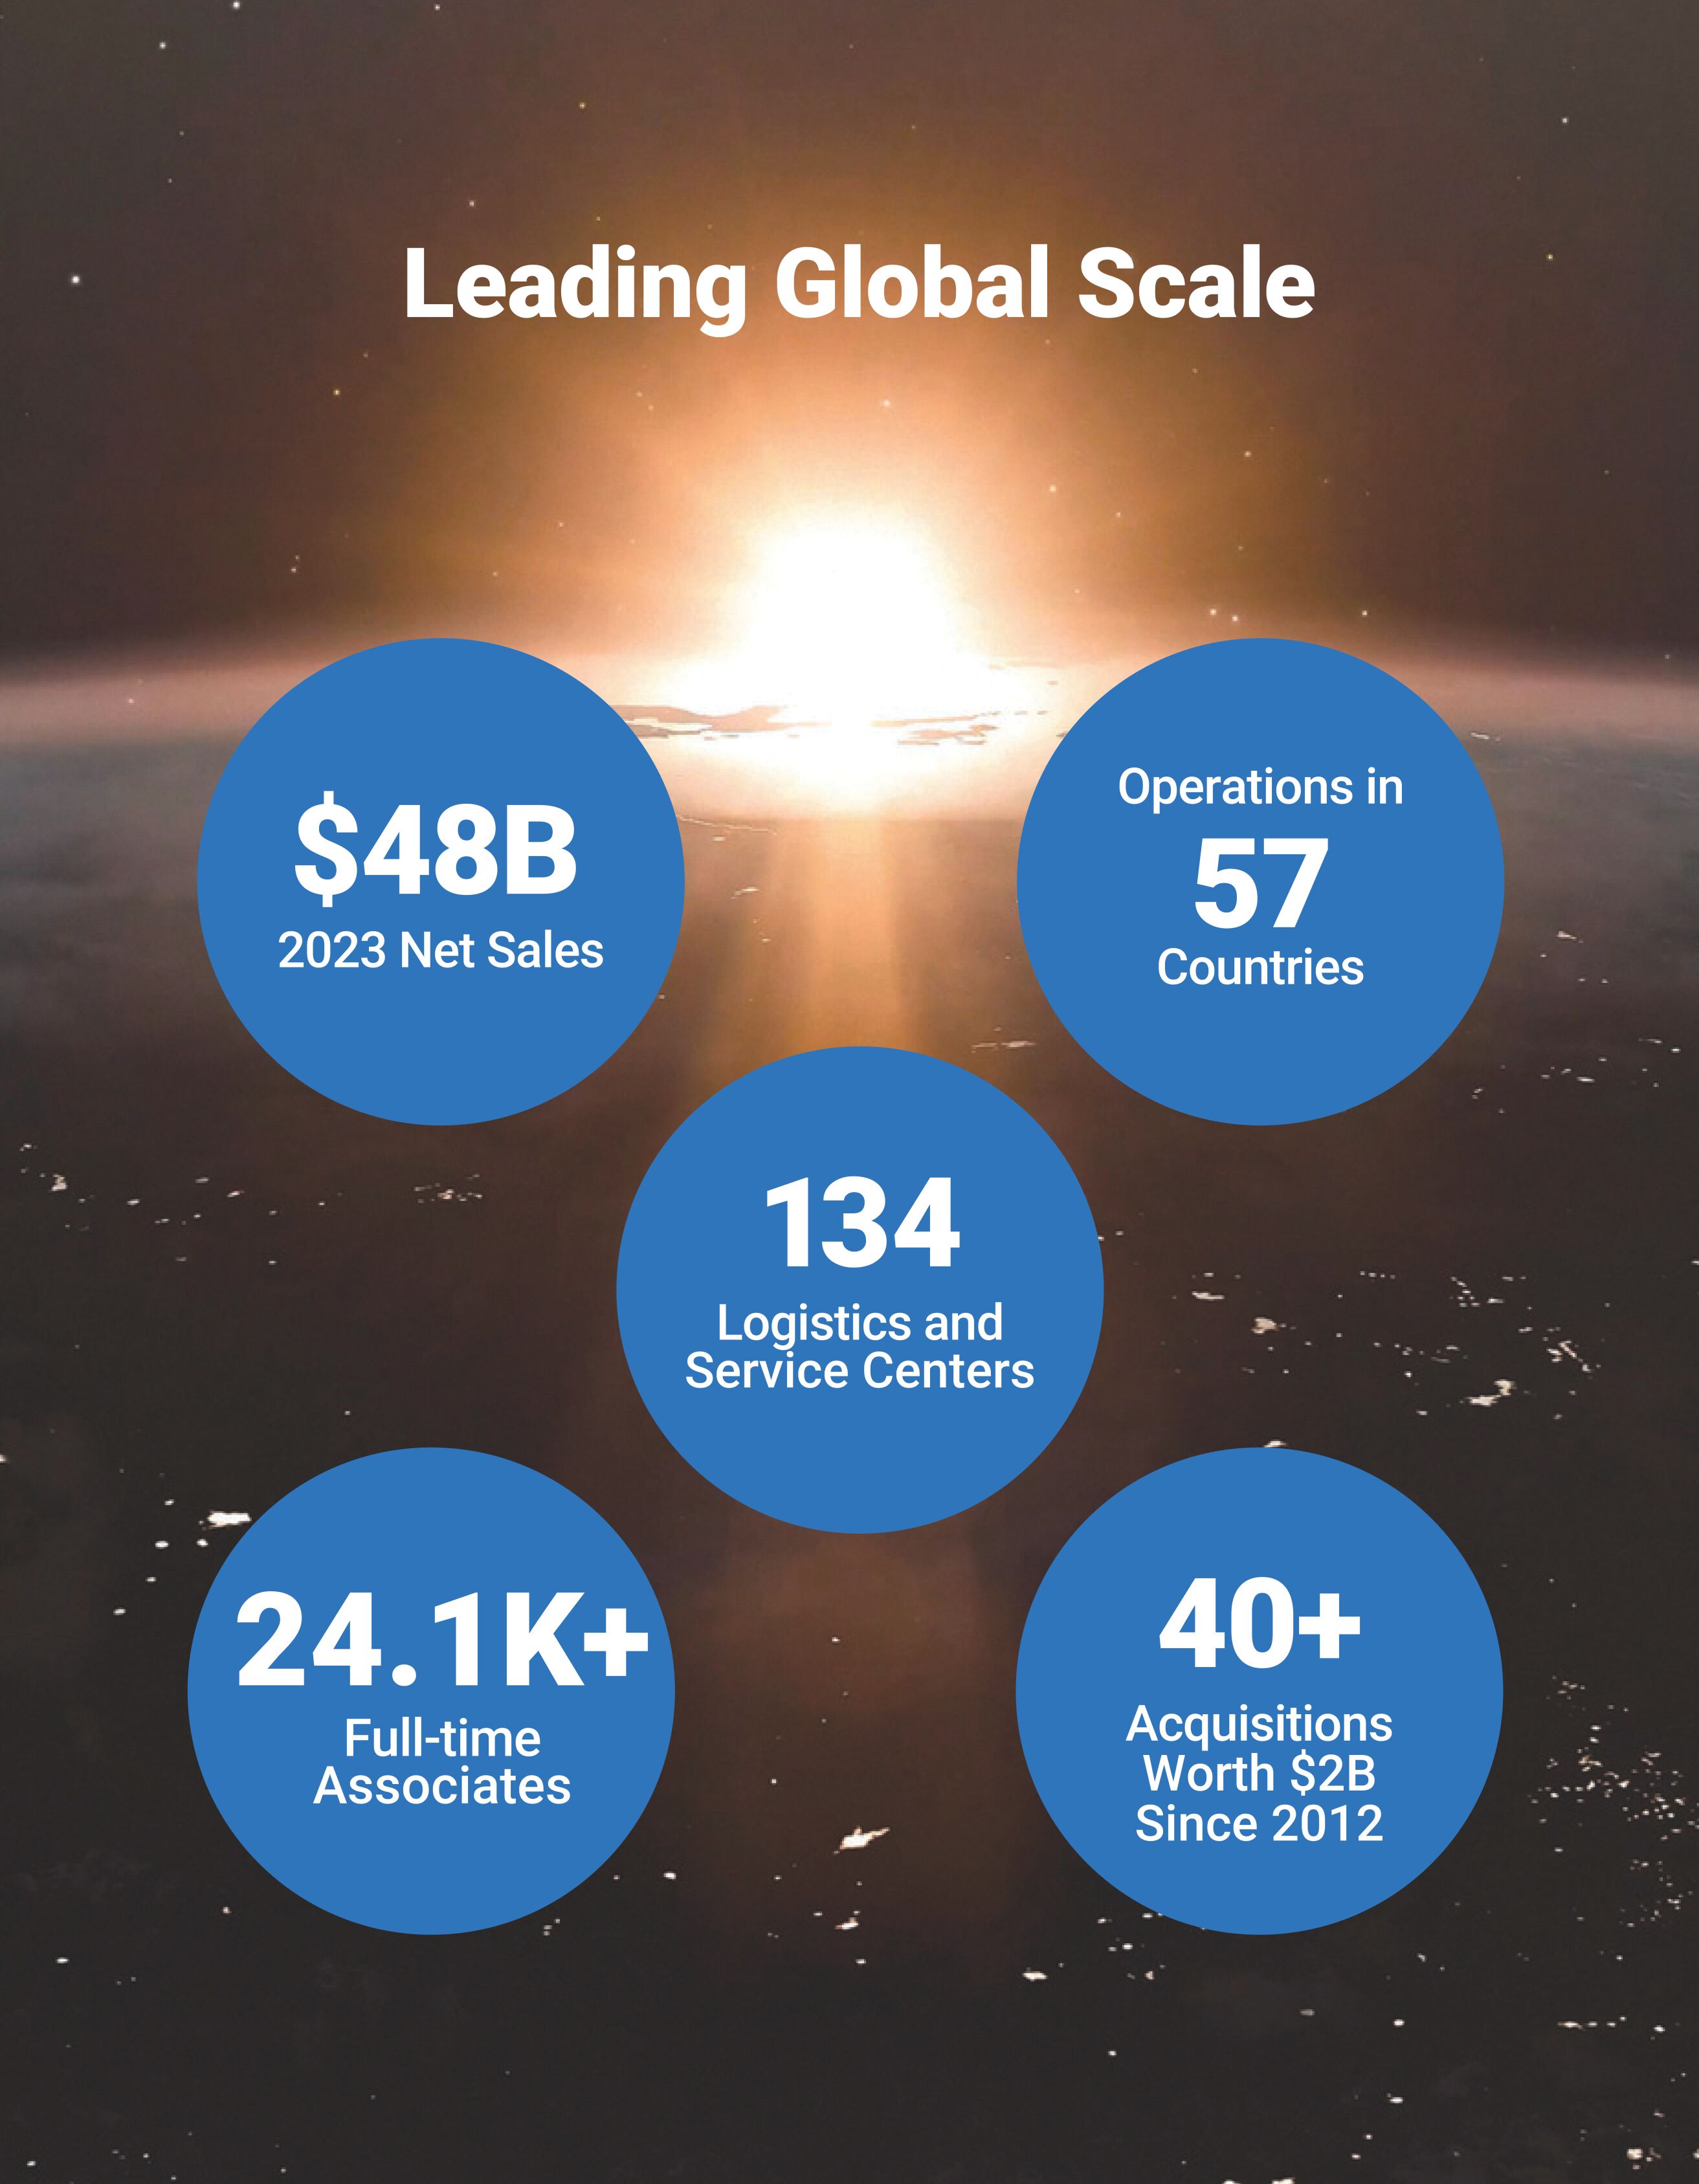
Table of Contents
| ii | ||||
| ii | ||||
| ii | ||||
| iii | ||||
| vi | ||||
| 1 | ||||
| 38 | ||||
| 79 | ||||
| 81 | ||||
| 83 | ||||
| 85 | ||||
| 86 | ||||
| 88 | ||||
| 90 | ||||
| MANAGEMENTS DISCUSSION AND ANALYSIS OF FINANCIAL CONDITION AND RESULTS OF OPERATIONS |
96 | |||
| 152 | ||||
| 176 | ||||
| 184 | ||||
| 207 | ||||
| 211 | ||||
| 213 | ||||
| 218 | ||||
| 227 | ||||
| MATERIAL U.S. FEDERAL INCOME TAX CONSEQUENCES TO NON-U.S. HOLDERS |
229 | |||
| 233 | ||||
| 249 | ||||
| 250 | ||||
| 251 | ||||
| F-1 |
i
Table of Contents
You should rely only on the information contained in this prospectus or in any free writing prospectus we may authorize to be delivered or made available to you. Neither we nor the selling stockholder nor the underwriters have authorized anyone to provide you with different information. The Company, the selling stockholder and the underwriters take no responsibility for, and can provide no assurance as to the reliability of, any other information that others may give you. The information in this prospectus is accurate only as of the date of this prospectus, regardless of the time of delivery of this prospectus, or any free writing prospectus, as the case may be, or any sales of shares of our Common Stock. Our business, financial condition, results of operations and prospects may have changed since that date.
For investors outside the United States: We are not, the selling stockholder is not and the underwriters are not, making an offer to sell shares of our Common Stock in any jurisdiction where the offer or sale is not permitted. Neither we nor the selling stockholder nor the underwriters have done anything that would permit this offering or possession or distribution of this prospectus in any jurisdiction where action for that purpose is required, other than in the United States. Persons outside the United States who come into possession of this prospectus must inform themselves about, and observe any restrictions relating to, the offering of shares of Common Stock and the distribution of this prospectus outside the United States.
Within this prospectus, we reference information and statistics regarding the IT industry. We have obtained this information and statistics from various independent third-party sources, including independent industry publications, reports by market research firms and other independent sources. Some data and other information contained in this prospectus, including, without limitation, reports from International Data Corporation (IDC), Technavio and Statista, are also based on managements estimates and calculations, which are derived from our review and interpretation of internal company research, surveys and independent sources in the markets in which we operate, which, in each case, we believe are reliable. Data regarding the industries in which we operate and our market position and market share within these industries are inherently imprecise and are subject to significant business, economic and competitive uncertainties beyond our control, but we believe they generally indicate size, position and market share within these industries. Market share data is subject to change and cannot always be verified with certainty due to limits on the availability and reliability of raw data, the voluntary nature of the data gathering process and other limitations and uncertainties inherent in any statistical survey of market shares. In addition, customer preferences can and do change. References herein to our being a leader in a market or product category refers to our belief that we have a leading market share position in each specified market, unless the context otherwise requires. While we believe such information is reliable, we have not independently verified any third-party information. While we believe our internal company research, surveys and estimates are reliable, such research, surveys and estimates have not been verified by an independent source. In addition, assumptions and estimates of our and our industries future performance are necessarily subject to a high degree of uncertainty and risk due to a variety of factors, including those described in Risk Factors. These and other factors could cause our future performance to differ materially from our assumptions and estimates. See Cautionary Note Regarding Forward-Looking Statements.
TRADEMARKS, SERVICE MARKS AND TRADE NAMES
This prospectus contains some of our trademarks, service marks and trade names, including, among others, Ingram Micro, the Ingram Micro logo, V7 (Video Seven), CloudBlue, Aptec, Xvantage and Trust X Alliance. Each one of these trademarks, service marks or trade names is either (i) our registered trademark, (ii) a trademark for which we have a pending application, (iii) a licensed trademark or (iv) a trade name or service mark for which we claim common law rights. All other trademarks, trade names or service marks of any other
ii
Table of Contents
company appearing in this prospectus belong to their respective owners. Solely for convenience, the trademarks, service marks and trade names referred to in this prospectus are presented without the TM, SM and ® symbols, but such references are not intended to indicate, in any way, that we will not assert, to the fullest extent under applicable law, our rights or the rights of the applicable licensors to these trademarks, service marks and trade names.
Presentation of Financial Information
Ingram Micro Holding Corporation conducts its operations through its subsidiaries, including its indirect subsidiary Ingram Micro Inc., a Delaware corporation and operating company which is doing business as and which we refer to as Ingram Micro. As used in this prospectus, unless the context otherwise indicates, any reference to our Company, the Company, us, we and our refers, prior to the Imola Mergers, to our predecessor, Ingram Micro, together with its consolidated subsidiaries, and after the Imola Mergers, to our successor, Ingram Micro Holding Corporation, together with its consolidated subsidiaries. Our Fiscal Year is a 52- or 53-week period ending on the Saturday nearest to December 31. All references herein to Fiscal Year 2020 (Predecessor), Fiscal Year 2022 (Successor) and Fiscal Year 2023 (Successor) represent the Fiscal Years ended January 2, 2021 (53 weeks), December 31, 2022 (52 weeks) and December 30, 2023 (52 weeks), respectively. All references herein to the Unaudited 2023 Interim Period (Successor) and Unaudited 2024 Interim Period (Successor) represent the twenty-six weeks ended July 1, 2023 (Successor) and June 29, 2024 (Successor), respectively.
As used in this prospectus, Platinum means Platinum Equity, LLC together with its affiliated investment vehicles.
Platinum formed Ingram Micro Holding Corporation (formerly known as Imola Holding Corporation) on September 28, 2020, and on December 9, 2020, Imola Acquisition Corporation, an investment vehicle of certain private investment funds sponsored and ultimately controlled by Platinum, Tianjin Tianhai Logistics Investment Management Co., Ltd., HNA Technology Co., Ltd. (HNA Tech), a part of HNA Group, GCL Investment Management, Inc., Ingram Micro and Imola Merger Corporation (Escrow Issuer) entered into an agreement pursuant to which Platinum indirectly acquired (through Imola Acquisition Corporation) Ingram Micro from affiliates of HNA Tech, for aggregate cash consideration of approximately $7.2 billion, net of any indebtedness acquired (the Acquisition Agreement). The acquisition closed on July 2, 2021 (the Acquisition Closing Date). To fund a portion of the consideration for the acquisition, Platinum contributed certain amounts in cash to an indirect parent of Ingram Micro in exchange for the issuance to Platinum of equity in such parent entity in connection with the acquisition (the Equity Contribution). Concurrently with the Equity Contribution and to finance the remaining portion of the consideration for the acquisition, Ingram Micro entered into the following:
| | the ABL Credit Facilities, consisting of a $500 million ABL Term Loan Facility and a $3,500 million ABL Revolving Credit Facility; |
| | the $2,000 million Term Loan Credit Facility; and |
| | the $2,000 million 2029 Notes. |
In connection with the acquisition, Ingram Micro repaid in full, or satisfied and discharged in full, the obligations under any governing instruments, as applicable, of the then existing indebtedness of the Company and its subsidiaries, except for certain additional lines of credit, short-term overdraft facilities and other credit facilities with approximately $179.4 million outstanding as of June 29, 2024, and entered into the agreements governing its current indebtedness as described above (the Financing Transactions). See Description of Material Indebtedness.
As part of the acquisition, Imola Merger Corporation merged with and into GCL Investment Management Inc., an affiliate of HNA Tech, which immediately thereafter merged with and into GCL Investment Holdings,
iii
Table of Contents
Inc., which subsequently and immediately then merged with and into Ingram Micro, with Ingram Micro as the surviving entity (collectively, and together with the closing of the transactions contemplated by the Acquisition Agreement, the Equity Contribution and the Financing Transactions related to the acquisition, the Imola Mergers).
For the purpose of discussing our financial results, (i) we refer to ourselves (Ingram Micro Holding Corporation) as the Successor in the periods following the Imola Mergers and the Predecessor (Ingram Micro Inc.) during the periods preceding the Imola Mergers and (ii) we refer to the period from January 3, 2021 to July 2, 2021 as the Predecessor 2021 Period and the period from July 3, 2021 to January 1, 2022 as the Successor 2021 Period. The financial information of the Company has been separated by a vertical line on the face of the consolidated financial statements to distinguish the Successor and Predecessor periods. See Note 1, Organization and Basis of Presentation, to our audited consolidated financial statements.
The Companys consolidated financial data for the Predecessor 2021 Period, the Successor 2021 Period, as of January 1, 2022 (Successor), the respective periods as of and for the Fiscal Years ended December 31, 2022 (Fiscal Year 2022 (Successor)) and December 30, 2023 (Fiscal Year 2023 (Successor)) have been derived from our audited consolidated financial statements, which are included elsewhere in this prospectus.
To facilitate comparability of Fiscal Year 2022 (Successor) and Fiscal Year 2023 (Successor) to the fiscal year ended January 1, 2022, this prospectus also includes unaudited pro forma condensed combined financial information for key financial metrics and results of operations for the year ended January 1, 2022 (the Unaudited Pro Forma 2021 Combined Period), which gives effect to the Imola Mergers, on a pro forma basis, as if they had occurred on January 3, 2021. See Unaudited Pro Forma Condensed Combined Statement of Income.
Numerical figures included in this prospectus and the consolidated financial statements included in this prospectus are presented in U.S. dollars rounded to the nearest million, unless otherwise noted. Certain amounts presented in tables are subject to rounding adjustments and, as a result, numerical figures shown as totals in various tables may not be arithmetic aggregations of the figures that precede them.
Unless indicated otherwise, the information included in this prospectus assumes that (i) the shares of Common Stock to be sold in this offering are sold at $21.50 per share, which is the midpoint of the estimated offering range set forth on the cover page of this prospectus and (ii) all shares offered by us and the selling stockholder in this offering are sold (other than pursuant to the underwriters option to purchase additional shares as described herein).
Non-GAAP Financial Measures
Our financial statements included in this prospectus have been prepared in accordance with accounting principles generally accepted in the United States (GAAP). We have included certain non-GAAP financial measures in this prospectus, as further described below, that may not be directly comparable to other similarly titled measures used by other companies and therefore may not be comparable among companies. For purposes of Regulation G under the Exchange Act (Regulation G) and Section 10(e) of Regulation S-K under the Securities Act (Regulation S-K), a non-GAAP financial measure is a numerical measure of a companys historical or future financial performance, financial position or cash flows that excludes amounts, or is subject to adjustments that have the effect of excluding amounts, that are included in the most directly comparable measure calculated and presented in accordance with GAAP in the statements of operations, balance sheets, or statement of cash flows of the company; or includes amounts, or is subject to adjustments that have the effect of including amounts, that are excluded from most directly comparable measure so calculated and presented. Pursuant to the requirements of Regulation G, we have provided reconciliations of non-GAAP financial measures to the most directly comparable GAAP financial measures. These non-GAAP measures are provided because our management uses these financial measures in monitoring and evaluating our ongoing results and trends.
iv
Table of Contents
This prospectus contains non-GAAP financial measures, including EBITDA, Adjusted EBITDA, Adjusted Income from Operations, Adjusted Income from Operations Margin, Adjusted Free Cash Flow, Non-GAAP Net Income and Adjusted Return on Invested Capital, which are financial measures that are not required by, or presented in accordance with GAAP.
We believe that, in addition to our results determined in accordance with GAAP, EBITDA, Adjusted EBITDA, Adjusted Income from Operations, Adjusted Income from Operations Margin, Adjusted Free Cash Flow, Non-GAAP Net Income and Adjusted Return on Invested Capital are useful in evaluating our business and the underlying trends that are affecting our performance. The non-GAAP measures noted above are primary indicators that our management uses internally to conduct and measure its business and evaluate the performance of its consolidated operations. Our management believes these non-GAAP financial measures are useful as they provide meaningful comparisons to prior periods and an alternate view of the impact of acquired businesses. These non-GAAP financial measures are used in addition to and in conjunction with results presented in accordance with GAAP. These non-GAAP financial measures reflect an additional way of viewing aspects of our operations that, when viewed with our GAAP results and the accompanying reconciliations to corresponding GAAP financial measures, provide a more complete understanding of factors and trends affecting our business. A material limitation associated with these non-GAAP measures as compared to the GAAP measures is that they may not be comparable to other companies with similarly titled items that present related measures differently. The non-GAAP measures should be considered as a supplement to, and not as a substitute for or superior to, the corresponding measures calculated in accordance with GAAP. See Summary Historical and Unaudited Pro Forma Condensed Combined Financial and Other Data for a reconciliation to the most directly comparable financial measure stated in accordance with GAAP.
Offering Reorganization Transactions
Historically, we have had two classes of common stock, Class A voting common stock and Class B non-voting common stock. Our Second Amended and Restated Certificate of Incorporation, referred to herein as our amended and restated certificate of incorporation, which will be effective after the effectiveness of this registration statement, but prior to the consummation of this offering, will convert our Class A voting common stock and Class B non-voting common stock into Common Stock on a 1-for-1 basis and effect a 8,367.19365-for-1 stock split with respect to our Common Stock. We refer to the effectiveness of our amended and restated certificate of incorporation, stock conversion and stock split as the Offering Reorganization Transactions.
v
Table of Contents
Certain Definitions
The following terms are used in this prospectus unless otherwise noted or indicated by the context:
| | 2029 Notes means the Companys $2,000 million aggregate principal amount 4.750% notes due 2029; |
| | ABL Credit Agreement means the credit agreement that governs the ABL Revolving Credit Facility and the ABL Term Loan Facility, dated as of July 2, 2021 by and among Imola Acquisition Corporation, Ingram Micro Inc., the borrowers therein, various lenders and issuing banks, and JP Morgan Chase Bank, N.A., as amended by Amendment No. 1 to the ABL Credit Agreement, dated as of August 12, 2021, as further amended by Amendment No. 2 to the ABL Credit Agreement, dated as of May 30, 2023, as further amended by Amendment No. 3 to the ABL Credit Agreement, dated as of June 17, 2024, and as further amended by Amendment No. 4 to the ABL Credit Agreement, dated as of September 20, 2024; |
| | ABL Credit Facilities means the ABL Term Loan Facility together with the ABL Revolving Credit Facility; |
| | ABL Revolving Credit Facility means the senior secured asset-based credit facility entered into on July 2, 2021, consisting of a multi-currency revolving credit facility (available for loans and letters of credit) in an aggregate principal amount of up to $3,500 million, subject to borrowing base capacity; |
| | ABL Term Loan Facility means the term loan facility in an aggregate principal amount of $500 million, entered into on July 2, 2021; |
| | Artificial Intelligence or AI refers to an engineered or machine-based tool or system that can, for a given set of objectives, generate outputs such as predictions, recommendations, or decisions influencing real or virtual environments; |
| | Asia-Pacific refers to the Asia-Pacific region; |
| | Credit Agreements means the Term Loan Credit Agreement together with the ABL Credit Agreement; |
| | Credit Facilities means the ABL Revolving Credit Facility together with the ABL Term Loan Facility and the Term Loan Credit Facility; |
| | EMEA refers, collectively, to the Europe, Middle East and Africa region; |
| | Indenture means the indenture that governs the 2029 Notes, dated as of April 22, 2021, by and between Imola Merger Corporation and the Bank of New York Mellon Trust Company, N.A., as trustee and notes collateral agent, as supplemented by that certain supplemental indenture, by and among Ingram Micro Inc., as issuer, the Guarantors (as defined therein) party thereto from time to time, and the Bank of New York Mellon Trust Company, N.A., as trustee and notes collateral agent; |
| | Latin America refers to the Latin American region; |
| | Machine Learning or ML refers to a branch of AI that focuses on the development of systems capable of learning from data to perform a task without being explicitly programmed to perform that task. Learning refers to the process of optimizing model parameters through computational techniques such that the models behavior is optimized for the training task; |
| | North America refers to the North America region encompassing the United States and Canada; |
| | Platinum means Platinum Equity, LLC together with its affiliated investment vehicles; |
| | Platinum Advisors means Platinum Equity Advisors, LLC, an entity affiliated with Platinum; |
vi
Table of Contents
| | Term Loan Credit Agreement means the term loan credit agreement that governs the Term Loan Credit Facility, dated as of July 2, 2021, by and among Imola Acquisition Corporation, Ingram Micro Inc., JP Morgan Chase Bank, N.A., and the lenders, agents and other parties thereto, as amended by Amendment No. 1 to the Term Loan Credit Agreement, dated as of June 23, 2023, as further amended by Amendment No. 2 to the Term Loan Credit Agreement, dated as of September 27, 2023, and as further amended by Amendment No. 3 to the Term Loan Credit Agreement, dated as of September 20, 2024; and |
| | Term Loan Credit Facility means the senior secured term loan facility pursuant to the Term Loan Credit Agreement. |
vii
Table of Contents
This summary highlights information contained elsewhere in this prospectus. Because this is only a summary, it does not contain all the information that you should consider before investing in shares of our Common Stock, and it is qualified in its entirety by, and should be read in conjunction with, the more detailed information appearing elsewhere in this prospectus. You should read the entire prospectus carefully, including Risk Factors, Cautionary Note Regarding Forward-Looking Statements, and our financial statements and the related notes included elsewhere in this prospectus, before deciding to purchase shares of our Common Stock. Unless the context indicates otherwise, references to our Company, the Company, us, we and our refers, prior to the Imola Mergers, to our predecessor, Ingram Micro, together with its consolidated subsidiaries, and after the Imola Mergers, to our successor, Ingram Micro Holding Corporation, together with its consolidated subsidiaries. Following this offering, we will be a controlled company under the NYSE corporate governance standards, and as a result, will rely on exemptions from certain corporate governance requirements. See Risk Factors.
Ingram Micro is a leading solutions provider by revenue for the global information technology (IT) ecosystem helping power the worlds leading technology brands. With our vast infrastructure and focus on client and endpoint solutions (formerly referred to as commercial & consumer, as described elsewhere in this prospectus), advanced solutions offerings and cloud-based solutions, we enable our business partners to scale and operate more efficiently in the markets they serve. We deliver customized solutions to our vendor, reseller and retailer partners, enabling them to provide excellent business outcomes to the companies and consumers they serve. Through our global reach and broad portfolio of products, professional services offerings, software, cloud and digital solutions, we remove complexity and maximize the value of the technology products our partners make, sell or use, providing the world more ways to realize the promise of technology. In the face of significant economic uncertainty and volatility in commercial markets globally, we believe that our business remains well-positioned to benefit from technology megatrends, including cloud migration, enhanced security, Internet-of-Things (IoT), hybrid work and 5G.
As one of the worlds largest technology distributors by revenue and/or by global footprint, we have positioned Ingram Micro as an integral link in the global technology value chain, providing technology solutions and services from more than 1,500 vendor partners to a broad array of customers. With operations in 57 countries and 134 logistics and service centers worldwide, we serve as a solutions aggregator that we believe based on our experience in the industry enables us, together with our vendor partners, to reach nearly 90% of the global population with technology. Original Equipment Manufacturers (OEMs) and software providers rely on us to simplify global sales channels, gain operational efficiencies and address complex technology deployments. Our highly diversified base of more than 161,000 customers includes value-added resellers, system integrators, telecommunications companies and managed service providers. We provide our customers with broad product availability, technical expertise and a full suite of professional services to simplify their deployment and maximize their use of technology, including data-driven business and market insights, pre-sales engineering, post-sales integration, technical support and financing solutions. We manage more than 850 million units of technology products across more than 220,000 unique SKUs every year and handle, on average, in excess of 12,000 technical engineering calls monthly. Additionally, we provide resellers, retailers and OEMs with our IT Asset Disposition (ITAD) and Reverse Logistics and Repairs services to advance environmental sustainability through responsibly collecting and beneficially repurposing e-waste through remanufacturing, recycling, refurbishing and reselling technology devices. For the Predecessor 2021 Period, Successor 2021 Period, the Unaudited Pro Forma 2021 Combined Period, Fiscal Year 2022 (Successor), Fiscal Year 2023 (Successor) and the Unaudited 2024 Interim Period (Successor), we generated net sales of $26,406.9 million, $28,048.7 million, $54,455.6 million, $50,824.5 million, $48,040.4 million and $22,876.4 million, respectively, and net income of $378.5 million, $96.7 million, $366.1 million, $2,394.5 million, $352.7 million and $104.1 million, respectively. In addition, during such periods we generated Adjusted EBITDA of $647.8 million for the Predecessor 2021 Period, $746.3 million for the Successor 2021 Period, $1,384.2 million for the Unaudited Pro Forma 2021
1
Table of Contents
Combined Period, $1,349.4 million for Fiscal Year 2022 (Successor), $1,353.1 million for Fiscal Year 2023 (Successor) and $569.0 million for the Unaudited 2024 Interim Period (Successor). See Managements Discussion and Analysis of Financial Condition and Results of OperationsNon-GAAP Financial Measures. As of June 29, 2024, we had approximately 24,150 full-time associates.
More than a decade ago, we embarked on a journey from being a traditional IT products distributor to creating an integrated marketplace for customized solutions. Since then, even in the midst of the recent global softening in demand for certain of our traditional offerings, including our client and endpoint solutions, we have invested more than $2 billion in technical resources, intellectual property, digital processes and systems, advanced solutions, specialty markets and professional services. From its inception, this organic evolution, aided by a number of key acquisitions, has focused on creating a one-stop-shop experience for our thousands of customers to seamlessly procure and manage a comprehensive suite of technology solutions and services. The anything-as-a-service (XaaS) market has now been a rapidly expanding market and a key growth driver for several years, leading to our accelerated development of highly integrated solutions, services and marketplaces. First launched in 2010, our cloud marketplace has been a transformative part of our journey, enabling leading software vendors to connect with thousands of customers, who in turn support millions of end users, in what we believe to be the worlds largest cloud ecosystem. Today, our cloud marketplace hosts more than 200 cloud solutions, aggregates 29 marketplaces and manages over 36 million seats for more than 33,000 customers. Building on our successful cloud marketplace, our proprietary CloudBlue digital commerce platform, and other acquired and organically developed intellectual property, in 2022 we launched Ingram Micro Xvantage, our fully automated, self-learning and innovative digital platform, which is now live in key countries around the globe. We believe that our customers will increasingly experience a single pane of glass through which we offer a full menu of IT devices, software solutions, cloud-based subscriptions, and technology services across hundreds of vendors and brands as we migrate our cloud marketplace and other marketplaces to Ingram Micro Xvantage and continuously integrate additional capabilities to the platform. Through Ingram Micro Xvantage, many tasks that previously took hours or even days, such as order status updates, price quotes and vendor catalog management activities, can now be accomplished by the platform in a few minutes, driving significant efficiency gains for our vendors, customers and associates. We believe that we offer our third-party partners the industrys first comprehensive and streamlined distribution experience in a single integrated digital platform. Harnessing the insights gained from hundreds of millions of transactions over the past decade, Ingram Micro Xvantage is a significant milestone in our evolution benefiting from many years of investment and IT distribution experience. As our dynamic business model continues to evolve and we continue our transition to becoming more of a platform company, we will be better able to adapt to customer demands in the constantly shifting IT landscape.
Our focus on successful business outcomes for our partners and their clients, together with the investments described above, have enabled us to deliver solid financial results and expand our advanced solutions and cloud businesses even in the midst of the recent global softening in demand for certain of our traditional offerings, including our client and endpoint solutions.
Advanced Solutions generated net sales of $7,329 million for the Predecessor 2021 Period, $8,309 million for the Successor 2021 Period, $17,354 million for Fiscal Year 2022 (Successor), $17,883.3 million for Fiscal Year 2023 (Successor) and $8,164.9 million for the Unaudited 2024 Interim Period (Successor). Cloud generated net sales of $125.9 million for the Predecessor 2021 Period, $161.7 million for the Successor 2021 Period, $326.0 million for Fiscal Year 2022 (Successor), $383.3 million for Fiscal Year 2023 (Successor) and $226.1 million for the Unaudited 2024 Interim Period (Successor).
2
Table of Contents
Industry Background
We believe that technological innovationas a primary catalyst of growth, differentiation and efficiency gains across industries and applicationswill continue to drive long-term expansion in the global IT market, even as certain technologies and sectors experience declines in demand from time to time. As the world becomes increasingly digital, connected and automated, companies and consumers will need to invest in the latest technology and security around these solutions to effectively interact with key stakeholders, grow their business and drive operational efficiencies.
We believe our industry will benefit from a number of key trends:
| | Continued cloud growth and shift to a subscription-and consumption-based economy. Enterprises and individuals continue to increase their adoption of XaaS solutions, and the shift to cloud alternatives is driving continued infrastructure buildout globally. The ability to bill, provision, launch, price, recognize revenue and manage subscriptions is becoming increasingly essential to successful business outcomes and continued growth. |
| | Need for enhanced security. The information security market has been impacted by an increase in the number and the complexity of threats and targeted attacks over the past several years. Given the impact that attacks have had on organizations across the world, security will remain a top priority for senior management teams and boards of directors, driving continued spend on security in the future. According to IDC, global security spend is expected to grow to $329 billion in 2027, an 11.4% compound annual growth rate (CAGR) from 2023. |
| | Exponential increase in the number of connected devices and the complexity of technology solutions. According to IDC, there will be approximately 46 billion connected IoT devices by 2025, generating approximately 67 zettabytes of data. As the lines between devices, software, and services become increasingly blurred due to ubiquitous connectivity and the rise of sophisticated edge computing and distributed networks, among other drivers, the ability to deliver integrated solutions is critical to capture market opportunities. The number of worldwide NPU-equipped AI PC shipments is expected to grow to 167 million shipments by 2027, a 58.4% CAGR from 2023. We expect these market dynamics to increase demand for devices with faster processing, reduced latency, enhanced security and better overall performance, which are all factors that also speed refresh and upgrade cycles across multiple forms of technology. |
| | The rise of artificial intelligence. We believe AI will benefit our industry in two primary ways. First, for those distributors who are able to successfully execute the necessary shift to a digital platform, we expect AI to remove friction in the ordering process, improving and personalizing the customer experience by leveraging predictive models to generate insights and recommendations, and to power real-time dynamic pricing engines, accelerating the sales cycle and bolstering productivity. Second, AI will increasingly drive a shift in the design and application of all types of technology, which is expected to drive accelerated demand for PCs, datacenter equipment, AI-enabled software, and many other applications. |
| | Rollout of broadband and 5G networks will continue to drive technology growth. High-speed mobile networks are the backbone of the modern technology ecosystem and necessary to each of the aforementioned trends. We believe companies and consumers in both emerging and mature markets will need to continue investment in IT hardware, software, and services to capitalize on the expanding set of opportunities enabled by universal connectivity. |
Distributors provide vendors a highly attractive variable cost channel to customers, including consultative sales and engineering support, as well as trade credit, financing, marketing and logistics services. Vendors leverage distributors capabilities to aggregate demand and provide extensive market reach and coverage across
3
Table of Contents
different geographies, while simplifying supply chain and go-to-market complexity. Distributors provide customers, including resellers and end users, with critical product information and availability, aggregate multi-vendor technical expertise and service offerings, train and enable new certified sellers and authorized partners, extend financial solutions and trade credit and provide efficient supply chain logistics and technical support globally. As a result of these strategic benefits, we believe the opportunity for growth in the technology distribution industry will continue to exceed that of the global technology market as both hardware and software vendors increasingly rely on distributors to support their go-to-market strategies.
As technology solutions have become more complex, reliance on distributors to provide product, marketing, technical and financial support has increased. Increasingly, distributors play a central integrating role in the technology ecosystema distributor is no longer merely a link in the chain between vendors and resellers within the traditional two-tier distribution model, but today acts as the connective tissue among hardware and software vendors, service providers, resellers, integrators, marketplaces, and end customers. Companies are increasingly seeking perspectives on the most efficient ways to design, procure and optimize their technical infrastructures, and customers increasingly demand high-quality service and support including advanced technical, training, support and financing services. These strategic engagements are bringing the technology value chain closer to the end customer and will increasingly require a comprehensive platform to serve customer needs.
Additionally, environmental concerns and regulatory requirements for the disposal of IT products and data security regulations, such as general data protection regulation (GDPR), create challenges for companies in managing the safe disposal of IT products, limiting the risk of data loss and reducing or eliminating subsequent financial losses. In addition to the environmental considerations, improperly deleting data and disposing of hardware can result in costly management of data and potential exposures if data is not managed properly and securely.
Our Market Opportunity
Numerous trends continue to reshape the way organizations go to market, driving increasingly complex supply chains in industries ranging from enterprise hardware and software to mobility and retail. Despite recent fluctuations in businesses and consumers purchasing behaviors, particularly for discrete products, demand remains strong for end-to-end technology solutions, cloud-centric business applications and subscription management services. Additionally, there is an increasing need to simplify and automate the delivery of complicated virtual, physical and hybrid solutions and replace what currently are complex, fragmented, people-dependent processes and systems used to consume technology.
As a key partner to OEMs, software providers and businesses, our objective is to:
| 1. | Provide the industrys most efficient and reliable route to market, with comprehensive capabilities to enhance the value of the solutions we deliver to drive successful business outcomes; |
| 2. | Enable and increase our partners success, breadth and reach as the market evolves to additional cloud-centric and digital solutions, driven by our proprietary digital platform, Ingram Micro Xvantage, and the marketplaces and engines that are increasingly being integrated into it; |
| 3. | Digitize the supply and value chains and influence the way technology is acquired and demand is generated for technology solutions and services to enable our partners to transact via a fully digital platform to make business decisions, build demand and develop new offerings based on intelligent data insights; and |
| 4. | Sustainably support the circular economy and lifecycle of technology by helping organizations quickly cycle through IT assets in a secure and environmentally friendly manner, providing IT asset disposition and reverse logistics and repair offerings to reduce e-waste. |
4
Table of Contents
According to IDC, global IT spend across hardware, software and IT services was $3.1 trillion (excluding infrastructure-as-a-service) in 2023, and is expected to grow to $4.0 trillion in 2027, a 6.6% CAGR. We believe the proportion of the IT market sold through distribution has increased over the last decade, and we expect distribution to remain the principal route to market for most technology vendors. As technology becomes more complex, drawing off of multiple vendors and providers, and continues to be consumed on premises, virtually and in hybrid manners, we believe the importance of distribution will continue even as more technology becomes cloud-based. We continue to offer a significant value proposition for both vendors and customers by bringing these diverse and numerous technologies together in one source.
Today, a number of key technology categories such as cybersecurity, data center, sustainability and cloud are driving strong growth in technology spend. According to IDC, global security spend is expected to grow to $329 billion in 2027, an 11.4% CAGR from 2023. As IT spend continues to increase, we expect demand for IT asset disposition and reverse logistics and repair services to also increase. According to Technavio, the total addressable market for IT asset disposition is expected to reach $31.6 billion in 2027, up from $20.6 billion in 2023, a 11.3% CAGR. According to Statista, the total addressable market for reverse logistics and repair services in 2027 is expected to reach $861 billion, up from $700 billion in 2023, a 5.3% CAGR. We believe our differentiated capabilities enable us to continue our leadership position in this large and growing market.
Cloud adoption is accelerating, with public/dedicated cloud as a service spend expected to reach $1.4 trillion by 2027, up from $693 billion in 2023, a 19.6% CAGR, according to IDC. Cloud marketplaces have become increasingly important to software, hardware and infrastructure vendors go-to-market strategy, providing a unique value proposition to vendors including market reach, reduced complexity for customers and the ability to bundle services and broader solutions from multiple sources. According to IDC, the global digital transformation market, including hardware, software and IT and business services, is estimated to grow from $2.2 trillion in 2023 to $3.9 trillion in 2027, a 15.9% four-year CAGR. We believe our broad product offering, extensive vendor ecosystem and diversified customer base, combined with our highly scalable automated platform, position us to capture a greater share in a rapidly growing market. As more software licenses currently sold directly to end users move to a cloud as a service model, we expect our Serviceable Addressable Market in cloud offerings to grow. Based on our experience in the industry, we believe the strength of our Ingram Micro Cloud Marketplace and CloudBlue platform allows us to capture cloud opportunities that may not be available to our competitors.
Key Benefits of Our Business Model
Our technology and cloud solutions business model is purpose-built for todays technology landscape and the technology ecosystem of the future. We serve as an integral link in the global technology value chain, driving sales, reach and profitability for vendors, value-added resellers, mobile network operators, service and solution providers and other customers. We have a strong presence in each of the four regions in which we operate: North America, EMEA, Asia-Pacific and Latin America. Across each of these markets, our partners trust us to deliver a full spectrum of hardware, software, cloud, managed and professional and other services.
Our business model provides the following key benefits:
| | Strong Market Access through Global Network of Partners and Customers. We are one of the global leaders in technology and cloud distribution with leading market share around the globe. We have more than 1,500 vendor partners. Furthermore, we have a highly diversified base of more than 161,000 customers serving the small and mid-sized business (SMB) market, which consists of millions of businesses, and more than 33,000 cloud marketplace customers, covering millions of end users and over 36 million seats. With operations on six continents, we believe based on our experience in the industry our geographic reach and presence are superior to that of our competitors. |
5
Table of Contents
| | Ingram Micro Xvantage Designed for the Evolution of XaaS. Initially introduced to the market in late 2022, our Ingram Micro Xvantage digital platform, including the AI and ML capabilities that are foundational to the platforms functionality, has already been launched in the United States, Germany, Canada, the United Kingdom, Mexico, Colombia, Austria, France, Italy, Belgium, the Netherlands, Spain, India and Australia. We expect to continue launching in additional geographies, providing a singular experience for our customers and partners to procure and consume technology. As we migrate our cloud marketplace into Ingram Micro Xvantage in more and more geographies, and as we integrate additional engines into the digital platform, we believe that our interactions and transactions will become increasingly seamless for customers and vendors, and will enable them to drive further growth with significant efficiencies. We expect the investment and commitment we continue to make in Ingram Micro Xvantage will further strengthen our existing relationships, attract new partners and customers and influence end user technology preferences. Xvantage continues to develop with close to two dozen patents pending, 29 million new lines of code, over a hundred internally developed AI models and over 20 proprietary engines powering and supporting the platforms functionality, enabling Xvantage to offer its users instant pricing, billing automation, marketing capabilities, hardware and cloud subscriptions, the ability to configure, quote and track each order, and various other insights and recommendations personalized to the user. |
| | Efficient Go-To-Market Channel through Demand Aggregation. We serve as a central, unified platform for our vendors to aggregate demand from large and highly fragmented markets, providing vendors with a highly attractive and efficient channel to market and a valuable extension of their sales forces. As some vendors adjust their cost structure and trim their workforces, we believe more business has shifted, and will continue to shift, to distribution channels. The SMB market sector, for example, includes a greater share of long-tail customers who are often more difficult for vendors to access efficiently and profitably given they have lower buying power than large customers who can consolidate orders. |
| | Broad Solutions Offering to Meet Evolving Customer Demand. The average Ingram Micro solution is composed of six different technologies, demonstrating the complexity in the way products and services are consumed in todays marketplace. Our long-standing, entrenched relationships with the largest global technology vendors allow us to provide customers with access to a deep portfolio of hundreds of thousands of technology and cloud products from vendors around the world. This, combined with our Ingram Micro Cloud Marketplace, connects partners with what we believe to be the worlds largest cloud ecosystem, enabling them to generate and satisfy demand more efficiently. Our cloud marketplace serves 29 aggregated marketplaces and supports more than 200 cloud solutions, a number that is rapidly increasing. |
| | Integrated Managed and Professional Services Tailored to Customer Needs. Customers increasingly demand integrated multi-vendor, high-quality service and support. As of June 29, 2024, we had approximately 1,060 engineers globally who provide the high-quality technical, training and pre- and post-sales support, integration and ongoing managed services our partners and customers need, without adding incremental overhead. These engineers collectively hold thousands of current technical certifications, with a single certification typically requiring an investment of 30 hours or more. Through a personalized and consultative approach, we tailor solution sets to specific customer needs and deploy certified technicians to assist where vendors have gaps and where our customers are unable to support the high cost of technical talent or implementing highly complex multi-vendor solutions. We also enable the circular economy by providing responsible collection and repurposing of e-waste through remanufacturing, recycling, refurbishing and reselling technology devices. We believe such efforts help our customers achieve their environmental sustainability goals by keeping harmful materials out of landfills. |
6
Table of Contents
Our Strategic Priorities
We are a technology-focused company and have invested heavily in developing and acquiring technology, including intellectual property, to enable our partners success. We expect our continued investment in robotics and automation, within our advanced logistics centers will augment our efficient, customer-centric delivery capabilities and that our continued investment in our digital capabilities, including in the integration of over 20 proprietary engines within Ingram Micro Xvantage, will enhance the experience of our customers and vendors. We have a proven track record of profitable growth which has enabled us to achieve a position of great competitive strength and remain focused on continuing to deliver strong future growth. We recognize the markets need for sophisticated IT solutions and our strategies are developed with this in mind. Our overall objective is to continue to expand our business and our profitability by delivering innovative and thoughtful solutions to enable business partners to scale and operate more efficiently and successfully in the markets they serve.
Our strategic priorities are aligned to achieve this objective and focus on:
| | Adding digital tools and services to deepen engagement with customers and vendors and continuing to develop a transformative, fully digital platform to further simplify, automate, digitize and scale the delivery of our products and solutions portfolio. We intend to continue expanding our digital and services capabilities to connect and team with our partners and customers and serve their evolving needs. Our goal is to have our entire portfolio of products, software and services available on Ingram Micro Xvantage, delivering a singular business-to-consumer-like experience to our vendor and customer partners in the business-to-business market to interact, learn, partner, plan and consume technology via seamless and autonomous engines. We believe Ingram Micro Xvantage has already influenced, and will continue to influence, the acquisition and delivery of the full spectrum of technology solutions and services. By digitizing and automating quote-to-order, order status and tracking, customer service and other critical business support services, we are reducing transactional complexity and inefficiencies inherent in more manual processes and tools. In addition, as our business intelligence grows through applying the latest in AI and ML technology, we are able to provide higher-value capabilities and recommendations to our customers, enabling them to expand their reach into new markets and categories in a growing XaaS economy. Ingram Micro Xvantage is designed to allow our customers to increasingly benefit from a business-to-consumer-like experience, enabling them to shift time and resources away from administering transactions and toward interacting with their end customers and providing them higher value. We expect the investment and commitment we continue to make in Ingram Micro Xvantage will further strengthen our existing relationships, attract new partners and customers and influence end user technology preferences. Xvantage continues to develop with close to two dozen patents pending, 29 million new lines of code, over a hundred internally developed AI models and over 20 proprietary engines powering and supporting the platforms functionality, enabling Xvantage to offer its users instant pricing, billing automation, marketing capabilities, hardware and cloud subscriptions, the ability to configure, quote and track each order, and various other insights and recommendations personalized to the user. |
| | Growing our emerging technologies practices, including cybersecurity and AI, and further extending our technology portfolio to build out additional higher value, more complex product and services offerings. One of our investment priorities for the foreseeable future will be continued expansion of our advanced and emerging technology offerings. We plan to further expand our ecosystem by identifying emerging technologies and higher value, more complex solutions, and adding additional technology vendors to our platform. |
| | Enhancing profitability through operational improvement initiatives, digitization and automation. We have additional opportunities to drive operational enhancement and efficiencies in areas such as pricing, management of rebates, mix enrichment, automation and warehouse efficiency, to name a few. We also plan to continue building our technology roadmap to further develop and enhance our customer and vendor interface and experience. |
7
Table of Contents
| | Continuing our commitment to Environmental, Social and Governance (ESG) initiatives. We will continue to focus on environmental stewardship, social responsibility and effective governance across our global operations. We aim to continue to invest in our communities and improve our environmental performance, while developing a comprehensive environmental sustainability data management system across our operations. We are committed to minimizing our environmental impact both directly through our operations and indirectly through our influence within our value chain. We will continue to invest in and evolve our ESG efforts, and over the next few years we expect to continue to focus on ESG competency and reporting with a continued focus on climate action and waste reduction, diversity, equity and inclusion (DE&I), supply chain risk assessments and alignment with UN Sustainable Development Goals relevant to our impacts and activities. |
Our Products and Solutions
We provide a broad line of technology, services and solutions from more than 1,500 vendor partners, enabling us to offer comprehensive solutions to our reseller and retail customers. Our suppliers are the worlds trusted technology leaders, along with emerging technology brands, and include the industrys premier computer hardware suppliers, mobility hardware suppliers, networking equipment suppliers, software publishers and other suppliers of computer peripherals, consumer electronics, cloud-based solutions, unified communication and collaboration, data capture-point of sale (DC / POS) and physical security products, such as Advanced Micro Devices, Apple, Cisco, Dell Technologies, Hewlett Packard Enterprise, HP Inc., Lenovo, Microsoft, NVIDIA and Super Micro Computer. Our cloud portfolio comprises third-party services and subscriptions spanning a breadth of products from solution software through infrastructure-as-a-service. Our Ingram Micro Cloud Marketplace service portfolio consists of third-party cloud-based services or subscription offerings sold through our own platform. Vendors on the platform include Adobe, Amazon Web Services, Cisco, Microsoft, Proofpoint and VMware.
Our cloud marketplace, which in certain key jurisdictions has already been integrated into one unified Ingram Micro Xvantage, connects partners with what we believe to be the worlds largest cloud ecosystem, enabling them to generate demand more efficiently and providing third-party cloud-based services and subscription offerings through a digital platform for the consumption of cloud solutions in an ever-increasing cloud-centric world. We support more than 200 cloud solutions and manage over 36 million seats through our cloud marketplace. Our CloudBlue platform also provides services to many of the worlds leading telecommunication companies, as well as to managed service providers, technology distributors and value-added resellers, and manages over 52 million seats. Our professional services offerings add value to our partners and customers by providing data-driven business and market insights, pre-sales engineering, post-sales integration, technical support and financing solutions to further grow their businesses. In addition, our ITAD and Reverse Logistics and Repairs businesses play an important role in advancing environmental sustainability and bridging the digital divide through electronic device reverse logistics, refurbishment, recycling, reuse and resale for organizations, including the worlds largest mobile telecom providers. By helping to enable a circular economy, we support our customers in achieving their sustainability goals and enable consumers to access quality, affordable smartphones, computers and other devices.
We are focused on building our presence in those product categories and services and solutions that will benefit from key growth trends, such as the continuing technology shift to cloud-centric solutions, hybrid data centers, anything-as-a-service offerings, AI, hyper automation and circular economy solutions.
As part of our global presence in each of our four geographic regions, we offer customers a full spectrum of hardware and software, cloud services and logistics expertise through three main lines of business: Technology Solutions, Cloud and Other. In each of our geographic segments we offer customers the product categories listed below broken down under the respective line of business. Beginning in the second quarter of 2024, we began to refer to our Commercial & Consumer category as Client and Endpoint Solutions as a better reflection of the nature of the products and services within that category.
8
Table of Contents
Technology Solutions:
| | Client and Endpoint Solutions (formerly referred to as Commercial & Consumer). We offer a variety of higher-volume products targeted for corporate and individual end users, including desktop personal computers, notebooks, tablets, printers, components (including hard drives, motherboards, video cards, etc.), application software, peripherals, accessories and Ingram Micro branded solutions. We also offer a variety of products that enable mobile computing and productivity, including phones, phone tablets (including two-in-one notebook/tablet devices), smartphones, feature phones, mobile phone accessories, wearables and mobility software. |
| | Advanced Solutions. We offer enterprise grade hardware and software products aimed at corporate and enterprise users and generally characterized by specific projects, which account for lower volumes but higher gross margin. And while Advanced Solutions requires higher operational expenditures, primarily in the form of technical capabilities to serve the market, the operating margin delivered by this business is also generally stronger than Client and Endpoint Solutions. Within this product category, we offer servers, storage, networking, infrastructure hardware and software (covering system management, network and storage), hybrid and software-defined solutions, cybersecurity, power & cooling and virtualization (software and hardware) solutions. This category also includes training, professional services and financial solutions related to these product sets. We also offer customers DC / POS, physical security, audio visual & digital signage, Unified Communications and Collaboration (UCC) and Telephony, IoT (smart office/home automation) and AI products. |
Cloud:
| | Cloud-based Solutions. Our cloud portfolio comprises third-party services and subscriptions spanning a breadth of products from solution software through infrastructure-as-a-service. As technology consumption increasingly moves to XaaS, we have expanded our cloud solutions to more than 200 third-party cloud-based services or subscription offerings, including business applications, security, communications and collaboration, cloud enablement solutions and infrastructure-as-a-service. Also included here are the offerings of our CloudBlue business, which provides customers with multi-channel and multi-tier catalog management, subscription management, billing and orchestration capabilities through a software as a service (SaaS) model. |
Other:
| | Other offerings. We provide customers with ITAD, reverse logistics and repair and other related solutions, and prior to April 2022 included the operations sold through the CLS Sale further described herein. See CLS Sale. These offerings represent less than 10% of net sales for all periods presented herein. Products offered within our Reverse Logistics and Repairs solution includes returns management, repair and refurbishment and an aftermarket sales channel. |
Imola Mergers
Platinum formed Ingram Micro Holding Corporation (formerly known as Imola Holding Corporation) on September 28, 2020, and on December 9, 2020, Imola Acquisition Corporation, an investment vehicle of certain private investment funds sponsored and ultimately controlled by Platinum, Tianjin Tianhai Logistics Investment Management Co., Ltd., HNA Technology Co., Ltd. (HNA Tech), a part of HNA Group, GCL Investment Management, Inc., Ingram Micro, and Imola Merger Corporation (Escrow Issuer) entered into an agreement pursuant to which Platinum indirectly acquired (through Imola Acquisition Corporation) Ingram Micro from affiliates of HNA Tech, for aggregate cash consideration of approximately $7.2 billion, net of any indebtedness acquired (the Acquisition Agreement). Pursuant to the Acquisition Agreement, HNA Tech had the right to receive an amount not to exceed $325.0 million in the aggregate, on the achievement by the Company of certain adjusted EBITDA targets for fiscal years 2021, 2022 and 2023. Based upon adjusted EBITDA achieved through the end of the Successor 2021 Period, such payment of $325.0 million was earned in its entirety and was paid on April 11, 2022. See Note 1, Organization and Basis of Presentation, to our audited consolidated financial statements.
9
Table of Contents
The acquisition closed on July 2, 2021 (the Acquisition Closing Date). To fund a portion of the consideration for the acquisition, Platinum contributed certain amounts in cash to an indirect parent of Ingram Micro in exchange for the issuance to Platinum of equity in such parent entity in connection with the acquisition (the Equity Contribution). Concurrently with the Equity Contribution and to finance the remaining portion of the consideration for the acquisition, Ingram Micro entered into the following:
| | the ABL Credit Facilities, consisting of a $500 million ABL Term Loan Facility and a $3,500 million ABL Revolving Credit Facility; |
| | the $2,000 million Term Loan Credit Facility; and |
| | the $2,000 million 2029 Notes. |
In connection with the acquisition, Ingram Micro repaid in full, or satisfied and discharged in full, the obligations under any governing instruments, as applicable, of the then existing indebtedness of the Company and its subsidiaries, except for certain additional lines of credit, short-term overdraft facilities and other credit facilities with approximately $179.4 million outstanding as of June 29, 2024, and entered into the agreements governing its current indebtedness as described above (the Financing Transactions). See Description of Material Indebtedness.
As part of the acquisition, Imola Merger Corporation merged with and into GCL Investment Management Inc., an affiliate of HNA Tech, which immediately thereafter merged with and into GCL Investment Holdings, Inc., which subsequently and immediately then merged with and into Ingram Micro, with Ingram Micro as the surviving entity (collectively, and together with the closing of the transactions contemplated by the Acquisition Agreement, the Equity Contribution and the Financing Transactions related to the acquisition, the Imola Mergers).
10
Table of Contents
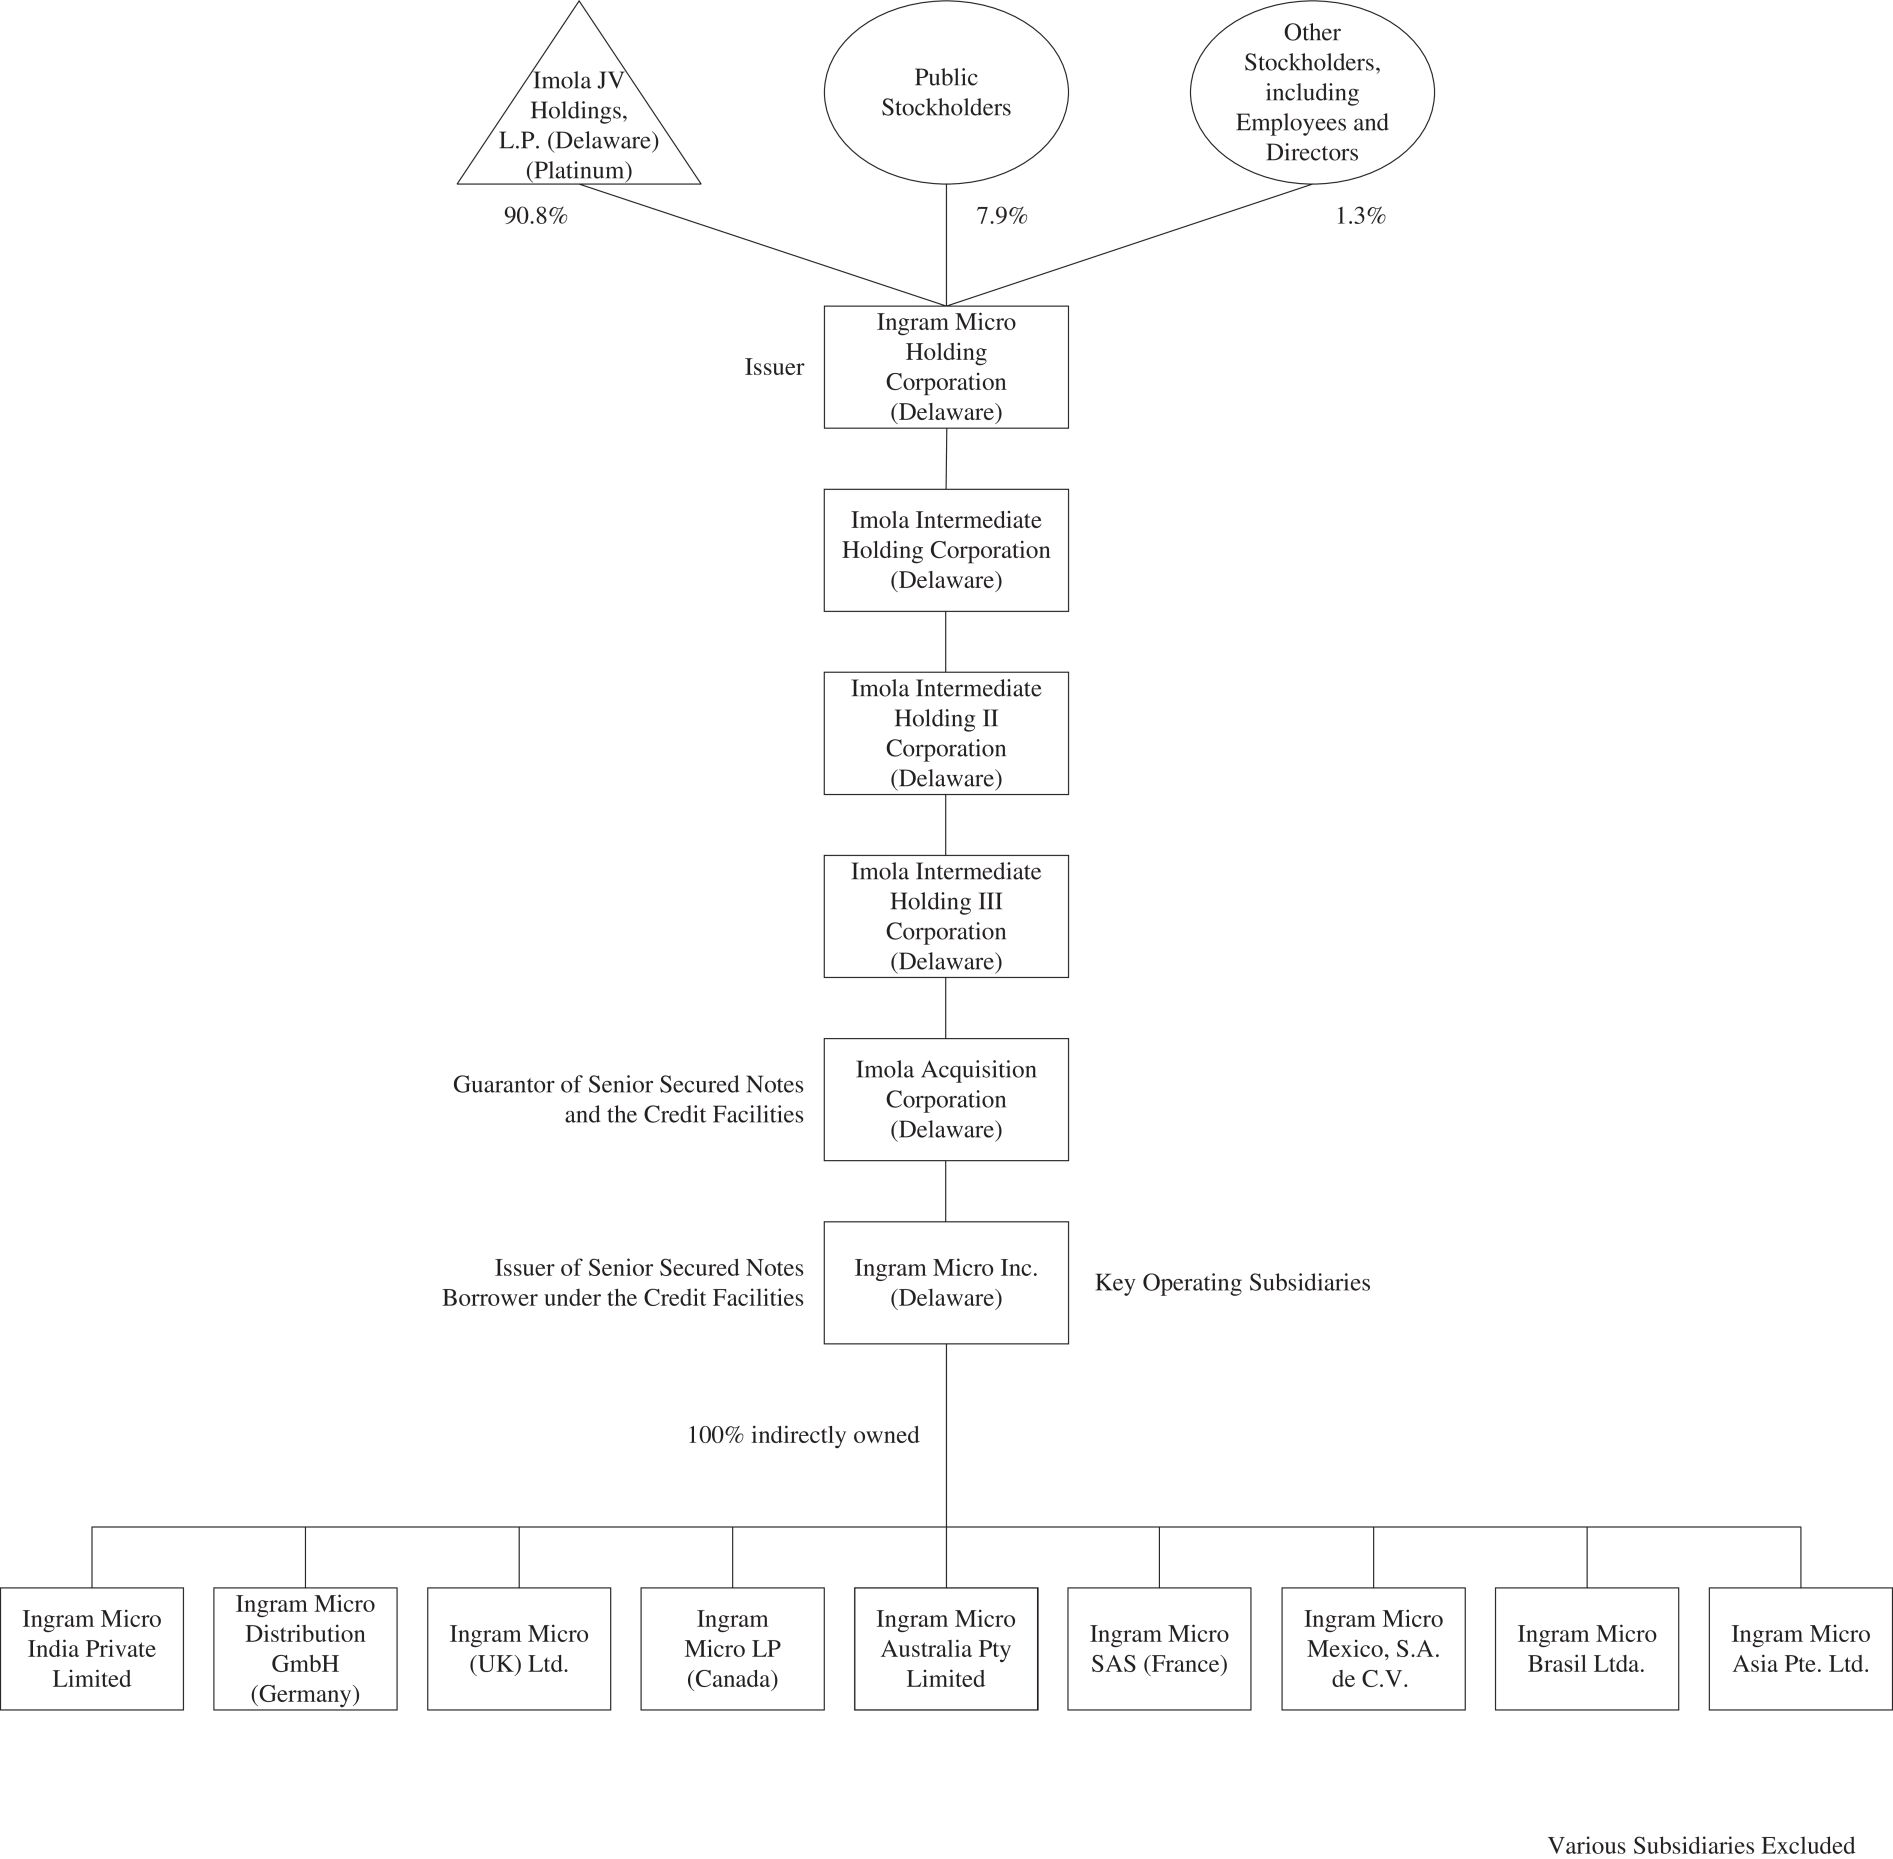
The diagram below depicts our simplified organizational structure following the Imola Mergers and the completion of this offering of our Common Stock, including the entities through which we predominantly conduct our Technology Solutions business in the countries indicated below. Such entities, which we consider to be our key operating subsidiaries, consist of Ingram Micro Inc. and certain indirectly wholly owned subsidiaries of Ingram Micro Inc., each of which is set forth below. This chart is provided for illustrative purposes only and does not purport to represent all legal entities owned or controlled by us.
CLS Sale
On December 8, 2021, we announced the sale of most of our Commerce and Lifecycle Services business, including Shipwire, our proprietary order management platform, and technology forward logistics and commerce
11
Table of Contents
businesses, with operations in North America, Europe, Latin America and Asia-Pacific, to the CMA CGM Group, a France-based provider of global shipping and logistics, in exchange for consideration of approximately $3.0 billion, subject to certain adjustments (the CLS Sale). Following the CLS Sale, we refer to such business, to the extent it remains, as Other. The transaction contemplated a primary closing date with respect to the vast majority of the operations that were the subject of the CLS Sale and successive deferred closings in respect of other operations. The primary closing of the transaction occurred on April 4, 2022 and the deferred closings were completed between the primary closing date of April 4, 2022 and November 16, 2022. In connection with the primary closing of the transaction on April 4, 2022, we entered into a transition services agreement (TSA) with CMA CGM Group, under which we are providing certain services, including logistical, IT and corporate services. The services provided under the TSA will terminate at various times but those that are not fully transitioned by the applicable specified time may be extended under certain circumstances to no later than 24 months from April 4, 2022, unless otherwise extended by mutual agreement. The majority of the human resources services that the Company was obligated to provide under the TSA were fully transitioned and completed at the end of December 2022. In addition, the majority of the operations and IT services were transitioned during 2023, and management expects the remaining services to be fully transitioned and completed by the end of 2024. See Note 1, Organization and Basis of Presentation, to our audited consolidated financial statements. On April 4, 2022, we used a portion of the proceeds received from the primary closing of the CLS Sale to pay down the balance then-outstanding under our $500 million ABL Term Loan Facility. The business encompassed in the CLS Sale had $781.0 million, $853.1 million and $399.2 million of net sales for the Predecessor 2021 Period, the Successor 2021 Period and Fiscal Year 2022 (Successor), respectively, and $42.2 million, $29.0 million and $3.7 million of income from operations for the Predecessor 2021 Period, the Successor 2021 Period and Fiscal Year 2022 (Successor), respectively.
Morgan Stanley Bank, N.A., an affiliate of Morgan Stanley & Co. LLC, JPMorgan Chase Bank, N.A., an affiliate of J.P. Morgan Securities LLC, Royal Bank of Canada, an affiliate of RBC Capital Markets, LLC, and Stifel Bank & Trust, an affiliate of Stifel, Nicolaus & Company, Incorporated, each an underwriter of this offering, are lenders, agents and joint lead arrangers and bookrunners under the ABL Term Loan Facility. As a result of the use of proceeds from the CLS Sale, such affiliates of the underwriters received a portion of the proceeds from the CLS Sale. See UnderwritingOther Relationships.
On April 29, 2022, the Company declared and paid a dividend to our current stockholders of approximately $1.75 billion with proceeds from the primary closing of the CLS Sale.
Recent Developments
Preliminary Estimated Operating Results for the Thirteen Weeks Ended September 28, 2024
Set forth below are preliminary unaudited estimates of certain financial information for the thirteen weeks ended September 28, 2024 and actual unaudited financial information for the thirteen weeks ended September 30, 2023. We have not yet finalized our financial information for the thirteen weeks ended September 28, 2024, and therefore the unaudited financial information for the thirteen weeks ended September 28, 2024 presented herein reflects preliminary estimates and assumptions based on currently available information and is subject to, among other things, completion of our financial closing procedures, which we do not expect to complete for the thirteen weeks ended September 28, 2024 until after the completion of this offering. As a result, while this information is presented with ranges that we consider to be reasonable, it remains in all cases subject to change pending finalization, and our actual results will not be available to you prior to investing in this offering. This financial information should not be viewed as a substitute for full quarterly financial statements prepared in accordance with GAAP. You should also note that additional information on results presented herein will be included in future reports expected to be available only after this offering, such as complete financial results for the thirteen weeks ended September 28, 2024 and September 30, 2023 and footnote disclosures associated with our financial results.
12
Table of Contents
These estimates should not be viewed as a substitute for our historical consolidated financial statements and the accompanying notes included elsewhere in this prospectus. These estimates may not be indicative of the results for any future period as a result of various factors, including, but not limited to, those discussed in the sections titled Risk Factors and Cautionary Note Regarding Forward-Looking Statements.
The preliminary financial data for the thirteen weeks ended September 28, 2024 included in this prospectus has been prepared by, and is the responsibility of, our management. PricewaterhouseCoopers LLP has not audited, reviewed, examined, compiled, nor applied agreed-upon procedures with respect to the preliminary financial data. Accordingly, PricewaterhouseCoopers LLP does not express an opinion or any other form of assurance with respect thereto.
Following the information in the tables below is a discussion of Net Sales, Gross Profit and Income from Operations for the Thirteen Weeks ended September 28, 2024. The trends for this period are consistent with those discussed in Managements Discussion and Analysis of Financial Condition and Results of Operations. For additional information about our non-GAAP financial measures, see Summary Historical and Unaudited Pro Forma Condensed Combined Financial and Other DataNon-GAAP Financial Measures and Managements Discussion and Analysis of Financial Condition and Results of OperationsNon-GAAP Financial Measures.
| Thirteen Weeks Ended September 28, 2024 |
Thirteen Weeks Ended September 30, 2023 |
|||||||||||||||||||||||
| Low (estimate) | High (estimate) | Actual | ||||||||||||||||||||||
| ($ in thousands except share and per share data) |
Amount | % of Net Sales |
Amount | % of Net Sales |
Amount | % of Net Sales |
||||||||||||||||||
| Net Sales |
$ | 11,727,000 | $ | 11,750,000 | $ | 11,925,373 | ||||||||||||||||||
| Gross Profit |
843,000 | 7.19 | % | 845,000 | 7.19 | % | 854,844 | 7.17 | % | |||||||||||||||
| Income from Operations |
213,000 | 1.82 | % | 218,000 | 1.86 | % | 212,402 | 1.78 | % | |||||||||||||||
| Return on Invested Capital |
4.4 | % | 4.7 | % | 5.5 | % | ||||||||||||||||||
| Net Income |
73,000 | 0.62 | % | 77,000 | 0.66 | % | 86,783 | 0.73 | % | |||||||||||||||
| Basic and Diluted Earnings Per Share (1) |
2,746 | 2,896 | 3,265 | |||||||||||||||||||||
| Adjusted Income from Operations (2) |
249,000 | 2.12 | % | 254,000 | 2.16 | % | 265,481 | 2.23 | % | |||||||||||||||
| Adjusted EBITDA (3) |
328,000 | 2.80 | % | 332,000 | 2.83 | % | 313,971 | 2.63 | % | |||||||||||||||
| Adjusted Return on Invested Capital (4) |
11.0 | % | 11.3 | % | 12.4 | % | ||||||||||||||||||
| Non-GAAP Net Income (5) |
155,000 | 1.32 | % | 159,000 | 1.35 | % | 148,611 | 1.25 | % | |||||||||||||||
(1) Basic and Diluted Earnings Per Share figures presented in this table do not take into account the Offering Reorganization Transactions, which includes the effectiveness of our amended and restated certificate of incorporation, stock conversion and a 8,367.19365-for-1 stock split, which will occur after the effectiveness of this registration statement, but prior to the consummation of this offering.
| (2) | Adjusted Income from Operations: |
To provide investors with additional information regarding our financial results, we have disclosed in the table above and elsewhere in this prospectus Adjusted Income from Operations and Adjusted Income from Operations Margin, each of which is a non-GAAP financial measure. Adjusted Income from Operations means income from operations plus (i) amortization of intangibles, (ii) restructuring costs incurred primarily related to employee termination benefits in connection with actions to align our cost structure in certain markets, (iii) integration and transition costs and (iv) the advisory fees paid to Platinum Advisors under the Advisory Agreement (which will be terminated upon the consummation of this offering).
| (3) | Adjusted EBITDA: |
To provide investors with additional information regarding our financial results, we have disclosed in the table above and elsewhere in this prospectus EBITDA and Adjusted EBITDA, each a non-GAAP financial measure.
13
Table of Contents
EBITDA is calculated as net income before net interest expense, income taxes, depreciation and amortization expenses. We define Adjusted EBITDA as EBITDA adjusted to give effect to (i) restructuring costs incurred primarily related to employee termination benefits in connection with actions to align our cost structure in certain markets, (ii) net realized and unrealized foreign currency exchange gains and losses including net gains and losses on derivative instruments not receiving hedge accounting treatment, (iii) costs of integration, transition, and operational improvement initiatives, as well as consulting, retention and transition costs associated with our organizational effectiveness programs charged to selling, general and administrative expenses, (iv) the advisory fees paid to Platinum Advisors under the Advisory Agreement (which will be terminated upon the consummation of this offering), (v) cash-based compensation expense associated with our cash-based long-term incentive program for certain employees in lieu of equity-based compensation, and which we expect to revert back to an equity-based program in the future under the 2024 Plan, see Executive Compensation Compensation Discussion and Analysis and (vi) certain other items as defined in our Credit Agreements.
(4) Adjusted Return on Invested Capital:
Adjusted Return on Invested Capital is defined as Adjusted Net Income divided by the invested capital for the period. Adjusted Net Income for a particular period is defined as net income plus (i) other income/expense, (ii) amortization of intangibles, (iii) restructuring costs incurred primarily related to employee termination benefits in connection with actions to align our cost structure in certain markets, (iv) integration and transition costs, (v) the advisory fees paid to Platinum Advisors under the Advisory Agreement (which will be terminated upon the consummation of this offering), plus (vi) the GAAP tax provisions for and/or valuation allowances on items (i), (ii), (iii), (iv) and (v) plus (vii) the GAAP tax provisions for and/or valuation allowances on large non-recurring or discrete items. Invested capital is equity plus debt less cash and cash equivalents at the end of each period.
(5) Non-GAAP Net Income:
We define Non-GAAP Net Income as Net Income adjusted to give effect to (i) amortization of intangibles, (ii) restructuring costs incurred primarily related to employee termination benefits in connection with actions to align our cost structure in certain markets, (iii) net realized and unrealized foreign currency exchange gains and losses including net gains and losses on derivative instruments not receiving hedge accounting treatment, (iv) costs of integration, transition, and operational improvement initiatives, as well as consulting, retention and transition costs associated with our organizational effectiveness programs charged to selling, general and administrative expenses, (v) the advisory fees paid to Platinum Advisors under the Advisory Agreement (which will be terminated upon the consummation of this offering), (vi) cash-based compensation expense associated with our cash-based long-term incentive program for certain employees in lieu of equity-based compensation, and which we expect to revert back to an equity-based program in the future under the 2024 Plan, see Executive CompensationCompensation Discussion and Analysis, (vii) certain other items as defined in our Credit Agreements, (viii) the GAAP tax provisions for and/or valuation allowances on items (i), (ii), (iii), (iv), (v), (vi) and (vii), and (ix) the
14
Table of Contents
GAAP tax provisions for and/or valuation allowances on large non-recurring or discrete items. This metric differs from Adjusted Net Income, which is a component of Adjusted ROIC as shown above.
| Thirteen Weeks Ended September 28, 2024 |
Thirteen Weeks Ended September 30, 2023 |
|||||||||||
| ($ in thousands) |
Low (estimate) | High (estimate) | Actual | |||||||||
| Income from operations |
$ | 213,000 | $ | 218,000 | $ | 212,402 | ||||||
| Amortization of intangibles |
22,000 | 22,000 | 21,790 | |||||||||
| Restructuring costs |
| | 19,261 | |||||||||
| Integration and transition costs |
8,000 | 8,000 | 5,778 | |||||||||
| Advisory fee |
6,000 | 6,000 | 6,250 | |||||||||
|
|
|
|
|
|
|
|||||||
| Adjusted Income from Operations |
$ | 249,000 | $ | 254,000 | $ | 265,481 | ||||||
|
|
|
|
|
|
|
|||||||
| Net income |
$ | 73,000 | $ | 77,000 | $ | 86,783 | ||||||
| Interest income |
(12,000 | ) | (12,000 | ) | (8,779 | ) | ||||||
| Interest expense |
86,000 | 86,000 | 98,321 | |||||||||
| Provision for income taxes |
42,000 | 42,000 | 33,555 | |||||||||
| Depreciation and amortization |
49,000 | 49,000 | 44,532 | |||||||||
|
|
|
|
|
|
|
|||||||
| EBITDA |
$238,000 | $242,000 | $ | 254,412 | ||||||||
|
|
|
|
|
|
|
|||||||
| Restructuring costs |
| | 19,261 | |||||||||
| Net foreign currency exchange loss (gain) |
11,000 | 11,000 | (10,462 | ) | ||||||||
| Integration, transition and operational improvement costs |
46,000 | 46,000 | 25,834 | |||||||||
| Advisory fee |
6,000 | 6,000 | 6,250 | |||||||||
| Cash-based compensation expense |
6,000 | 6,000 | 6,057 | |||||||||
| Other |
21,000 | 21,000 | 12,619 | |||||||||
|
|
|
|
|
|
|
|||||||
| Adjusted EBITDA |
$328,000 | $332,000 | $ | 313,971 | ||||||||
|
|
|
|
|
|
|
|||||||
| Thirteen Weeks Ended September 28, 2024 |
Thirteen Weeks Ended September 30, 2023 |
|||||||||||
| ($ in thousands) |
Low (estimate) |
High (estimate) |
Actual | |||||||||
| Net income |
$ | 73,000 | $ | 77,000 | $ | 86,783 | ||||||
| Stockholders equity |
3,610,000 | 3,614,000 | 3,230,744 | |||||||||
| Long-term debt |
3,344,000 | 3,344,000 | 3,619,081 | |||||||||
| Short-term debt and current maturities of long-term debt |
494,000 | 494,000 | 352,309 | |||||||||
| Cash and cash equivalents |
(849,000 | ) | (849,000 | ) | (864,627 | ) | ||||||
|
|
|
|
|
|
|
|||||||
| Invested capital |
6,599,000 | 6,603,000 | 6,337,507 | |||||||||
|
|
|
|
|
|
|
|||||||
| Return on invested capital (a) |
4.4 | % | 4.7 | % | 5.5 | % | ||||||
|
|
|
|
|
|
|
|||||||
| Period in weeks for non-52 week periods |
13 | 13 | 13 | |||||||||
| Number of weeks |
52 | 52 | 52 | |||||||||
|
|
|
|
|
|
|
|||||||
15
Table of Contents
| (a) | Return on Invested Capital is defined as net income divided by the invested capital for the period. Invested capital is equal to stockholders equity plus long-term debt plus short-term debt and the current maturities of long-term debt less cash and cash equivalents at the end of each period. |
| Thirteen Weeks Ended September 28, 2024 |
Thirteen Weeks Ended September 30, 2023 |
|||||||||||
| ($ in thousands) |
Low (estimate) | High (estimate) | Actual | |||||||||
| Net income |
$ | 73,000 | $ | 77,000 | $ | 86,783 | ||||||
| Pre-tax adjustments: |
||||||||||||
| Other (income) expense |
99,000 | 99,000 | 92,064 | |||||||||
| Amortization of intangibles |
22,000 | 22,000 | 21,790 | |||||||||
| Restructuring costs |
| | 19,261 | |||||||||
| Integration and transition costs |
8,000 | 8,000 | 5,778 | |||||||||
| Advisory fee |
6,000 | 6,000 | 6,250 | |||||||||
| Tax adjustments: |
||||||||||||
| Tax impact of pre-tax adjustments |
(27,000 | ) | (27,000 | ) | (36,021 | ) | ||||||
| Other discrete items |
1,000 | 1,000 | 551 | |||||||||
|
|
|
|
|
|
|
|||||||
| Adjusted Net Income |
$ | 182,000 | $ | 186,000 | $ | 196,456 | ||||||
|
|
|
|
|
|
|
|||||||
| Stockholders equity |
3,610,000 | 3,614,000 | 3,230,744 | |||||||||
| Long-term debt |
3,344,000 | 3,344,000 | 3,619,081 | |||||||||
| Short-term debt and current maturities of long-term debt |
494,000 | 494,000 | 352,309 | |||||||||
| Cash and cash equivalents |
(849,000 | ) | (849,000 | ) | (864,627 | ) | ||||||
|
|
|
|
|
|
|
|||||||
| Invested Capital |
6,599,000 | 6,603,000 | 6,337,507 | |||||||||
| Number of Days |
91 | 91 | 91 | |||||||||
|
|
|
|
|
|
|
|||||||
| Adjusted Return on Invested Capital |
11.0 | % | 11.3 | % | 12.4 | % | ||||||
|
|
|
|
|
|
|
|||||||
| Thirteen Weeks Ended September 28, 2024 |
Thirteen Weeks Ended September 30, 2023 |
|||||||||||
| ($ in thousands) |
Low (estimate) | High (estimate) | Actual | |||||||||
| Net income |
$ | 73,000 | $ | 77,000 | $ | 86,783 | ||||||
| Pre-tax adjustments: |
||||||||||||
| Amortization of intangibles |
22,000 | 22,000 | 21,790 | |||||||||
| Restructuring costs |
| | 19,261 | |||||||||
| Net foreign currency exchange loss (gain) |
11,000 | 11,000 | (10,462 | ) | ||||||||
| Integration, transition and operational improvement costs |
46,000 | 46,000 | 25,834 | |||||||||
| Advisory fee |
6,000 | 6,000 | 6,250 | |||||||||
| Cash-based compensation expense |
6,000 | 6,000 | 6,057 | |||||||||
| Other items |
19,000 | 19,000 | 11,514 | |||||||||
| Tax Adjustments: |
||||||||||||
| Tax impact of pre-tax adjustments |
(28,000 | ) | (28,000 | ) | (19,631 | ) | ||||||
| Other miscellaneous tax adjustments |
| | 1,215 | |||||||||
|
|
|
|
|
|
|
|||||||
| Non-GAAP Net Income |
$ | 155,000 | $ | 159,000 | $ | 148,611 | ||||||
|
|
|
|
|
|
|
|||||||
16
Table of Contents
The decrease in net sales during the Thirteen Weeks ended September 28, 2024, compared to the Thirteen Weeks Ended September 30, 2023, is primarily due to lower net sales in North America and Latin America, partially offset by growth in our Asia-Pacific region. Advanced solutions offerings net sales declined during the Thirteen Weeks Ended September 28, 2024, offset by growth in net sales of client and endpoint solutions, cloud-based solutions and Other services.
The decrease in gross profit dollars during the Thirteen Weeks ended September 28, 2024, compared to the Thirteen Weeks ended September 30, 2023, is primarily attributed to a decline in net sales, while the increase in gross margin is attributed to a shift in sales mix towards higher-margin cloud-based solutions and Other services net sales, as well as general pricing discipline across the organization.
The increase in income from operations during the Thirteen Weeks ended September 28, 2024, compared to the Thirteen Weeks ended September 30, 2023, is primarily due to the impact of restructuring costs incurred in the Thirteen Weeks ended September 30, 2023. SG&A expense dollars are lower year-over-year resulting primarily from cost reduction and other optimization initiatives. However, SG&A expenses as a percentage of net sales were higher in the Thirteen Weeks ended September 28, 2024, as a result of the lower net sales, described above. Furthermore, our SG&A expenses in the Thirteen Weeks ended September 28, 2024 include approximately $8 million of costs associated with the 2024 Refinancing. See Description of Material Indebtedness and SummaryRecent Developments2024 Refinancing below.
2024 Refinancing
On September 20, 2024, we refinanced our existing Term Loan Credit Facility and repaid $100 million of the principal balance of our outstanding term loans. The refinancing reduced the interest rate spread over SOFR by 25 basis points and eliminated the credit-spread adjustment. Borrowings under the Term Loan Credit Facility bear interest at a rate per annum equal to, at our option, either (1) the base rate (which is the highest of (a) the then-current federal funds rate set by the Federal Reserve Bank of New York, plus 0.50%, (b) the prime rate on such day and (c) the one-month SOFR rate published on such date plus 1.00%) plus a margin of 1.75% or (2) SOFR (subject to a 0.50% floor) plus a margin of 2.75%. Additionally, in connection with such refinancing, we extended the maturity date of the Term Loans (as defined in the Term Loan Credit Agreement) to September 19, 2031 (collectively, the Term Loan Refinancing). As a result of applying the debt guidance under Accounting Standards Codification 470, the refinancing will be primarily treated as a modification, the impacts of which are immaterial.
On September 20, 2024, we entered into Amendment No. 4 to the ABL Credit Agreement, to amend the ABL Credit Agreement to, among other things, extend the maturity date of the Revolving Commitment (as defined therein) to September 20, 2029 (the ABL Extension and together with the Term Loan Refinancing, the 2024 Refinancing).
On September 20, 2024, we borrowed $100 million under our ABL Revolving Credit Facility to repay outstanding term loans as part of the 2024 Refinancing.
Summary Risk Factors
An investment in our Common Stock involves a high degree of risk. Any of the factors set forth under Risk Factors may limit our ability to successfully execute our business strategy. You should carefully consider all of the information set forth in this prospectus, and, in particular, you should evaluate the specific factors set forth under Risk Factors in deciding whether to invest in our Common Stock. Among these important risks are the following:
| | our ability to predict our results of operations, which may fluctuate significantly; |
17
Table of Contents
| | our ability to continue to successfully develop and deploy Ingram Micro Xvantage; |
| | industry and market conditions, inflation, volatility and developments, including supply constraints across many elements of technology; |
| | the level of success of our acquisition and investment strategies; |
| | the provision of transition services to the buyer in the CLS Sale and our ability to adjust our cost base as those transition service agreements expire; |
| | the effect of the COVID-19 pandemic or other public health issues on our business; |
| | our ability to pay cash dividends and our ability to generate the funds necessary to meet our outstanding debt services and other obligations as our sole material asset after the completion of this offering is our direct interest in Ingram Micro Inc.; |
| | our ability to retain and recruit key personnel; |
| | the high level of competition in our industry; |
| | the effect of various political, geo-political and economic issues and our ability to comply with laws and regulations we are subject to, both in the United States and internationally; |
| | our ability to adjust to developments in the economic or regulatory environment; |
| | our financial leverage, which could adversely affect our ability to raise additional capital to fund our operations, and other risks related to indebtedness, which included $3,629.5 million of outstanding debt as of June 29, 2024; |
| | our reliance on third-party service providers to facilitate the sale of our products and solutions; |
| | our ability to maintain existing customers and accurately forecast customer demand; |
| | our ability to maintain, upgrade and protect our information systems; |
| | Platinums significant influence over us and our status as a controlled company under the rules of the NYSE; |
| | the effect of the material weaknesses in our internal control over financial reporting may adversely affect investor confidence and the price of our Common Stock, or impair our ability to comply with applicable laws and regulations; |
| | the volatility of our stock price which may result in stockholders inability to sell shares at or above the price paid; and |
| | the other factors identified under the heading Risk Factors beginning on page 38 of this prospectus. |
Our Relationship with Our Sponsor
Founded in 1995 by Tom Gores, Platinum is a global investment firm with approximately $48 billion of assets under management and a portfolio of approximately 50 operating companies that serve customers around the world. Platinum specializes in mergers, acquisitions and operationsa trademarked strategy it calls M&A&O®acquiring and operating companies in a broad range of business markets, including manufacturing, distribution, transportation and logistics, equipment rental, metals services, media and entertainment, technology, telecommunications and other industries. Over the past 29 years, Platinum has completed more than 450 acquisitions.
Platinum will participate as a selling stockholder and receive net proceeds of approximately $142.2 million (or approximately $198.9 million if the underwriters exercise in full their option to purchase additional shares of
18
Table of Contents
Common Stock from the selling stockholder as described herein) from the sale of their shares of Common Stock in this offering, assuming (i) an initial public offering price of $21.50 per share (the midpoint of the estimated price range set forth on the cover page of this prospectus) and (ii) all shares offered by the selling stockholder in this offering are sold (other than pursuant to the underwriters option to purchase additional shares as described herein).
Following the consummation of the Imola Mergers, the Company (and/or one of its affiliates) and Platinum Advisors entered into a Corporate Advisory Services Agreement, dated as of July 2, 2021 (the Advisory Agreement), pursuant to which the Company engaged Platinum Advisors as a financial, transactional and management consultant. Under the Advisory Agreement, the Company has agreed to pay Platinum Advisors an annual management fee in an amount to be mutually agreed between the parties and to reimburse Platinum Advisors for its out-of-pocket costs and expenses incurred in connection with its services under the agreement. In 2023, the aggregate management fee was $25 million. The Advisory Agreement contains customary indemnification provisions in favor of Platinum Advisors. The Advisory Agreement will be terminated upon the consummation of this offering.
In connection with this offering, we intend to enter into an investor rights agreement with Platinum (the Investor Rights Agreement) and prior to the consummation of this offering, our amended and restated certificate of incorporation will become effective. Pursuant to our amended and restated certificate of incorporation and the Investor Rights Agreement, Platinum will have the right to nominate for election to our board of directors individuals designated by Platinum in accordance with the respective provisions set forth in our amended and restated certificate of incorporation and the Investor Rights Agreement. Pursuant to our amended and restated certificate of incorporation and the Investor Rights Agreement, Platinum will retain the right to nominate for election to our board of directors a majority of our directors for so long as it beneficially owns at least 50% of the voting power of all shares of our outstanding stock entitled to vote generally in the election of our directors. See Certain Relationships and Related Person TransactionsAgreements to Be Entered into in Connection with this OfferingInvestor Rights Agreement and Description of Capital Stock. Immediately following this offering, Platinum will beneficially own 90.8% of the voting power of our Common Stock, or 89.6% if the underwriters exercise in full their option to purchase additional shares of Common Stock from the selling stockholder as described herein, and Platinums interests may conflict with ours or yours in the future. See Risk FactorsRisks Related to Our Relationship with Platinum and Being a Controlled CompanyPlatinum controls us, and its interests may conflict with ours or other stockholders in the future. Even when Platinum ceases to own shares of our stock representing a majority of the total voting power, for so long as Platinum continues to own a significant percentage of our stock, it will still be able to significantly influence or effectively control the composition of our board of directors and the approval of actions requiring stockholder approval through its voting power. Accordingly, for such period of time, Platinum will have significant influence with respect to our management, business plans and policies, including the appointment and removal of our officers.
Corporate Information
Our business was founded in 1979 as Micro D Inc. Ingram Micro Holding Corporation (formerly known as Imola Holding Corporation) was incorporated on September 28, 2020 to serve as a holding company in connection with the Imola Mergers. Ingram Micro Holding Corporation had immaterial operations from September 28, 2020 to the Acquisition Closing Date. Our principal offices are located at 3351 Michelson Drive, Suite 100, Irvine, CA 92612. Our telephone number is (714) 566-1000. We maintain a website, www.ingrammicro.com. The information on, or that can be accessed through, our website is not part of this prospectus and you should not rely on any such information in making the decision whether to purchase shares of our Common Stock.
19
Table of Contents
The Offering
| Issuer |
Ingram Micro Holding Corporation |
| Selling Stockholder |
Imola JV Holdings, L.P. (the selling stockholder) |
| Common Stock offered by us |
11,600,000 shares. |
| Common Stock offered by the selling stockholder |
7,000,000 shares. |
| Underwriters option to purchase additional shares of Common Stock from the selling stockholder |
The selling stockholder has granted the underwriters an option to purchase up to an additional 2,790,000 shares of Common Stock, solely to cover over-allotments, if any, at the public offering price less underwriting discounts and commissions, for 30 days after the date of this prospectus. |
| Common Stock to be outstanding after this offering |
235,495,185 shares. |
| Use of proceeds |
We estimate that the net proceeds to us from this offering will be approximately $227.6 million, assuming an initial public offering price of $21.50 per share (the midpoint of the estimated price range set forth on the cover page of this prospectus), and after deducting the underwriting discounts and commissions and estimated offering expenses payable by us. |
| We estimate that the net proceeds to the selling stockholder from this offering will be approximately $142.2 million or, if the underwriters exercise in full their option to purchase additional shares of Common Stock as described herein, approximately $198.9 million, in each case, assuming an initial public offering price of $21.50 per share (the midpoint of the estimated price range set forth on the cover page of this prospectus), and after deducting the underwriting discounts and commissions and estimated offering expenses payable by us. We will not receive any proceeds from the sale of shares by the selling stockholder, including pursuant to any exercise by the underwriters of their option to purchase additional shares of our Common Stock from the selling stockholder, but we will be required to pay the underwriting discounts and commissions associated with such sales of shares. See Use of Proceeds and Underwriting. |
| We currently expect to use the net proceeds that we receive from the sale of shares of Common Stock in this offering to pay down a portion of the Term Loan Credit Facility. See Use of Proceeds beginning on page 83 for a more complete description of the intended use of proceeds from this offering and Underwriting. Following the consummation of this offering and use of proceeds |
20
Table of Contents
therefrom, and taking into account the 2024 Refinancing, we expect to have approximately $932.4 million in principal amount of borrowings outstanding thereunder. See Use of Proceeds and Capitalization.
| Following the 2024 Refinancing, as of September 20, 2024, $1,160 million was outstanding under the Term Loan Credit Facility. JPMorgan Chase Bank, N.A., an affiliate of J.P. Morgan Securities LLC, an underwriter of this offering, is a lender and joint lead arranger and bookrunner under the Term Loan Credit Facility. On or about October 1, 2024, JPMorgan Chase Bank, N.A. held approximately $51.0 million of term loans outstanding under the Term Loan Credit Facility (which is approximately 4.40% of the outstanding borrowings thereunder). Jefferies Finance LLC, an affiliate of Jefferies LLC, an underwriter of this offering, is a lender under the Term Loan Credit Facility. On or about October 1, 2024, Jefferies Finance LLC held approximately $6.3 million of term loans outstanding under the Term Loan Credit Facility (which is approximately 0.54% of the outstanding borrowings thereunder). Raymond James Bank, an affiliate of Raymond James & Associates, Inc., an underwriter of this offering, is a lender under the Term Loan Credit Facility. On or about October 1, 2024, Raymond James Bank held approximately $25.0 million of term loans outstanding under the Term Loan Credit Facility (which is approximately 2.16% of the outstanding borrowings thereunder). Stifel Bank & Trust, an affiliate of Stifel, Nicolaus & Company, Incorporated, an underwriter of this offering, is a lender and joint lead arranger and bookrunner under the Term Loan Credit Facility. On or about October 1, 2024, Stifel Bank & Trust held approximately $7.9 million of term loans outstanding under the Term Loan Credit Facility (which is approximately 0.68% of the outstanding borrowings thereunder). As a result of the foregoing, in the event we repay a portion of the outstanding borrowings under the Term Loan Credit Facility with the net proceeds of this offering, then neither J.P. Morgan Securities LLC, Jefferies LLC, Raymond James & Associates, Inc., Stifel, Nicolaus & Company, Incorporated, nor any of the other underwriters will have a conflict of interest with us within the meaning of Rule 5121, as administered by FINRA, as none of the underwriters are expected to receive more than 5% of the proceeds of this offering. See Description of Material Indebtedness, Use of Proceeds and Underwriting. |
| Controlled company |
After the completion of this offering and assuming an offering of 11,600,000 shares of Common Stock by us and 7,000,000 shares of Common Stock by the selling stockholder, Platinum will continue to control approximately 90.8% of the voting power of our outstanding Common Stock (or 89.6% of the voting power of all of our outstanding shares of Common Stock if the underwriters exercise in full their option to purchase additional shares of Common Stock as described herein) from the selling stockholder, and thus, in each case, hold more than a majority of the voting power of our outstanding Common Stock. As a result, we will be a controlled company under the NYSE corporate |
21
Table of Contents
| governance standards. Under these standards, a company of which more than 50% of the voting power is held by an individual, group, or another company is a controlled company and may elect not to comply with certain corporate governance standards. See ManagementControlled Company Exception. |
| Dividend policy |
We anticipate paying a quarterly cash dividend on our Common Stock of $0.074 per share beginning in the first quarter of 2025. We anticipate paying aggregate cash dividends of $70 million per annum on our Common Stock, resulting in an annual yield of 1.4% based on a price of $21.50 per share, which is the midpoint of the estimated price range set forth on the cover page of this prospectus. Any decision to declare and pay dividends in the future will be, subject to our compliance with applicable law, made at the sole discretion of our board of directors and will depend on, among other things, general and economic conditions, our financial condition and results of operations, our available cash and current and anticipated cash needs, capital requirements, contractual and tax implications on the payment of dividends by us to our stockholders or by our subsidiaries to us, including restrictions and subject to the covenants under our Credit Facilities, the Indenture governing the 2029 Notes and any other future indebtedness or preferred securities we may incur or issue, and such other factors as our board of directors may deem relevant. See Dividend Policy and Description of Material Indebtedness. |
| Exchange symbol |
INGM. |
| Indication of interest |
The cornerstone investor has indicated an interest in purchasing up to an aggregate of $70 million in shares of Common Stock in this offering at the initial public offering price. The shares of Common Stock to be purchased by the cornerstone investor will not be subject to a lock-up agreement with the underwriters. Because indications of interest are not binding agreements or commitments to purchase, the cornerstone investor may determine to purchase more, less or no shares in this offering or the underwriters may determine to sell more, less or no shares to the cornerstone investor. The underwriters will receive the same discount on any of our shares of Common Stock purchased by the cornerstone investor as they will from any other shares of Common Stock sold to the public in this offering. |
| Reserved share program |
At our request, an affiliate of BofA Securities, Inc., a participating underwriter, has reserved for sale, at the initial public offering price, up to 5% of the shares of Common Stock offered by this prospectus for sale to some of our directors, officers and employees, as well as to certain employees of Platinum and/or Platinum Advisors. If these persons purchase reserved shares it will reduce the number of shares available for sale to the general public. Any reserved shares that are not so purchased will be offered by the underwriters to the general public on the same terms as the other shares of Common Stock offered by this prospectus. If any reserved shares are purchased by |
22
Table of Contents
| persons who are subject to lock-up restrictions, such shares of Common Stock will be subject to lock-up restrictions pursuant to the lock-up agreements as further described herein. See UnderwritingReserved Share Program. |
| Risk factors |
You should read the Risk Factors section of this prospectus, together with all of the other information set forth in this prospectus, for a discussion of factors to consider carefully before deciding to invest in shares of our Common Stock. |
The number of shares of our Common Stock outstanding after this offering is based on 235,495,185 shares outstanding as of June 29, 2024, and excludes the following:
| | Except as explained below, 20,347,826 shares of Common Stock reserved for issuance under the 2024 Plan that we intend to adopt in connection with this offering. The above discussion reflects (i) 1,402,162 shares of Common Stock underlying the restricted stock units that we intend to grant in connection with this offering that will vest on the first trading day following the effective date of this registration statement (based on an assumed initial public offering price of $21.50 per share, which is the midpoint of the estimated offering price range set forth on the cover page of this prospectus) (the Initial Grants) and (ii) 93,023 time vesting restricted stock units granted under the 2024 Plan in connection with this offering in accordance of the terms of the Third Amended and Restated Monié Transition Agreement (the Monié Grant). See Executive CompensationCompensation Discussion and Analysis2024 Stock Incentive Plan. The shares reserved for future issuance under the 2024 Plan include 5,098,828 shares of Common Stock (based on an assumed initial public offering price of $21.50 per share, which is the midpoint of the estimated offering price range set forth on the cover page of this prospectus) issuable upon the vesting of 2,621,381 time vesting restricted stock units and 2,477,447 performance vesting restricted stock units that we intend to grant in connection with this offering (of the 2,621,381 time vesting restricted stock units, the Initial Grants and the Monié Grant will vest on the first trading day following the effective date of this registration statement and the remaining time vesting restricted stock units (other than with respect to grants to our non-employee directors) will vest over a multi-year period subject to the award holders continuous service with us, or, if earlier, upon the achievement of specified returns on invested capital by Platinum). Any increase or decrease in the actual initial public offering price will impact the number of shares underlying the Initial Grants and Monié Grant. One-half of the performance vesting restricted stock units will vest upon a qualifying event, whereby the return on invested capital achieved by Platinum is two times the total of all capital or other contributions made by Platinum and the remaining one-half will vest upon a qualifying event whereby the return on invested capital achieved by Platinum is two and one-half times the total of all capital or other contributions made by Platinum, in each case, except in certain circumstances as specified in the award agreement, subject to the grantees continuous service with us through such qualifying event. See Executive CompensationCompensation Discussion and AnalysisRSU and PSU Grants Under the 2024 Stock Incentive Plan for additional information regarding the performance vesting terms that will apply to our performance vesting restricted stock units and see Executive CompensationCompensation Discussion and AnalysisDirector Compensation for a description of our non-employee director compensation plan. |
Except as otherwise indicated, information in this prospectus reflects or assumes the following:
| | no exercise of the underwriters option to purchase up to 2,790,000 additional shares of Common Stock (solely to cover over-allotments, if any) from the selling stockholder; |
| | an initial public offering price of $21.50 per share of Common Stock (the midpoint of the estimated price range set forth on the cover page of this prospectus); and |
23
Table of Contents
| | the Offering Reorganization Transactions, which includes the effectiveness of our amended and restated certificate of incorporation, stock conversion and a 8,367.19365-for-1 stock split, which will occur after the effectiveness of this registration statement, but prior to the consummation of this offering. |
24
Table of Contents
Summary Historical and Unaudited Pro Forma Condensed Combined Financial and Other Data
The following tables present summary historical consolidated financial and unaudited pro forma condensed combined financial and other data for Ingram Micro Holding Corporation and its subsidiaries as of and for the periods indicated. For the purpose of discussing our financial results, (i) we refer to ourselves as the Successor in the periods following the Imola Mergers and the Predecessor during the periods preceding the Imola Mergers and (ii) we refer to the period from January 3, 2021 to July 2, 2021 as the Predecessor 2021 Period and the period from July 3, 2021 to January 1, 2022 as the Successor 2021 Period. The financial information of the Company has been separated by a vertical line on the face of the consolidated financial statements to distinguish the Successor and Predecessor periods. See Note 1, Organization and Basis of Presentation, to our audited consolidated financial statements. The Companys summary historical financial data for the Predecessor 2021 Period, Successor 2021 Period, as of January 1, 2022 (Successor), for the respective periods as of and for the Fiscal Years ended December 31, 2022 (Successor), or Fiscal Year 2022 (Successor), and December 30, 2023 (Successor), or Fiscal Year 2023 (Successor), have been derived from our audited consolidated financial statements, which are included elsewhere in this prospectus. The Companys summary historical financial data for the Unaudited 2023 Interim Period (Successor) and the Unaudited 2024 Interim Period (Successor) have been derived from our unaudited condensed consolidated financial statements, which are included elsewhere in this prospectus. The Companys summary historical financial data for the Fiscal Year ended January 2, 2021 (Predecessor), or Fiscal Year 2020 (Predecessor), has been derived from our audited consolidated financial statements, which are not included in this prospectus. In addition, this Summary Historical and Unaudited Pro Forma Condensed Combined Financial and Other Data has been corrected to give effect to the revision of our consolidated balance sheet, consolidated statement of income and consolidated statements of cash flows, as more fully described in Note 2, Significant Accounting PoliciesRevision of Previously Issued Consolidated Financial Statements, to our audited consolidated financial statements, and to the revision of our condensed consolidated statement of cash flows, as more fully described in Note 2, Summary of Significant Accounting PoliciesRevision of Previously Issued Condensed Consolidated Financial Statements, to our unaudited condensed consolidated financial statements. The results of operations for any period are not necessarily indicative of our future financial condition or results of operations.
To facilitate comparability of Fiscal Year 2022 (Successor) and Fiscal Year 2023 (Successor) to the fiscal year ended January 1, 2022, we have also included summary unaudited pro forma condensed combined financial information for key financial metrics and results of operations for the year ended January 1, 2022 (the Unaudited Pro Forma 2021 Combined Period), which gives effect to the Imola Mergers as if they had occurred on January 3, 2021. The summary unaudited pro forma condensed combined financial data has been derived from our unaudited pro forma condensed combined statement of income included elsewhere in this prospectus. The summary unaudited pro forma condensed combined financial data is presented for illustrative purposes only and is not necessarily indicative of the operating results that would have occurred if such transactions had been consummated on the date indicated, nor is it indicative of future operating results. See Unaudited Pro Forma Condensed Combined Statement of Income.
The information set forth below under the column heading As Adjusted gives effect to the effectiveness of our amended and restated certificate of incorporation and stock conversion, each of which will occur prior to the consummation of this offering. The information set forth below under the column heading As Further Adjusted further adjusts for the consummation of this offering and use of proceeds therefrom by giving further effect to (i) the sale by us of 11,600,000 shares of Common Stock and the sale by the selling stockholder of 7,000,000 shares of Common Stock, in each case, in this offering at an assumed initial public offering price of $21.50 per share (the midpoint of the estimated price range set forth on the cover of this prospectus) and (ii) the application of the net proceeds to be received by us as described in Use of Proceeds.
25
Table of Contents
You should read the following summary financial and other data below together with the information under Capitalization, Managements Discussion and Analysis of Financial Condition and Results of Operations and our audited consolidated financial statements and related notes and our unaudited pro forma condensed combined financial statements and related notes, each included elsewhere in this prospectus.
| Predecessor | Successor | Combined | Successor | |||||||||||||||||||||||||||||
| Fiscal Year 2020 |
Predecessor 2021 Period |
Successor 2021 Period |
Unaudited Pro Forma Combined 2021 Period |
Fiscal Year 2022 |
Fiscal Year 2023 |
Unaudited 2023 Interim Period |
Unaudited 2024 Interim Period |
|||||||||||||||||||||||||
| (Amounts in thousands, except share and per share data) |
Year Ended January 2, 2021 |
Period from January 3, 2021 to July 2, 2021 |
Period from July 3, 2021 to January 1, 2022 |
Fiscal Year Ended January 1, 2022 |
Year Ended December 31, 2022 |
Year Ended December 30, 2023 |
Twenty-six Weeks Ended July 1, 2023 |
Twenty-six Weeks Ended June 29, 2024 |
||||||||||||||||||||||||
| Consolidated Statement of Income Data: |
||||||||||||||||||||||||||||||||
| Net sales |
$ | 49,120,453 | $ | 26,406,869 | $ | 28,048,703 | $ | 54,455,572 | $ | 50,824,490 | $ | 48,040,364 | $ | 23,095,490 | $ | 22,876,373 | ||||||||||||||||
| Cost of sales |
45,510,256 | 24,419,489 | 25,925,610 | 50,345,099 | 47,131,098 | 44,493,227 | 21,381,857 | 21,213,005 | ||||||||||||||||||||||||
|
|
|
|
|
|
|
|
|
|
|
|
|
|
|
|
|
|||||||||||||||||
| Gross profit |
3,610,197 | 1,987,380 | 2,123,093 | 4,110,473 | 3,693,392 | 3,547,137 | 1,713,633 | 1,663,368 | ||||||||||||||||||||||||
|
|
|
|
|
|
|
|
|
|
|
|
|
|
|
|
|
|||||||||||||||||
| Operating expenses (income): |
||||||||||||||||||||||||||||||||
| Selling, general and administrative |
2,718,689 | 1,459,364 | 1,684,170 | 3,203,846 | 2,716,234 | 2,583,993 | 1,312,794 | 1,289,594 | ||||||||||||||||||||||||
| Merger-related costs |
| 2,314 | 114,332 | 116,646 | 1,910 | | | | ||||||||||||||||||||||||
| Restructuring costs |
1,186 | 202 | 831 | 1,033 | 10,138 | 18,797 | (171 | ) | 22,525 | |||||||||||||||||||||||
| Gain on CLS Sale |
| | | | (2,283,820 | ) | | | | |||||||||||||||||||||||
|
|
|
|
|
|
|
|
|
|
|
|
|
|
|
|
|
|||||||||||||||||
| Total operating expenses |
2,719,875 | 1,461,880 | 1,799,333 | 3,321,525 | 444,462 | 2,602,790 | 1,312,623 | 1,312,119 | ||||||||||||||||||||||||
|
|
|
|
|
|
|
|
|
|
|
|
|
|
|
|
|
|||||||||||||||||
| Income from operations |
890,322 | 525,500 | 323,760 | 788,948 | 3,248,930 | 944,347 | 401,010 | 351,249 | ||||||||||||||||||||||||
|
|
|
|
|
|
|
|
|
|
|
|
|
|
|
|
|
|||||||||||||||||
| Other (income) expense: |
||||||||||||||||||||||||||||||||
| Interest income |
(22,773 | ) | (11,744 | ) | (6,306 | ) | (18,050 | ) | (22,911 | ) | (34,977 | ) | (16,381 | ) | (20,365 | ) | ||||||||||||||||
| Interest expense |
86,693 | 44,281 | 183,208 | 312,642 | 320,230 | 380,191 | 186,430 | 171,536 | ||||||||||||||||||||||||
| Net foreign currency exchange (gain) loss |
(9,001 | ) | 1,419 | 17,473 | 18,892 | 69,597 | 42,070 | 29,103 | 19,263 | |||||||||||||||||||||||
| Other (income) expense |
(2,263 | ) | (13,410 | ) | 12,628 | (782 | ) | 67,473 | 34,562 | 12,497 | 20,971 | |||||||||||||||||||||
|
|
|
|
|
|
|
|
|
|
|
|
|
|
|
|
|
|||||||||||||||||
| Total other (income) expense |
52,656 | 20,546 | 207,003 | 312,702 | 434,389 | 421,846 | 211,649 | 191,405 | ||||||||||||||||||||||||
|
|
|
|
|
|
|
|
|
|
|
|
|
|
|
|
|
|||||||||||||||||
| Income before income taxes |
837,666 | 504,954 | 116,757 | 476,246 | 2,814,541 | 522,501 | 189,361 | 159,844 | ||||||||||||||||||||||||
| Provision for income taxes |
197,195 | 126,479 | 20,023 | 110,136 | 420,052 | 169,789 | 59,956 | 55,707 | ||||||||||||||||||||||||
|
|
|
|
|
|
|
|
|
|
|
|
|
|
|
|
|
|||||||||||||||||
| Net income |
$ | 640,471 | $ | 378,475 | $ | 96,734 | $ | 366,110 | $ | 2,394,489 | $ | 352,712 | $ | 129,405 | $ | 104,137 | ||||||||||||||||
|
|
|
|
|
|
|
|
|
|
|
|
|
|
|
|
|
|||||||||||||||||
| Weighted average shares of common stock outstanding |
100 | 100 | 26,473 | 26,427 | 26,580 | 26,580 | 26,580 | 26,580 | ||||||||||||||||||||||||
|
|
|
|
|
|
|
|
|
|
|
|
|
|
|
|
|
|||||||||||||||||
| Basic and diluted earnings per share |
6,404,710 | 3,784,750 | 3,654 | 13,854 | 90,086 | 13,270 | 4,869 | 3,918 | ||||||||||||||||||||||||
|
|
|
|
|
|
|
|
|
|
|
|
|
|
|
|
|
|||||||||||||||||
26
Table of Contents
| Successor | ||||||||
| Fiscal Year 2023 | Unaudited 2024 Interim Period |
|||||||
| Year Ended December 30, 2023 |
Twenty-six Weeks Ended June 29, 2024 |
|||||||
| Weighted average shares of Common Stock used to compute as further adjusted earnings per share, basic (unaudited) (1) (2) (3) |
235,402,162 | 235,745,886 | ||||||
|
|
|
|
|
|||||
| Weighted average shares of Common Stock used to compute as further adjusted earnings per share, diluted (unaudited) (1) (2) (3) |
235,574,035 | 235,803,990 | ||||||
|
|
|
|
|
|||||
| As further adjusted earnings per share, basic (unaudited) (1) (2) (3) |
$ | 1.39 | $ | 0.46 | ||||
|
|
|
|
|
|||||
| As further adjusted earnings per share, diluted (unaudited) (1) (2) (3) |
$ | 1.39 | $ | 0.46 | ||||
|
|
|
|
|
|||||
| (1) | Gives effect to our amended and restated certificate of incorporation and stock conversion, each of which will occur prior to the consummation of this offering. |
| (2) | Gives effect to the adjustments set forth in note (1) above as well as: (i) stock-based compensation expense of $30.1 million associated with the Initial Grants, (ii) the sale by us of 11,600,000 shares of Common Stock in this offering at an assumed initial public offering price of $21.50 per share (the midpoint of the estimated price range set forth on the cover of this prospectus) and (iii) the application of the net proceeds to be received by us as described in Use of Proceeds. |
| (3) | Assumes the offering was consummated at the beginning of Fiscal Year 2023 (Successor). |
27
Table of Contents
The following is a reconciliation of both the numerator and denominator used in the as further adjusted per share calculations above (in thousands).
| Successor | ||||||||
| Fiscal Year 2023 | Unaudited 2024 Interim Period |
|||||||
| Year Ended December 30, 2023 |
Twenty-six Weeks Ended June 29, 2024 |
|||||||
| (in thousands except share and per share data) |
||||||||
| Adjustments to the numerator, basic |
||||||||
| Net income, as reported |
$ | 352,712 | $ | 104,137 | ||||
| Adjustments: |
||||||||
| Stock-based compensation expense, net of tax benefit (1) |
(33,333 | ) | (2,218 | ) | ||||
| Interest expense, net of tax expense (2) |
7,050 | 5,679 | ||||||
|
|
|
|
|
|||||
| As further adjusted net income, basic |
326,429 | 107,598 | ||||||
| Adjustments to the denominator, basic |
||||||||
| Weighted average shares outstanding, as reported |
26,580 | 26,580 | ||||||
| Adjustments: |
||||||||
| Offering Reorganization Transactions (3) |
222,373,420 | 222,373,420 | ||||||
| Common Stock issued in connection with this offering to partially repay Term Loan Credit Facility (4) |
11,600,000 | 11,600,000 | ||||||
| Time vesting restricted stock units (5) |
1,402,162 | 1,745,886 | ||||||
| Weighted average shares used to calculate as further adjusted earnings per share, basic |
235,402,162 | 235,745,886 | ||||||
| As further adjusted earnings per share, basic |
$ | 1.39 | $ | 0.46 | ||||
| As further adjusted net income, diluted |
326,429 | 107,598 | ||||||
| Weighted average shares used to compute as further adjusted earnings per share, basic |
235,402,162 | 235,745,886 | ||||||
| Adjustments: |
||||||||
| Time vesting restricted stock units (6) |
171,873 | 58,104 | ||||||
| Weighted average shares used to calculate as further adjusted earnings per share, diluted |
235,574,035 | 235,803,990 | ||||||
| As further adjusted earnings per share, diluted |
$ | 1.39 | $ | 0.46 | ||||
| (1) | Reflects additional stock-based compensation expense, net of tax benefit of $4.2 million and $0.3 million for Fiscal Year 2023 (Successor) and the Unaudited 2024 Interim Period (Successor), respectively, related to the Initial Grants. |
| (2) | Reflects the reduction of interest expense, net of tax expense of $2.4 million and $1.9 million for Fiscal Year 2023 (Successor) and the Unaudited 2024 Interim Period (Successor), respectively, related to the paydown of $227.6 million of outstanding indebtedness under the Term Loan Credit Facility as a result of the application of the net proceeds to be received by us as described in Use of Proceeds. |
| (3) | Reflects the conversion of our Class A voting common stock and Class B non-voting common stock into Common Stock on a 1-for-1 basis pursuant to our amended and restated certificate of incorporation, which will occur prior to the consummation of this offering, and reflects the 8,367.19365-for-1 stock split with respect to our Common Stock pursuant to our amended and restated certificate of incorporation, which will occur after the effectiveness of this registration statement, but prior to the consummation of this offering. |
| (4) | Reflects the amount of Common Stock issued in this offering at an assumed initial public offering price of $21.50 per share (the midpoint of the estimated price range set forth on the cover of this prospectus) related to the paydown of $227.6 million of outstanding indebtedness under the Term Loan Credit Facility as described in Use of Proceeds. |
28
Table of Contents
| (5) | Reflects the vesting of the Initial Grants. |
| (6) | Reflects the dilutive effects of applying the treasury stock method to the Initial Grants. |
| Successor | Successor | Unaudited 2024 Interim Period |
As Adjusted (1) |
As Further Adjusted (2) |
||||||||||||||||
| (Amounts in thousands) | December 31, 2022 |
December 30, 2023 |
June 29, 2024 | June 29, 2024 | June 29, 2024 | |||||||||||||||
| Balance Sheet Data: |
||||||||||||||||||||
| Cash and cash equivalents |
$ | 1,320,137 | $ | 948,490 | $ | 928,762 | $ | 928,762 | $ | 928,762 | ||||||||||
| Property and equipment, net |
349,450 | 452,613 | 471,999 | 471,999 | 471,999 | |||||||||||||||
| Total assets |
19,087,975 | 18,420,314 | 17,611,572 | 17,611,572 | 17,611,572 | |||||||||||||||
| Total liabilities |
16,029,907 | 14,914,025 | 14,147,867 | 14,147,867 | 13,922,715 | |||||||||||||||
| Total stockholders equity |
3,058,068 | 3,506,289 | 3,463,705 | 3,463,705 | 3,688,857 | |||||||||||||||
| (1) | Gives effect to our amended and restated certificate of incorporation and stock conversion, each of which will occur prior to the consummation of this offering. |
| (2) | Gives effect to the adjustments set forth in note (1) above as well as: (i) stock-based compensation expense of $30.1 million associated with the Initial Grants, (ii) the sale by us of 11,600,000 shares of Common Stock in this offering at an assumed initial public offering price of $21.50 per share (the midpoint of the estimated price range set forth on the cover of this prospectus) and (iii) the application of the net proceeds to be received by us as described in Use of Proceeds. |
| Predecessor | Successor | |||||||||||||||||||||||||||
| Fiscal Year 2020 |
Predecessor 2021 Period |
Successor 2021 Period |
Fiscal Year 2022 |
Fiscal Year 2023 |
Unaudited 2023 Interim Period |
Unaudited 2024 Interim Period |
||||||||||||||||||||||
| (Amounts in thousands) | Year Ended January 2, 2021 |
Period from January 3, 2021 to July 2, 2021 |
Period from July 3, 2021 to January 1, 2022 |
Year Ended December 31, 2022 |
Year Ended December 30, 2023 |
Twenty-six Weeks Ended July 1, 2023 |
Twenty-six Weeks Ended June 29, 2024 |
|||||||||||||||||||||
| Cash Flow Data: |
||||||||||||||||||||||||||||
| Net cash provided by (used in): |
||||||||||||||||||||||||||||
| Operating activities |
$ | 1,491,172 | $ | (614,064 | ) | $ | 231,763 | $ | (361,109 | ) | $ | 58,824 | $ | 315,772 | $ | 300,918 | ||||||||||||
| Capital expenditures |
(135,125 | ) | (63,160 | ) | (86,584 | ) | (135,785 | ) | (201,535 | ) | (104,207 | ) | (68,688 | ) | ||||||||||||||
| Other investing activities |
96,910 | 32,437 | (7,635,655 | ) | 3,164,553 | 183,821 | 75,355 | 115,755 | ||||||||||||||||||||
| Financing activities |
(817,529 | ) | 798,388 | 7,257,854 | (2,465,313 | ) | (477,940 | ) | (535,335 | ) | (310,663 | ) | ||||||||||||||||
29
Table of Contents
Non-GAAP Financial Measures
We monitor the following key non-GAAP financial measures to help us evaluate our business, identify trends affecting our business, measure our performance, formulate business plans and make strategic decisions. Certain judgments and estimates are inherent in our processes to calculate these metrics. We believe that, in addition to our results determined in accordance with GAAP the following metrics are useful in evaluating our business and the underlying trends that are affecting our performance.
| Predecessor | Successor | Combined | Successor | |||||||||||||||||||||||||||||
| Fiscal Year 2020 |
Predecessor 2021 Period |
Successor 2021 Period |
Unaudited Pro Forma Combined 2021 Period |
Fiscal Year 2022 |
Fiscal Year 2023 |
Unaudited 2023 Interim Period |
Unaudited 2024 Interim Period |
|||||||||||||||||||||||||
| (Amounts in thousands) | Year Ended January 2, 2021 |
Period from January 3, 2021 to July 2, 2021 |
Period from July 3, 2021 to January 1, 2022 |
Fiscal Year Ended January 1, 2022 |
Year Ended December 31, 2022 |
Year Ended December 30, 2023 |
Twenty-six Weeks Ended July 1, 2023 |
Twenty-six Weeks Ended June 29, 2024 |
||||||||||||||||||||||||
| Non-GAAP Financial Data |
||||||||||||||||||||||||||||||||
| Adjusted Income |
$ | 972,975 | $ | 549,684 | $ | 613,906 | $ | 1,134,441 | $ | 1,162,132 | $ | 1,103,561 | $ | 465,249 | $ | 440,475 | ||||||||||||||||
| Adjusted Income from Operations Margin % (1) |
1.98 | % | 2.08 | % | 2.19 | % | 2.08 | % | 2.29 | % | 2.30 | % | 2.01 | % | 1.93 | % | ||||||||||||||||
| Adjusted Return on Invested Capital % (2) |
15.6 | % | 21.7 | % | 14.4 | % | 14.1 | % | 12.4 | % | 11.5 | % | 10.4 | % | ||||||||||||||||||
| EBITDA (3) |
$ | 1,096,127 | $ | 637,033 | $ | 431,143 | $ | 1,045,806 | $ | 3,308,971 | $ | 1,051,863 | $ | 453,648 | $ | 403,476 | ||||||||||||||||
| Adjusted EBITDA (3) |
$ | 1,169,892 | $ | 647,770 | $ | 746,278 | $ | 1,384,178 | $ | 1,349,399 | $ | 1,353,092 | $ | 603,731 | $ | 568,999 | ||||||||||||||||
| Non-GAAP Net Income (4) |
$ | 727,297 | $ | 400,512 | $ | 322,001 | $ | 634,435 | $ | 678,746 | $ | 638,118 | $ | 268,605 | $ | 255,627 | ||||||||||||||||
| Adjusted Free Cash Flow (5) |
$ | 1,472,926 | $ | (626,795 | ) | $ | 205,483 | $ | (351,891 | ) | $ | 19,911 | $ | 287,983 | $ | 360,745 | ||||||||||||||||
| (1) | Adjusted Income from Operations and Adjusted Income from Operations Margin: |
To provide investors with additional information regarding our financial results, we have disclosed in the table above and elsewhere in this prospectus Adjusted Income from Operations and Adjusted Income from Operations Margin, each of which is a non-GAAP financial measure. Adjusted Income from Operations means income from operations plus (i) amortization of intangibles, (ii) restructuring costs incurred primarily related to employee termination benefits in connection with actions to align our cost structure in certain markets, (iii) integration and transition costs and (iv) advisory fee paid to Platinum Advisors under the Advisory Agreement (which will be terminated upon the consummation of this offering). Adjusted Income from Operations Margin means Adjusted Income from Operations divided by net sales. Adjusted Income from Operations and Adjusted Income from Operations Margin have limitations as analytical tools, and you should not consider either measure in isolation or as a substitute for analysis of our results as reported under GAAP. Adjusted Income from Operations is a key measure used by our management and board of directors to understand and evaluate our operating performance and trends by removing the impact of non-operational factors.
30
Table of Contents
The following table reconciles income from operations and Adjusted Income from Operations for each of the periods indicated:
| Predecessor | Successor | Combined | Successor | |||||||||||||||||||||||||||||
| Fiscal Year 2020 |
Predecessor 2021 Period |
Successor 2021 Period |
Unaudited Pro Forma Combined 2021 Period |
Fiscal Year 2022 |
Fiscal Year 2023 |
Unaudited 2023 Interim Period |
Unaudited 2024 Interim Period |
|||||||||||||||||||||||||
| (Amounts in thousands) | Year Ended January 2, 2021 |
Period from January 3, 2021 to July 2, 2021 |
Period from July 3, 2021 to January 1, 2022 |
Fiscal Year Ended January 1, 2022 |
Year Ended December 31, 2022 |
Year Ended December 30, 2023 |
Twenty-six Weeks Ended July 1, 2023 |
Twenty-six Weeks Ended June 29, 2024 |
||||||||||||||||||||||||
| Income from operations |
$ | 890,322 | $ | 525,500 | $ | 323,760 | $ | 788,948 | $ | 3,248,930 | $ | 944,347 | $ | 401,010 | $ | 351,249 | ||||||||||||||||
| Amortization of intangibles |
62,807 | 31,799 | 50,462 | 100,924 | 91,039 | 87,003 | 43,523 | 43,494 | ||||||||||||||||||||||||
| Restructuring costs |
1,186 | 202 | 831 | 1,033 | 10,138 | 18,797 | (171 | ) | 22,525 | |||||||||||||||||||||||
| Integration and transition costs (a) |
18,660 | (7,817 | ) | 226,353 | 218,536 | (2,212,975 | ) | 28,414 | 8,387 | 10,707 | ||||||||||||||||||||||
| Advisory fee |
| | 12,500 | 25,000 | 25,000 | 25,000 | 12,500 | 12,500 | ||||||||||||||||||||||||
|
|
|
|
|
|
|
|
|
|
|
|
|
|
|
|
|
|||||||||||||||||
| Adjusted Income from Operations |
$ | 972,975 | $ | 549,684 | $ | 613,906 | $ | 1,134,441 | $ | 1,162,132 | $ | 1,103,561 | $ | 465,249 | $ | 440,475 | ||||||||||||||||
|
|
|
|
|
|
|
|
|
|
|
|
|
|
|
|
|
|||||||||||||||||
| Net sales |
49,120,453 | 26,406,869 | 28,048,703 | 54,455,572 | 50,824,490 | 48,040,364 | 23,095,490 | 22,876,373 | ||||||||||||||||||||||||
|
|
|
|
|
|
|
|
|
|
|
|
|
|
|
|
|
|||||||||||||||||
| Income from operations margin |
1.81 | % | 1.99 | % | 1.15 | % | 1.45 | % | 6.39 | % | 1.97 | % | 1.74 | % | 1.54 | % | ||||||||||||||||
|
|
|
|
|
|
|
|
|
|
|
|
|
|
|
|
|
|||||||||||||||||
| Adjusted Income from Operations Margin |
1.98 | % | 2.08 | % | 2.19 | % | 2.08 | % | 2.29 | % | 2.30 | % | 2.01 | % | 1.93 | % | ||||||||||||||||
| (a) | Includes the gain on CLS Sale. |
| (2) | Adjusted Return on Invested Capital: |
| Adjusted Return on Invested Capital is defined as Adjusted Net Income divided by the invested capital for the period. Adjusted Net Income for a particular period is defined as net income plus (i) other income/expense, (ii) amortization of intangibles, (iii) restructuring costs incurred primarily related to employee termination benefits in connection with actions to align our cost structure in certain markets, (iv) integration and transition costs, (v) the advisory fee paid to Platinum Advisors under the Advisory Agreement (which will be terminated upon the consummation of this offering), plus (vi) the GAAP tax provisions for and/or valuation allowances on items (i), (ii), (iii), (iv) and (v) plus (vii) the GAAP tax provisions for and/or valuation allowances on large non-recurring or discrete items. Invested capital is equity plus debt less cash and cash equivalents at the end of each period. Adjusted Return on Invested Capital provides a measure of the efficiency with which the Company invests its capital in the business. Adjusted Return on Invested Capital incorporates elements of both profit generation and the capital invested in the business and provides a meaningful gauge of the level of overall value generation when compared to the weighted average cost of capital. This methodology provides a clearer picture to investors of the ongoing business irrespective of temporary volatility that may result from non-recurring business activities including tax impacts thereon. See Managements Discussion and Analysis of Financial Condition and Results of OperationsNon-GAAP Financial Measures. |
31
Table of Contents
To provide investors with additional information regarding our financial results, we have disclosed in the table below and elsewhere in this prospectus Return on Invested Capital.
| Predecessor | Successor | |||||||||||||||||||||||||||
| Fiscal Year 2020 |
Predecessor 2021 Period |
Successor 2021 Period |
Fiscal Year 2022 |
Fiscal Year 2023 |
Unaudited 2023 Interim Period |
Unaudited 2024 Interim Period |
||||||||||||||||||||||
| (Amounts in thousands) | Year Ended January 2, 2021 |
Period from January 3, 2021 through July 2, 2021 |
Period from July 3, 2021 through January 1, 2022 |
Year Ended December 31, 2022 |
Year Ended December 30, 2023 |
Twenty-six Weeks Ended July 1, 2023 |
Twenty-six Weeks Ended June 29, 2024 |
|||||||||||||||||||||
| Net income |
$ | 640,471 | $ | 378,475 | $ | 96,734 | $ | 2,394,489 | $ | 352,712 | $ | 129,405 | $ | 104,137 | ||||||||||||||
| Stockholders equity |
5,011,688 | 5,161,145 | 2,693,429 | 3,058,068 | 3,506,289 | 3,251,367 | 3,463,705 | |||||||||||||||||||||
| Long-term debt |
931,579 | 7,687 | 4,640,888 | 4,174,027 | 3,657,889 | 3,673,590 | 3,423,377 | |||||||||||||||||||||
| Short-term debt and current maturities of long-term debt |
79,032 | 149,234 | 179,332 | 200,327 | 265,719 | 216,423 | 206,153 | |||||||||||||||||||||
| Cash and cash equivalents (1) |
(1,409,893 | ) | (1,553,079 | ) | (1,251,608 | ) | (1,320,137 | ) | (948,490 | ) | (1,132,792 | ) | (928,762 | ) | ||||||||||||||
|
|
|
|
|
|
|
|
|
|
|
|
|
|
|
|||||||||||||||
| Invested capital |
4,612,406 | 3,764,987 | 6,262,041 | 6,112,285 | 6,481,407 | 6,008,588 | 6,164,473 | |||||||||||||||||||||
|
|
|
|
|
|
|
|
|
|
|
|
|
|
|
|||||||||||||||
| Return on invested capital (2) (3) |
13.9 | % | 20.1 | % | 3.1 | % | 39.2 | % | 5.4 | % | 4.3 | % | 3.4 | % | ||||||||||||||
|
|
|
|
|
|
|
|
|
|
|
|
|
|
|
|||||||||||||||
| Period in weeks for non-52 week periods |
52 | 26 | 26 | 52 | 52 | 26 | 26 | |||||||||||||||||||||
| Number of weeks |
52 | 52 | 52 | 52 | 52 | 52 | 52 | |||||||||||||||||||||
| (1) | Cash and cash equivalents for the Successor 2021 Period includes $23,729 of cash held for sale. |
| (2) | Return on Invested Capital is defined as net income divided by the invested capital for the period. Invested capital is equal to stockholders equity plus long-term debt plus short-term debt and the current maturities of long-term debt less cash and cash equivalents at the end of each period. |
| (3) | Calculation for Fiscal Year 2022 (Successor) includes a gain of $2,283,820 as a result of the CLS Sale. |
32
Table of Contents
The following table reconciles net income to Adjusted Return on Invested Capital for each of the periods indicated:
| Predecessor | Successor | |||||||||||||||||||||||||||
| Fiscal Year 2020 |
Predecessor 2021 Period |
Successor 2021 Period |
Fiscal Year 2022 |
Fiscal Year 2023 |
Unaudited 2023 Interim Period |
Unaudited 2024 Interim Period |
||||||||||||||||||||||
| (Amounts in thousands) | Year Ended January 2, 2021 |
Period from January 3, 2021 through July 2, 2021 |
Period from July 3, 2021 through January 1, 2022 |
Year Ended December 31, 2022 |
Year Ended December 30, 2023 |
Twenty-six Weeks Ended July 1, 2023 |
Twenty-six Weeks Ended June 29, 2024 |
|||||||||||||||||||||
| Net income |
$ | 640,471 | $ | 378,475 | $ | 96,734 | $ | 2,394,489 | $ | 352,712 | $ | 129,405 | $ | 104,137 | ||||||||||||||
| Pre-tax adjustments: |
||||||||||||||||||||||||||||
| Other (income) expense |
52,656 | 20,546 | 207,003 | 434,389 | 421,846 | 211,649 | 191,405 | |||||||||||||||||||||
| Amortization of intangibles |
62,807 | 31,799 | 50,462 | 91,039 | 87,003 | 43,523 | 43,494 | |||||||||||||||||||||
| Restructuring costs |
1,186 | 202 | 831 | 10,138 | 18,797 | (171 | ) | 22,525 | ||||||||||||||||||||
| Integration and transition costs |
18,660 | (7,817 | ) | 226,353 | 70,845 | 28,414 | 8,387 | 10,707 | ||||||||||||||||||||
| Advisory fee |
| | 12,500 | 25,000 | 25,000 | 12,500 | 12,500 | |||||||||||||||||||||
| Gain on CLS Sale |
| | | (2,283,820 | ) | | | | ||||||||||||||||||||
| Tax adjustments: |
||||||||||||||||||||||||||||
| Tax impact of pre-tax adjustments excluding gain on CLS Sale (a) |
(49,858 | ) | (10,123 | ) | (63,373 | ) | (125,486 | ) | (124,331 | ) | (60,837 | ) | (62,056 | ) | ||||||||||||||
| Tax impact of Luxembourg valuation allowance reversal (b) |
| | (63,519 | ) | | | | | ||||||||||||||||||||
| Tax impact of gain on CLS Sale (c) |
| | (11,115 | ) | 246,450 | | | | ||||||||||||||||||||
| Other discrete items (d) |
(5,920 | ) | (6,316 | ) | (1,585 | ) | (3,067 | ) | (3,841 | ) | (172 | ) | (1,166 | ) | ||||||||||||||
|
|
|
|
|
|
|
|
|
|
|
|
|
|
|
|||||||||||||||
| Adjusted Net Income |
$ | 720,002 | $ | 406,766 | $ | 454,291 | $ | 859,977 | $ | 805,600 | $ | 344,284 | $ | 321,546 | ||||||||||||||
| Stockholders equity |
5,011,688 | 5,161,145 | 2,693,429 | 3,058,068 | 3,506,289 | 3,251,367 | 3,463,705 | |||||||||||||||||||||
| Long-term debt |
931,579 | 7,687 | 4,640,888 | 4,174,027 | 3,657,889 | 3,673,590 | 3,423,377 | |||||||||||||||||||||
| Short-term debt and current maturities of long-term debt |
79,032 | 149,234 | 179,332 | 200,327 | 265,719 | 216,423 | 206,153 | |||||||||||||||||||||
| Cash and cash equivalents (e) |
(1,409,893 | ) | (1,553,079 | ) | (1,251,608 | ) | (1,320,137 | ) | (948,490 | ) | (1,132,792 | ) | (928,762 | ) | ||||||||||||||
|
|
|
|
|
|
|
|
|
|
|
|
|
|
|
|||||||||||||||
| Invested capital |
4,612,406 | 3,764,987 | 6,262,041 | 6,112,285 | 6,481,407 | 6,008,588 | 6,164,473 | |||||||||||||||||||||
| Number of Days |
364 | 181 | 183 | 364 | 364 | 182 | 182 | |||||||||||||||||||||
|
|
|
|
|
|
|
|
|
|
|
|
|
|
|
|||||||||||||||
| Adjusted Return on Invested Capital |
15.6 | % | 21.7 | % | 14.4 | % | 14.1 | % | 12.4 | % | 11.5 | % | 10.4 | % | ||||||||||||||
|
|
|
|
|
|
|
|
|
|
|
|
|
|
|
|||||||||||||||
| (a) | Tax impact of pre-tax adjustments (excluding tax on the gain on CLS Sale, which is presented separately in item (c) below) reflects the current and deferred income taxes associated with the above pre-tax adjustments in arriving at Adjusted Net Income. |
| (b) | In the Successor 2021 Period, we concluded that NOLs related to our Luxembourg treasury operations, would be more likely than not realizable, which resulted in a valuation allowance release that generated a non-cash income tax benefit of $63,519. We excluded the material change in our valuation allowance to provide a more meaningful evaluation of current income from operations. |
| (c) | In the Successor 2021 Period, we excluded certain tax adjustments included within our provision for income taxes under GAAP for temporary and permanent differences in stock basis and pre-transaction intercompany sales related to the CLS Sale to provide a more meaningful evaluation of our operating performance. In Fiscal Year 2022 (Successor), we recorded $246,450 tax expense related to the gain on CLS Sale. |
| (d) | Other discrete items represent non-recurring adjustments resulting from valuation allowance adjustments of ($2,369), ($11,478), $4,257 and ($2,608) in Fiscal Year 2020 (Predecessor), the Predecessor 2021 Period, Fiscal Year 2022 (Successor) and Fiscal Year 2023 (Successor); adjustments of uncertain tax liabilities of |
33
Table of Contents
| ($2,937), $1,484, ($2,759), ($5,710) and ($2,299) in Fiscal Year 2020 (Predecessor), the Predecessor 2021 Period, Successor 2021 Period, Fiscal Year 2022 (Successor) and the Unaudited 2024 Interim Period (Successor); and other minor non-recurring items. |
| (e) | Cash and cash equivalents for the Successor 2021 Period includes $23,729 of cash held for sale. |
| (3) | EBITDA and Adjusted EBITDA: |
To provide investors with additional information regarding our financial results, we have disclosed in the table above and elsewhere in this prospectus EBITDA and Adjusted EBITDA, each a non-GAAP financial measure. EBITDA is calculated as net income before net interest expense, income taxes, depreciation and amortization expenses. We define Adjusted EBITDA as EBITDA adjusted to give effect to (i) restructuring costs incurred primarily related to employee termination benefits in connection with actions to align our cost structure in certain markets, (ii) net realized and unrealized foreign currency exchange gains and losses including net gains and losses on derivative instruments not receiving hedge accounting treatment, (iii) costs of integration, transition, and operational improvement initiatives primarily related to professional, consulting, integration and implementation costs associated with the Imola Mergers, as well as consulting, retention and transition costs associated with our organizational effectiveness programs charged to selling, general and administrative expenses, (iv) annual advisory fee paid to Platinum Advisors under the Advisory Agreement (which will be terminated upon the consummation of this offering), (v) cash-based compensation expense associated with our cash-based long-term incentive program for certain employees in lieu of equity-based compensation, and which we expect to revert back to an equity-based program in the future under the 2024 Plan, see Executive CompensationCompensation Discussion and Analysis and (vi) certain other items as defined in our Credit Agreements.
We regularly monitor EBITDA and Adjusted EBITDA internally to conduct and measure our business and evaluate the performance of our consolidated operations. Management believes that in addition to our results determined in accordance with GAAP, EBITDA and Adjusted EBITDA are useful in evaluating our business and the underlying trends that are affecting our performance because they are key measures used by our management, Platinum and board of directors to evaluate our operating performance, generate future operating plans and make strategic decisions regarding the allocation of capital. In particular, the exclusion of certain expenses in calculating EBITDA and Adjusted EBITDA facilitate operating performance comparisons on a period-to-period basis and excludes items that we do not consider to be indicative of our core operating performance. See Managements Discussion and Analysis of Financial Condition and Results of OperationsNon-GAAP Financial Measures.
EBITDA and Adjusted EBITDA are non-GAAP financial measures and are not intended to replace financial performance measures determined in accordance with GAAP, such as income from operations and net income. Rather, we present EBITDA and Adjusted EBITDA as supplemental measures of our performance. As non-GAAP financial measures, our computation of EBITDA and Adjusted EBITDA may vary from similarly termed non-GAAP financial measures used by other companies, making comparisons with other companies on the basis of these measures impracticable.
EBITDA and Adjusted EBITDA are used to facilitate a comparison of the ordinary, ongoing and customary course of our operations on a consistent basis from period to period and provides an additional understanding of factors and trends affecting our business. Such measures do not necessarily indicate whether cash flow will be sufficient or available to meet our cash requirements and may not be indicative of our historical operating results, nor are such measures meant to be predictive of our future results. EBITDA and Adjusted EBITDA have limitations as an analytical tool, and you should not consider them in isolation or as a substitute for analysis of our results as reported under GAAP. Some of these limitations are:
| | they do not reflect our cash expenditures or future requirements for capital expenditures or contractual commitments; |
| | they do not reflect changes in, or cash requirements for, our working capital needs; |
34
Table of Contents
| | they do not reflect the significant interest expense, or the cash requirements necessary, to service interest or principal payments on our debts; |
| | although depreciation and amortization are non-cash charges, the assets being depreciated and amortized will often need to be replaced in the future and EBITDA and Adjusted EBITDA do not reflect any cash requirements that would be required for such replacements; and |
| | some of the exceptional items that we eliminate in calculating EBITDA and Adjusted EBITDA reflect cash payments that were made, or will in the future be made. |
The following table reconciles net income to EBITDA and Adjusted EBITDA for each of the periods indicated:
| Predecessor | Successor | Combined | Successor | |||||||||||||||||||||||||||||
| Fiscal Year 2020 |
Predecessor 2021 Period |
Successor 2021 Period |
Unaudited Pro Forma Combined 2021 Period |
Fiscal Year 2022 |
Fiscal Year 2023 |
Unaudited 2023 Interim Period |
Unaudited 2024 Interim Period |
|||||||||||||||||||||||||
| (Amounts in thousands) | Year Ended January 2, 2021 |
Period from January 3, 2021 to July 2, 2021 |
Period from July 3, 2021 to January 1, 2022 |
Fiscal Year Ended January 1, 2022 |
Year Ended December 31, 2022 |
Year Ended December 30, 2023 |
Twenty-six Weeks Ended July 1, 2023 |
Twenty-six Weeks Ended June 29, 2024 |
||||||||||||||||||||||||
| Net income |
$ | 640,471 | $ | 378,475 | $ | 96,734 | $ | 366,110 | $ | 2,394,489 | $ | 352,712 | $ | 129,405 | $ | 104,137 | ||||||||||||||||
| Interest income |
(22,773 | ) | (11,744 | ) | (6,306 | ) | (18,050 | ) | (22,911 | ) | (34,977 | ) | (16,381 | ) | (20,365 | ) | ||||||||||||||||
| Interest expense |
86,693 | 44,281 | 183,208 | 312,642 | 320,230 | 380,191 | 186,430 | 171,536 | ||||||||||||||||||||||||
| Provision for income taxes |
197,195 | 126,479 | 20,023 | 110,136 | 420,052 | 169,789 | 59,956 | 55,707 | ||||||||||||||||||||||||
| Depreciation and amortization |
194,541 | 99,542 | 137,484 | 274,968 | 197,111 | 184,148 | 94,238 | 92,461 | ||||||||||||||||||||||||
|
|
|
|
|
|
|
|
|
|
|
|
|
|
|
|
|
|||||||||||||||||
| EBITDA |
$ | 1,096,127 | $ | 637,033 | $ | 431,143 | $ | 1,045,806 | $ | 3,308,971 | $ | 1,051,863 | $ | 453,648 | $ | 403,476 | ||||||||||||||||
|
|
|
|
|
|
|
|
|
|
|
|
|
|
|
|
|
|||||||||||||||||
| Restructuring costs |
1,186 | 202 | 831 | 1,033 | 10,138 | 18,797 | (171 | ) | 22,525 | |||||||||||||||||||||||
| Net foreign currency exchange (gain) loss |
(9,001 | ) | 1,419 | 17,473 | 18,892 | 69,597 | 42,070 | 29,103 | 19,263 | |||||||||||||||||||||||
| Integration, transition and operational improvement costs (a) |
18,660 | (7,817 | ) | 242,400 | 234,583 | (2,163,975 | ) | 127,261 | 64,024 | 65,523 | ||||||||||||||||||||||
| Advisory fee |
| | 12,500 | 25,000 | 25,000 | 25,000 | 12,500 | 12,500 | ||||||||||||||||||||||||
| Cash-based compensation expense |
50,996 | 27,428 | 28,576 | 56,004 | 35,418 | 31,040 | 19,338 | 12,245 | ||||||||||||||||||||||||
| Other |
11,924 | (10,495 | ) | 13,355 | 2,860 | 64,250 | 57,061 | 25,289 | 33,467 | |||||||||||||||||||||||
|
|
|
|
|
|
|
|
|
|
|
|
|
|
|
|
|
|||||||||||||||||
| Adjusted EBITDA |
$ | 1,169,892 | $ | 647,770 | $ | 746,278 | $ | 1,384,178 | $ | 1,349,399 | $ | 1,353,092 | $ | 603,731 | $ | 568,999 | ||||||||||||||||
|
|
|
|
|
|
|
|
|
|
|
|
|
|
|
|
|
|||||||||||||||||
| (a) | Includes the gain on CLS Sale. |
| (4) | Non-GAAP Net Income: |
We define Non-GAAP Net Income as Net Income adjusted to give effect to (i) amortization of intangibles, (ii) restructuring costs incurred primarily related to employee termination benefits in connection with actions to align our cost structure in certain markets, (iii) net realized and unrealized foreign currency exchange gains and losses including net gains and losses on derivative instruments not receiving hedge accounting treatment, (iv) costs of integration, transition, and operational improvement initiatives primarily related to professional, consulting, integration and implementation costs associated with the Imola Mergers, as well as consulting, retention and transition costs associated with our organizational effectiveness programs charged to selling, general and administrative expenses, (v) annual advisory fee paid to Platinum Advisors under the Advisory Agreement (which will be terminated upon the consummation of this offering), (vi) cash-based compensation expense associated with our cash-based long-term incentive program for certain employees in lieu of equity-based compensation, and which we expect to revert back to an equity-based program in the future under the 2024 Plan, see Executive CompensationCompensation Discussion and Analysis, (vii) certain other items as defined in our Credit Agreements, (viii) the GAAP tax provisions for and/or valuation allowances on items (i), (ii), (iii), (iv), (v), (vi) and
35
Table of Contents
(vii), and (ix) the GAAP tax provisions for and/or valuation allowances on large non-recurring or discrete items. This metric differs from Adjusted Net Income, which is a component of Adjusted ROIC as shown above.
In a manner consistent with EBITDA and Adjusted EBITDA discussed above, we regularly monitor Non-GAAP Net Income internally to conduct and measure our business and evaluate the performance of our consolidated operations. Management believes that in addition to our results determined in accordance with GAAP, Non-GAAP Net Income is useful in evaluating our business and the underlying trends that are affecting our performance because it applies a tax-effected profitability metric that is useful in evaluating our business and the underlying trends that are affecting our performance, and Non-GAAP Net Income is a key measure used by our management, Platinum and our board of directors to evaluate our financial performance, generate future financial plans and make strategic decisions regarding the allocation of capital. Furthermore, the exclusion of certain items in reconciling from Net Income to Non-GAAP Net Income helps to facilitate operating performance comparisons on a period-to-period basis because it excludes certain items that we do not consider to be indicative of our core financial performance.
Non-GAAP Net Income is a non-GAAP financial measure and is not intended to replace financial performance measures determined in accordance with GAAP, such as net income. Rather, we present Non-GAAP Net Income as a supplemental measure of our performance. As a non-GAAP financial measure, our computation of Non-GAAP Net Income may vary from similarly termed non-GAAP financial measures used by other companies, making comparisons with other companies on the basis of the measure impracticable.
The following table reconciles net income to Non-GAAP Net Income for each of the periods indicated:
| Predecessor | Successor | Combined | Successor | |||||||||||||||||||||||||||||
| |
Fiscal Year 2020 |
|
Predecessor 2021 Period |
|
Successor 2021 Period |
|
Unaudited Pro Forma Combined 2021 Period |
|
Fiscal Year 2022 |
|
Fiscal Year 2023 |
|
Unaudited 2023 Interim Period |
|
Unaudited 2024 Interim Period |
|||||||||||||||||
| (Amounts in thousands) | Year Ended January 2, 2021 |
Period from January 3, 2021 to July 2, 2021 |
Period from July 3, 2021 to January 1, 2022 |
Fiscal Year Ended January 1, 2022 |
Year Ended December 31, 2022 |
Year Ended December 30, 2023 |
Twenty-six Weeks Ended July 1, 2023 |
Twenty-six Weeks Ended June 29, 2024 |
||||||||||||||||||||||||
| Net income |
$ | 640,471 | $ | 378,475 | $ | 96,734 | $ | 366,110 | $ | 2,394,489 | $ | 352,712 | $ | 129,405 | $ | 104,137 | ||||||||||||||||
| Pre-tax adjustments: |
||||||||||||||||||||||||||||||||
| Amortization of intangibles |
62,807 | 31,799 | 50,462 | 100,924 | 91,039 | 87,003 | 43,523 | 43,494 | ||||||||||||||||||||||||
| Restructuring costs |
1,186 | 202 | 831 | 1,033 | 10,138 | 18,797 | (171 | ) | 22,525 | |||||||||||||||||||||||
| Net foreign currency exchange (gain) loss |
(9,001 | ) | 1,419 | 17,473 | 18,892 | 69,597 | 42,070 | 29,103 | 19,263 | |||||||||||||||||||||||
| Integration, transition and operational improvement costs (a) |
18,660 | (7,817 | ) | 242,400 | 234,583 | (2,163,975 | ) | 127,261 | 64,024 | 65,523 | ||||||||||||||||||||||
| Advisory fee |
| | 12,500 | 25,000 | 25,000 | 25,000 | 12,500 | 12,500 | ||||||||||||||||||||||||
| Cash-based compensation expense |
50,996 | 27,428 | 28,576 | 56,004 | 35,418 | 31,040 | 19,338 | 12,245 | ||||||||||||||||||||||||
| Other items |
3,392 | (14,874 | ) | 11,016 | (3,858 | ) | 53,634 | 47,629 | 19,576 | 27,830 | ||||||||||||||||||||||
| Tax Adjustments: |
||||||||||||||||||||||||||||||||
| Tax impact of pre-tax adjustments excluding gain on CLS Sale (b) |
(35,294 | ) | (9,804 | ) | (58,772 | ) | (78,718 | ) | (88,772 | ) | (95,539 | ) | (48,881 | ) | (50,724 | ) | ||||||||||||||||
| Tax impact of Luxembourg valuation allowance reversal (c) |
| | (63,519 | ) | (63,519 | ) | | | | | ||||||||||||||||||||||
| Tax impact of gain on CLS |
| | (11,115 | ) | (11,115 | ) |
|
246,450 |
|
| | | ||||||||||||||||||||
| Other miscellaneous tax adjustments (e) |
(5,920 | ) | (6,316 | ) | (4,585 | ) | (10,901 | ) | 5,728 | 2,145 | 188 | (1,166 | ) | |||||||||||||||||||
|
|
|
|
|
|
|
|
|
|
|
|
|
|
|
|
|
|||||||||||||||||
| Non-GAAP Net Income |
$ | 727,297 | $ | 400,512 | $ | 322,001 | $ | 634,435 | $ | 678,746 | $ | 638,118 | $ | 268,605 | $ | 255,627 | ||||||||||||||||
|
|
|
|
|
|
|
|
|
|
|
|
|
|
|
|
|
|||||||||||||||||
| (a) | Includes the gain on CLS Sale. |
| (b) | Tax impact of pre-tax adjustments (excluding tax on the gain on CLS Sale, which is presented separately in item (d) below) reflects the current and deferred income taxes associated with the above pre-tax adjustments in arriving at Non-GAAP Net Income. |
36
Table of Contents
| (c) | In the Successor 2021 Period and the Unaudited Pro Forma Combined 2021 Period, we concluded that NOLs related to our Luxembourg treasury operations, would be more likely than not realizable, which resulted in a valuation allowance release that generated a non-cash income tax benefit of $63,519. We excluded the material change in our valuation allowance to provide a more meaningful evaluation of Non-GAAP Net Income. |
| (d) | In the Successor 2021 Period and the Unaudited Pro Forma Combined 2021 Period, we excluded certain tax adjustments included within our provision for income taxes under GAAP for temporary and permanent differences in stock basis and pre-transaction intercompany sales related to the CLS Sale to provide a more meaningful evaluation of our Non-GAAP Net Income. In Fiscal Year 2022 (Successor), we recorded $246,450 tax expense related to the gain on CLS sale. |
| (e) | Other miscellaneous tax adjustments represent non-recurring adjustments resulting from valuation allowance adjustments of ($2,369), ($11,478), ($11,478), $4,257, and ($2,608) in Fiscal Year 2020 (Predecessor), the Predecessor 2021 Period, Unaudited Pro Forma Combined 2021 Period, Fiscal Year 2022 (Successor) and Fiscal Year 2023 (Successor); adjustments of uncertain tax liabilities of $(2,937), $1,484, ($2,759), ($1,275), ($5,710) and ($2,299) in Fiscal Year 2020 (Predecessor), the Predecessor 2021 Period, the Successor 2021 Period, Unaudited Pro Forma Combined 2021 Period, Fiscal Year 2022 (Successor) and the Unaudited 2024 Interim Period (Successor); $8,795 of withholding tax expense due to a dividend from our Canadian subsidiary in Fiscal Year 2022 (Successor); and other minor non-recurring items. |
| (5) | Adjusted Free Cash Flow: |
We regularly monitor Adjusted Free Cash Flow internally to conduct and measure our business and evaluate the performance of our consolidated operations and the generation of cash to fund financing and investing needs outside of capital expenditures. To provide investors with additional information regarding our financial results, we have disclosed in the table above and elsewhere in this prospectus Adjusted Free Cash Flow, a non-GAAP financial measure. Adjusted Free Cash Flow means net income adjusted to give effect to (i) depreciation and amortization, (ii) other non-cash items and changes to non-working capital assets/liabilities, (iii) changes in working capital, (iv) proceeds from the deferred purchase price of factored receivables and (v) capital expenditures. Adjusted Free Cash Flow has limitations as an analytical tool, and you should not consider it in isolation or as a substitute for analysis of our results as reported under GAAP.
The following table reconciles net income to Adjusted Free Cash Flow for each of the periods indicated:
| Predecessor | Successor | |||||||||||||||||||||||||||
| Fiscal Year 2020 |
Predecessor 2021 Period |
Successor 2021 Period |
Fiscal Year 2022 |
Fiscal Year 2023 |
Unaudited 2023 Interim Period |
Unaudited 2024 Interim Period |
||||||||||||||||||||||
| (Amounts in thousands) | Year Ended January 2, 2021 |
Period from January 3, 2021 to July 2, 2021 |
Period from July 3, 2021 to January 1, 2022 |
Year Ended December 31, 2022 |
Year Ended December 30, 2023 |
Twenty-six Weeks Ended July 1, 2023 |
Twenty-six Weeks Ended June 29, 2024 |
|||||||||||||||||||||
| Net income |
$ | 640,471 | $ | 378,475 | $ | 96,734 | $ | 2,394,489 | $ | 352,712 | $ | 129,405 | $ | 104,137 | ||||||||||||||
| Depreciation and amortization |
194,541 | 99,542 | 137,484 | 197,111 | 184,148 | 94,238 | 92,461 | |||||||||||||||||||||
| Other non-cash items and changes to non-working capital assets/liabilities |
248,401 | (286,637 | ) | 182,343 | (2,512,074 | ) | (177,842 | ) | (216,229 | ) | (167,279 | ) | ||||||||||||||||
| Changes in working capital |
407,759 | (805,444 | ) | (184,798 | ) | (440,635 | ) | (300,194 | ) | 308,358 | 271,599 | |||||||||||||||||
|
|
|
|
|
|
|
|
|
|
|
|
|
|
|
|||||||||||||||
| Cash provided by (used in) operating activities |
1,491,172 | (614,064 | ) | 231,763 | (361,109 | ) | 58,824 | 315,772 | 300,918 | |||||||||||||||||||
| Capital expenditures |
(135,125 | ) | (63,160 | ) | (86,584 | ) | (135,785 | ) | (201,535 | ) | (104,207 | ) | (68,688 | ) | ||||||||||||||
| Proceeds from deferred purchase price of factored receivables |
116,879 | 50,429 | 60,304 | 145,003 | 162,622 | 76,418 | 128,515 | |||||||||||||||||||||
|
|
|
|
|
|
|
|
|
|
|
|
|
|
|
|||||||||||||||
| Adjusted Free Cash Flow |
$ | 1,472,926 | $ | (626,795 | ) | $ | 205,483 | $ | (351,891 | ) | $ | 19,911 | $ | 287,983 | $ | 360,745 | ||||||||||||
|
|
|
|
|
|
|
|
|
|
|
|
|
|
|
|||||||||||||||
37
Table of Contents
An investment in our Common Stock involves risk. You should carefully consider the following risks described below, as well as the other information included in this prospectus, including Managements Discussion and Analysis of Financial Condition and Results of Operations, and the consolidated financial statements and related notes, before investing in our Common Stock. Any of the following risks could materially and adversely affect our business, results of operations, financial condition, cash flows or growth prospects. The selected risks described below, however, are not the only risks facing us. Additional risks and uncertainties not currently known to us or those we currently view to be immaterial may also materially and adversely affect our business, results of operations, financial condition or growth prospects. In such a case, the trading price of our Common Stock could decline, and you may lose all or part of your investment.
This prospectus also contains forward-looking statements that involve risks and uncertainties. See Cautionary Note Regarding Forward-Looking Statements. The Companys actual results could differ materially and adversely from those anticipated in these forward-looking statements as a result of certain factors.
Risks Related to Our Business and Our Industry
Our quarterly results have fluctuated significantly.
Our quarterly operating results have fluctuated significantly in the past and will likely continue to do so in the future as a result of:
| | general changes in economic or geopolitical conditions, including changes in legislation or regulatory environments in which we operate and changes in import and export regulations, tariffs or taxes and duties; |
| | competitive conditions in our industry, which may impact the prices charged and terms and conditions imposed by our vendors and/or competitors and the prices we charge our customers, which in turn may negatively impact our revenues and/or gross margins; |
| | variations in purchase discounts and rebates from vendors based on various factors, including changes to sales or purchase volume, changes to objectives set by the vendors and changes in timing of receipt of discounts and rebates; |
| | seasonal variations in the demand for our products and services, which historically have included lower demand in Europe during the summer months, worldwide pre-holiday stocking in the retail and e-tail channels during the September-to-December period and the seasonal increase in demand for our fulfillment services in the fourth quarter, which affects our operating expenses and gross margins; |
| | changes in businesses and consumers purchasing behaviors, including the rates at which they replace or upgrade technology solutions, and the impacts that fluctuating demand across different product categories, which also carry varying profitability and working capital profiles, can have on our overall results; |
| | changes in product mix, including entry or expansion into new markets, new product offerings and the exit or retraction of certain business; |
| | the impact of and possible disruption caused by integration and reorganization of our businesses and efforts to improve our IT capabilities, as well as the related expenses and/or charges; |
| | currency fluctuations in countries in which we operate; |
| | variations in our levels of excess inventory and doubtful accounts, and changes in the terms of vendor-sponsored programs such as price protection and return rights; |
38
Table of Contents
| | changes in the level of our operating expenses; |
| | the impact of acquisitions and divestitures; |
| | variations in the mix of profits between multiple tax jurisdictions, including losses in certain tax jurisdictions in which we are not able to record a tax benefit, as well as changes in assessments of uncertain tax positions or changes in the valuation allowances on our deferred tax assets, which could affect our provision for taxes and effective tax rate; |
| | the occurrence of unexpected events or the resolution of existing uncertainties, including, but not limited to, litigation or regulatory matters; |
| | the loss or consolidation of one or more of our major vendors or customers; |
| | product supply constraints; and |
| | inflation, interest rate fluctuations and/or credit market volatility, which may increase our borrowing costs and may influence the willingness or ability of customers and end users to purchase products and services. |
These historical variations in our business may not be indicative of future trends in the near term. We believe that investors should not rely on period-to-period comparisons of our operating results as an indication of future performance. In addition, the results of any quarterly period are not indicative of results to be expected for a full fiscal year.
We have invested, and will continue to invest, significant resources in the development and deployment of Ingram Micro Xvantage, and if Ingram Micro Xvantage is not successful, our business, results of operations, financial condition and cash flows could be adversely impacted.
We have made, and expect to continue to make, substantial investments to develop a transformative digital platform to provide a singular experience for our customers to consume technology and accelerate the benefits innovative technology brings to our customers. However, we may not be able to continue to successfully develop or effectively implement Ingram Micro Xvantage in a timely, cost-effective, compliant and responsible manner. Any difficulties in implementing or integrating Ingram Micro Xvantage, or failures in including appropriate cybersecurity and data privacy protections within the platform, could have an adverse effect on our business, results of operations, financial condition and cash flows.
Further, if our competitors develop and introduce similar services in the future, our future success will depend, in part, on our ability to develop and provide competitive technologies, and we may not be able to do so timely, effectively or at all. As AI and other technologies improve in the future, we may be required to make significant capital expenditures to remain competitive, which may have an adverse effect on our results of operations, and our failure to do so in a timely, cost-effective, compliant and responsible manner may adversely impact our growth, revenue and profit. There is also no guarantee that such investment in Ingram Micro Xvantage, AI or future technologies will create additional efficiencies in our operations.
Our acquisition and investment strategies may not produce the expected benefits, which may adversely affect our results of operations.
We have made, and expect to continue to make, acquisitions or investments in companies around the world to further our strategic objectives and support key business initiatives. Acquisitions and investments involve risks and uncertainties, some of which may differ from those historically associated with our operations. In 2019, we completed the acquisition of Abbakan, a cybersecurity value-add distributor in France. In 2020, we completed the acquisition of Ictivity B.V., a Netherlands-based company that offers consulting, implementation and managed services, and Harmony PSA Holding Limited, a company based in the United Kingdom, specializing in professional services automation. In 2021, we completed the acquisitions of Canal Digital, S.A., an IT distributor
39
Table of Contents
in Colombia, BR Link, a managed services provider in Brazil, and Keenondots, a platform-as-a-service business in the Netherlands. In each case, we made these acquisitions to enhance our existing portfolio of products and services. In 2021, we were also indirectly acquired by Platinum. The Imola Mergers are expected to result in cost savings, operating synergies and other benefits, which may not be realized fully, if at all. Significant risks and uncertainties related to our acquisition and investment strategies that could materially and adversely affect our financial performance include the following:
| | acquisitions that do not strategically align with our goals and growth initiatives; |
| | valuation methodologies that result in overpayment for an asset; |
| | failure to identify risks during due diligence processes or to accurately quantify the probability, severity and potential impact of the risks on our business; |
| | exposure to new regulations, such as those relating to U.S. federal government procurement regulations, those in new geographies or those applicable to new products or services; |
| | inability to successfully integrate the acquired businesses, which may be more difficult, costly or time-consuming than anticipated, including inability to retain key management associates and other personnel who could be critical to the acquisition strategy, current business operations and growth potential of the acquired operations; difficulties realizing revenue and cost savings synergies, which could hamper the growth and profitability of the core business operations and lead to distraction of management; difficulties with integrating different business systems and technology platforms and consolidating corporate, administrative, technological and operational infrastructures; |
| | distraction of managements attention away from existing business operations while coordinating and integrating new and sometimes geographically dispersed organizations; |
| | insufficient profit generation to offset liabilities assumed and expenses associated with the investment strategy; |
| | inability to preserve our and the acquired companys customer, supplier and other important relationships; |
| | inability to successfully protect and defend acquired intellectual property rights; |
| | inability to adapt to challenges of new markets, including geographies, products and services, or to identify new profitable business opportunities from expansion of existing products or services; |
| | inability to adequately bridge possible differences in cultures, business practices and management philosophies; |
| | inability to successfully operate in a new line of business; |
| | substantial increases in our debt; and |
| | issues not discovered in our due diligence process. |
In addition, we may divest business units that do not meet our strategic, financial and/or risk tolerance objectives. No assurance can be given that we will be able to dispose of business units on favorable terms or without significant costs.
In connection with the primary closing and deferred closing of the CLS Sale, we are providing transition services which may draw attention and resources away from our ongoing business.
On December 6, 2021, we entered into a purchase agreement with respect to the CLS Sale. The transaction contemplated a primary closing date with respect to the vast majority of the operations that were the subject of the CLS Sale and successive deferred closings in respect of other operations. The primary closing of the transaction occurred on April 4, 2022 and the deferred closings were completed between the primary closing date of April 4, 2022 and November 16, 2022.
40
Table of Contents
Following the primary closing of the CLS Sale, we entered into the TSA with the buyer, whereby we are providing certain services, including logistical, IT and certain corporate services. The services provided under the TSA will terminate at various times but those services that are not fully transitioned by the applicable specified time may be generally extended under certain circumstances to no later than 24 months from April 4, 2022, the primary closing date of the CLS Sale, unless otherwise extended by mutual agreement. The majority of the human resources services that the Company was obligated to provide under the TSA were fully transitioned and completed at the end of December 2022. In addition, the majority of the operations and IT services were transitioned during 2023, and management expects the remaining services to be fully transitioned and completed by the end of 2024. In the course of performing our obligations under the TSA, we will continue to allocate resources, including assets, facilities and equipment, for the benefit of the separated business in the CLS Sale, and we will continue to require time and attention of our management and other associates, potentially diverting their attention from other aspects of our business. We are bound to comply with the terms of the TSA, and at times, such compliance could disrupt our operations.
We have been, and may continue to be, affected by the COVID-19 pandemic or other public health issues, and such effects could have an adverse effect on our business operations, results of operations, cash flows and financial condition.
We experienced disruptions to our business from the COVID-19 pandemic, and the potential for future disruptions related to COVID-19 or other public health issues is unpredictable. Due to lockdowns, our operations in certain countries, including China, Peru, Malaysia, Lebanon, Germany, the United Kingdom, Colombia, India and Dubai, were closed for periods of time with limited or no ability to operate. Specifically, the lockdown in India halted our operations for approximately two months in 2020. In addition, our operations and business in China were negatively impacted by the widespread lockdowns in 2022. In part as a result of the COVID-19 pandemic, we also encountered industry-wide supply chain challenges, including shipping and logistics challenges and significant limits on component supplies, which have adversely impacted (primarily in 2021 and 2022), and may continue to impact, our ability to meet demand, resulting in additional costs or otherwise adversely impacting our business, financial condition and results of operations. Additionally, in many countries in which we operate, a number of our associates have been infected with COVID-19, which has, at times, limited our available workforce. In the United States, the cost of labor and attrition increased in 2021 and 2022, making the labor market increasingly competitive. While many of these impacts of the COVID-19 pandemic had eased considerably by 2023, in the future we may again experience restrictions on high-volume shipping, supply chain volatility and product constraints, an increasingly competitive temporary labor workforce market and negative impact on the health and safety of our workforce, which could materially and adversely affect our business, results of operations, financial condition and cash flows.
Our management has taken measures, when appropriate, both voluntarily and as a result of government directives and guidance, to mitigate the effects of the COVID-19 pandemic on us and others. These measures have included, among others, the ability of certain associates to work remotely, which has placed a burden on our IT systems, created declines in productivity, and exposed us to increased vulnerability to cyberattack and other cyber disruption, impacts which we may not be able to fully mitigate. Because certain of our associates transitioned to working remotely on a mandatory or voluntary basis for a prolonged period of time, our return-to-office plans have, in some cases, led to associate attrition. Pandemic-related and post-pandemic-related changes in workforce patterns have resulted, and may continue to result, in additional attrition, difficulty in hiring and reduced productivity. See Failure to retain and recruit key personnel would harm our ability to meet key objectives. Many of these measures resulted in, and may in the future result in, incremental costs to us, and such costs may not be recoverable or adequately covered by our insurance.
The full extent to which the COVID-19 pandemic impacts us depends on numerous evolving factors and future developments that we are not able to predict at this time, including: impact of variants of the COVID-19 virus; effectiveness of vaccinations and medical advancements to treat or stop the infections caused by the virus; or governmental, business and other actions (which could include limitations on our operations to provide
41
Table of Contents
products or services or require us to operate in a certain manner). In addition, we cannot fully predict the impact that COVID-19 and other public health issues will have on our customers, associates, vendors, suppliers, end users, strategic partners and other business partners and each of their financial conditions; however, any material effect on these parties could materially and adversely impact us. The impact of COVID-19 and other public health issues may also include possible impairment or other charges and may exacerbate other risks described below, any of which could have a material effect on us.
We are a holding company with no direct operations. Our sole material asset after completion of this offering is our indirect equity interest in Ingram Micro Inc. and, as such, we will depend on our subsidiaries for cash to fund all of our expenses.
We are a holding company with no direct operations, and, following the completion of this offering, will have no material assets other than our indirect ownership of the stock of Ingram Micro Inc. and the direct and indirect ownership of its subsidiaries, which are the key operating subsidiaries. Our ability to pay cash dividends and our ability to generate the funds necessary to meet our outstanding debt service and other obligations will depend on the payment of distributions by our current and future subsidiaries, including, without limitation, Ingram Micro Inc., and such distributions may be restricted by law, taxes or repatriation or the instruments governing our indebtedness, including the Indenture, the Credit Agreements or other agreements of our subsidiaries. Our subsidiaries may not generate sufficient cash from operations to enable us to make principal and interest payments on our indebtedness.
Failure to retain and recruit key personnel would harm our ability to meet key objectives.
Because of the complex and diverse nature of our business, which includes a high volume of transactions, business complexity, wide geographical coverage and a broad scope of products, vendors, suppliers and customers, we are highly dependent on our ability to retain the services of our key management, sales, IT, operations and finance personnel. Our continued success is also dependent upon our ability to retain and recruit other qualified associates, including highly skilled technical, managerial and marketing personnel and to provide growth and development opportunities and reward incentives that drive above-market performance. Competition for qualified personnel is intense and the costs of qualified talent are increasing. We may not be successful in attracting and retaining the personnel we require, which could have a material adverse effect on our business. In addition, our entry into new markets requires us to hire qualified personnel with new capabilities, and our increasing global footprint requires us to recruit talent in new geographies. We constantly review market conditions and other factors; however, we may fail to make staffing adjustments based on current and forecasted conditions. While these adjustments are generally small, there are occasions where we have reduced headcount in various geographies and functions through restructuring and outsourcing activities. For example, we initiated a workforce restructuring plan in July 2023, which resulted in a headcount reduction primarily in our North American operations. In the first quarter of 2024, we took further actions under this plan, resulting in organizational and staffing changes and a headcount reduction of 503 employees. This restructuring plan, and any similar actions taken in the future, could negatively impact our relationships with vendors and customers, the morale of our workforce and our ability to attract, retain and motivate associates. In addition, failure to meet our performance targets may result in reduced levels of incentive compensation, which could affect our ability to adequately reward key personnel and potentially negatively impact retention. Changes in our workforce, including those resulting from acquisitions, and our failure to leverage shared services, could disrupt our operations or increase our operating cost structure. Government regulations, collective bargaining agreements and the unavailability of qualified personnel could also negatively impact operations and our costs.
In addition, we believe that our corporate culture is a critical component of our success. Remote work resulting from the COVID-19 pandemic has required us to make substantial changes to the way that many of our associates work. Remote work and geographically dispersed teams could negatively impact associate morale, the cohesiveness of and collaboration among our teams, as well as our ability to maintain our culture. Any failure to preserve our culture and maintain associate morale could negatively affect our ability to retain and recruit
42
Table of Contents
personnel. Further, as we have required associates to return to our office sites at least three days per week, we may not be able to retain associates or attract new associates who prefer to work from home on a full-time basis. The failure to attract and retain such personnel could adversely affect our business. Finally, as we continue to evolve various work-from-home policies and other hybrid workforce arrangements, we may not be able to adopt or implement such policies in a timely manner or efficiently adapt to requisite changes once such policies are in place.
Increases in wage and benefit costs, collective bargaining agreements, changes in laws and other labor regulations or labor disruptions could impact our financial condition and cash flows.
Our expenses relating to employee labor, including employee health benefits, are significant. Our ability to control our employee and related labor costs is generally subject to numerous external factors, including prevailing wage rates, availability of labor, recent legislative and private sector initiatives regarding healthcare reform and adoption of new or revised employment and labor laws and regulations; for example, recently, various legislative movements have sought to increase the federal minimum wage in the United States and the minimum wage in a number of individual states, some of which have been successful at the state level. Several employers in the private sector with whom we compete for permanent and seasonal labor have initiated wage increases and provided special benefits and incentives that may go beyond the minimum required by law. As minimum and market wage rates increase, we may need to increase not only the wage rates of our minimum wage associates, but also the wages paid to our other associates as well. A number of factors may adversely affect the labor force available to us, including high employment levels, federal and state unemployment subsidies and other government regulations. In certain markets, such as the United States and Europe, labor shortages remain a challenge. Such shortages have led, and are likely to continue to lead, to higher wages for associates in order for us to provide competitive compensation. Should we fail to increase our wages competitively in response to increasing wage rates or labor shortages, the quality of our workforce could decline, adversely affecting our customer service and our overall business operations. Additionally, any increase in the cost of our labor could have an adverse and material effect on our operating costs, financial condition and results of operations.
In addition, while we do not have unions in the United States, some of our associates are covered by collective bargaining agreements and works council arrangements in a number of the countries in which we operate including Australia, Brazil, Chile, Costa Rica, France, Germany, Mexico, the Netherlands, Poland, Spain, Sweden and the United Kingdom. Future negotiations prior to the expiration of our collective agreements may result in labor unrest for which a strike or work stoppage is possible. Strikes and/or work stoppages could negatively affect our operational and financial results and may increase operating expenses. In addition, any future unionization efforts would require us to incur additional costs related to wages and benefits, inefficiencies in operations, unanticipated costs in sourcing temporary or third-party labor, legal fees and interference with customer relationships. If a significant number of our associates were to become unionized and collective bargaining agreement terms were significantly different from our current arrangements, we may experience a material adverse effect on our business, results of operations, financial condition and cash flows. In addition, a labor dispute involving some of our associates may harm our reputation, disrupt our operations and reduce our revenue, and resolution of disputes may increase our costs.
We are also required to comply with laws and regulations in the countries in which we have associates that may differ substantially from country to country, requiring significant management attention and cost.
As of June 29, 2024, we had approximately 24,150 full-time global associates, with approximately 4,970 full-time associates located in the United States and approximately 19,180 full-time associates located internationally. While we have not experienced any material work stoppages at any of our facilities, any stoppage or slowdown could cause material interruptions in our business, and we cannot assure investors that alternate qualified personnel would be available on a timely basis, or at all.
43
Table of Contents
Our failure to adequately adapt to industry changes could negatively impact our future operating results.
The technology and IT services industry is subject to rapid and disruptive technological change, new and enhanced product specification requirements, evolving industry standards and changes in the way technology products are distributed, managed or consumed. We have been and will continue to be dependent on innovations in hardware, software and services offerings, as well as the acceptance of those innovations by customers and consumers. Our failure to add new products and vendors, a decrease in the rate of innovation, or the lack of acceptance of innovations by customers, could have a material adverse effect on our business, results of operations, financial condition and cash flows. Vendors may also give us limited or no access to new products being introduced.
Changes in technology may cause the value of our inventory on hand to decline substantially or to become obsolete, regardless of the general economic environment. Although it is the policy of many of our vendors to offer limited protection from the loss in value of inventory due to technological change or due to the vendors price reductions (price protections), such policies are often subject to time restrictions and do not protect us in all cases of declines in inventory value. If our major vendors decrease or eliminate our price protection, such a change in policy could lower our gross margins on products we sell or cause us to record inventory write-downs. In addition, vendors could become insolvent and unable to fulfill their protection obligations to us. We offer no assurance that inventory rotation or price protection rights will continue, that unforeseen new product developments will not adversely affect us or that we will successfully manage our existing and future inventories.
Significant changes in vendors terms, such as higher thresholds on sales volume before the application of discounts and/or rebates, the overall reduction in incentives, reduction or termination of price protection, return levels or other inventory management programs, or reductions in trade credit or vendor-supported credit programs, may adversely impact our results of operations or financial condition.
The advent of cloud-based and consumption-based services creates business opportunities and risks, including that our customer base may lack the expertise and capital required to support and enable the migration to the cloud and, as a result, end users may seek to source their solutions directly from software developers. Further, our experience platform requires significant engineering expertise and investments to be able to evolve along with the offerings of our software partners. We may not invest enough or be able to attract talent to advance our proprietary technology.
Further, some of our established vendors are transitioning to as-a-service companies, providing their entire portfolio through a range of subscription-based, pay-per-use and as-a-service offerings. Many of our vendors also continue to provide hardware and software in a capital expenditure and license-based model, ultimately giving end users a choice in consuming products and services in a traditional or as-a-service offering. While we are seeking to participate in both the on-premises and cloud-based markets, such business model changes entail significant risks and uncertainties, and our vendors, resellers and we may be unable to complete the transition to a subscription-based business model or manage the transition successfully. Additionally, we may not realize all of the anticipated benefits of the transition to the new consumption model, even if it is successfully completed. The transition also means that our historical results, especially those achieved before the transition, may not be indicative of our future results. Further, as customer demand for our consumption model offerings increases, we may experience differences in the timing of revenue recognition between our traditional offerings (for which revenue is generally recognized at the time of delivery) and our as-a-service offerings (for which revenue is generally recognized ratably over the term of the arrangement), which could have an adverse effect on our business, results of operations, financial condition and cash flows.
We continually experience intense competition across all markets for our products and services.
Our competitors include local, regional, national and international distributors, service providers and e-retailers, as well as suppliers that employ a direct-sales model. As a result of intense price competition in the
44
Table of Contents
technology and IT services industries, our gross margins have historically been narrow, and we expect them to continue to be narrow in the future, which magnifies the impact of variations in revenue, operating costs, obsolescence, foreign exchange and bad debt on our operating results. In addition, when there is overcapacity in our industry, our competitors may respond by reducing their prices.
The competitive landscape has also experienced a consolidation among vendors, suppliers and customers and this trend is expected to continue, which could result in a reduction or elimination of promotional activities by the remaining vendors, suppliers and customers as they seek to reduce their expenses, which could, in turn, result in decreased demand from end users and our reseller customers for our products or services. Additionally, the trend toward consolidation within the mobile operator community is expected to continue, which could result in a reduction or elimination of promotional activities by the remaining mobile operators as they seek to reduce their expenses, which could, in turn, result in decreased demand for our products or services. Moreover, consolidation of mobile operators reduces the number of potential contracts available to us and other providers of logistics services. We could also lose business if mobile operators that are our customers are acquired by other mobile operators that are customers of our competitors, or we could face price pressures if our mobile operator customers are acquired by other mobile operators that are our customers.
We offer no assurance that we will not lose market share, or that we will not be forced in the future to reduce our prices in response to the actions of our competitors, which may put pressure on our gross margins. Furthermore, to remain competitive we may be forced to offer more credit or extended payment terms to our customers. This could increase our required capital, financing costs and the amount of our bad debt expenses. Customers, suppliers and lenders may also seek commitments from us related to sustainability and environmental impacts, and meeting these commitments may increase our cost of operations or preclude some customers from doing business with us if we cannot meet their standards.
We have also initiated and expect to continue to initiate other business activities and may face competition from companies with more experience and/or from new entrants in those markets. As we enter new areas of business or geographies or as we expand our offerings of new products or vendors, we may encounter increased competition from current competitors and/or from new competitors, some of which may be our current customers or suppliers, which may negatively impact our sales or profitability.
We have operations in 57 countries, spanning all global regions, and we sell our products and services to a global customer base of more than 161,000 customers. We are subject to anti-competition regulations in the markets we serve, and our market share may adversely impact our ability to further expand our business, as well as increase the number of compliance requirements to which we are subject and the costs associated with such compliance.
The merger of two of our competitors, Synnex and Tech Data Corporation, in September 2021 to become TD Synnex, the industrys largest IT distributor in the United States, as well as further consolidation in our industry may be disruptive to our business in a number of ways, including, but not limited to, by affecting the availability and pricing of credit lines extended by our vendors and other capital suppliers to us, any reduction of price protection, stock rotation or similar vendor incentives, heightening pricing pressures and competition for customers and impacting our attractiveness to top talent.
Our goodwill and identifiable intangible assets could become impaired, which could reduce the value of our assets and reduce our net income in the year in which the write-off occurs.
Goodwill represents the excess of the cost of an acquisition over the fair value of the assets acquired. We also ascribe value to certain identifiable intangible assets, which consist primarily of intellectual property, customer relationships and trade names, among others, as a result of acquisitions. We may incur impairment charges on goodwill or identifiable intangible assets if we determine that the fair values of the goodwill or identifiable intangible assets are less than their current carrying values. We evaluate, at least annually, whether events or circumstances have occurred that indicate all, or a portion, of the fair value of a reporting unit is less than its carrying amount, in which case an impairment charge to earnings would become necessary.
45
Table of Contents
A decline in general economic conditions or global equity valuations could impact our judgments and assumptions about the fair value of our businesses and we could be required to record impairment charges on our goodwill or other identifiable intangible assets in the future.
We have incurred and will incur additional amortization expense over the useful lives of certain assets acquired in connection with business combinations, and to the extent that the value of goodwill or intangible assets with indefinite lives acquired in connection with a business combination and investment transaction become impaired, we may be required to incur material charges relating to the impairment of those assets. For example, we had $843.1 million of goodwill and $826.1 million of identifiable net intangible assets recorded in connection with various acquisitions as of June 29, 2024. If our future results of operations for these acquired businesses do not perform as expected or are negatively impacted by any of the risk factors noted herein or other unforeseen events, we may have to recognize impairment charges which would adversely affect our results of operations.
Changes in our credit rating or other market factors, such as adverse capital and credit market conditions or reductions in cash flow from operations, may affect our ability to meet liquidity needs, reduce access to capital and/or increase our costs of borrowing.
Our business requires significant levels of capital to finance accounts receivable and product inventory that is not financed by our trade credit with our vendors. This is especially true when our business is expanding, including through acquisitions, but we may still have substantial demand for capital even during periods of stagnant or declining net sales. In order to continue operating our business, we will continue to need access to capital, including debt financing and inbound and outbound flooring. In addition, changes in payment terms with either suppliers or customers could increase our capital requirements. Our ability to repay current or future indebtedness when due, or have adequate sources of liquidity to meet our business needs, may be affected by changes to the cash flows of our subsidiaries. A reduction of cash flow generated by our subsidiaries may have an adverse effect on our liquidity. Under certain circumstances, legal, tax or contractual restrictions may limit our ability or make it more costly to redistribute cash between subsidiaries to meet our overall operational or strategic investment needs, or for repayment of indebtedness requirements.
We believe that our existing sources of liquidity, including cash resources and cash provided by operating activities, supplemented as necessary with funds available under our credit arrangements, will provide sufficient resources to meet our working capital and cash requirements for at least the next 12 months. However, volatility and disruption in the capital and credit markets, including increasingly complex regulatory constraints on these markets and changes in existing and expected interest rates, may increase our costs for accessing the capital and credit markets. In addition, our credit ratings reflect each rating organizations opinion of our financial strength, operating performance and ability to meet our debt obligations, and there can be no assurance that we will achieve a particular rating or maintain a particular rating in the future. An inability to obtain or maintain a particular rating could increase the cost and impact the availability of future borrowings. These and other adverse capital and credit market conditions, including the inability of our finance partners to meet their commitments to us, may also limit our ability to replace maturing credit arrangements in a timely manner and affect our ability to access committed capacities or the capital we require on terms acceptable to us, or at all. See Risks Related to Our IndebtednessOur substantial indebtedness could materially and adversely affect our financial condition, limit our ability to raise additional capital to fund our operations, limit our ability to increase or maintain existing levels of trade credit supplied from our suppliers and prevent us from fulfilling our obligations under our indebtedness. Furthermore, any failure to comply with the various covenant requirements of our corporate finance programs, including cross-default threshold provisions, could result in an event of default, which, if not cured or waived, could accelerate our repayment obligations and could affect our ability to access the majority of our credit programs with our finance partners. The acceleration of our repayment obligations or the lack of availability of such funding could materially harm our ability to operate or expand our business.
In addition, our cash and cash equivalents (including trade receivables collected and/or monies set aside for payment to creditors) are deposited and/or invested with various financial institutions located in the various
46
Table of Contents
countries in which we operate. We endeavor to monitor these financial institutions regularly for credit quality; however, we are exposed to risk of loss on such funds or we may experience significant disruptions in our liquidity needs if one or more of these financial institutions were to suffer bankruptcy or similar restructuring.
We cannot predict the outcome of litigation matters and other contingencies with which we may be involved from time to time.
We are involved, and in the future may become involved, in various claims, disputes, lawsuits and actions. Other than as discussed in Note 10, Commitments and Contingencies, to our audited consolidated financial statements and Note 10, Commitments and Contingencies, to our unaudited condensed consolidated financial statements, we do not believe that the ultimate resolution of matters currently pending will have a material adverse effect on our business, results of operations, financial condition and cash flows. We can make no assurances that we will ultimately be successful in our defense or prosecution of any of these matters or of any future matters. In addition, from time to time, we are, and may become, the subject of inquiries, requests for information or investigations by government and regulatory agencies regarding our business. Any such matters, regardless of their merit or resolution, could be costly and divert the efforts and attention of our management and other associates, damage our reputation or otherwise adversely affect our business. For more information regarding our current litigation matters, see Note 10, Commitments and Contingencies, to our audited consolidated financial statements and Note 10, Commitments and Contingencies, to our unaudited condensed consolidated financial statements.
Risks Related to the Macroeconomic and Regulatory Environment
We operate a global business that exposes us to risks associated with conducting business in multiple jurisdictions.
Sales outside the United States made up approximately 64% of our net sales in Fiscal Year 2023 (Successor). In addition, a significant portion of our business activity or key processes are being conducted in emerging markets, including, but not limited to, China, India, Brazil, Mexico, Peru, Colombia, Saudi Arabia, Indonesia, Malaysia, Thailand, Egypt, Argentina, Pakistan, Morocco, Lebanon and Serbia, and includes business with customers and end users that are state-owned or public sector entities. As such, a number of our subsidiaries are based outside of the United States. As a result, our future operating results and financial condition could be significantly affected by risks associated with conducting business in multiple jurisdictions, including misappropriation, fraud and increasingly complex regulations that vary from jurisdiction to jurisdiction, the violation of which can lead to serious consequences, including, but not limited to, the following:
| | trade protection laws, policies and measures; |
| | import and export duties, customs levies and value-added taxes; |
| | compliance with foreign and domestic import and export controls, economic sanctions and anti-money laundering and anti-corruption laws and regulations, including the U.S. Export Administration Regulations, various economic sanctions administered by the U.S. Treasury Departments Office of Foreign Assets Control and the U.S. Department of Commerce, the U.S. Foreign Corrupt Practices Act and similar laws and regulations of other jurisdictions for our business activities outside the United States, the violation of which could result in severe penalties including monetary fines, criminal proceedings and suspension of export privileges; |
| | laws and regulations regarding consumer and data protection, privacy, AI, network security, encryption and payments, including the Export Administration Regulations; |
| | managing compliance with legal and regulatory requirements and prohibitions, including compliance with local laws and regulations that differ or are conflicting among jurisdictions; |
| | anti-competition regulations and compliance requirements, including any new antitrust legislation that may be passed in the United States; |
| | environmental laws and regulations, such as those relating to climate change and waste disposal; |
47
Table of Contents
| | differing employment practices and labor issues; |
| | political instability, terrorism and potential or actual military conflicts or civil unrest; |
| | economic instability in a specific country or region; |
| | earthquakes, power shortages, telecommunications failures, water shortages, tsunamis, floods, hurricanes, typhoons, fires, extreme weather conditions, medical epidemics or pandemics and other natural or man-made disasters or business interruptions in a region or specific country; |
| | complex and changing tax laws and regulations in various jurisdictions; |
| | potential restrictions on our ability to repatriate funds from our foreign subsidiaries; and |
| | difficulties in staffing and managing international operations. |
The potential criminal penalties for violations of import/export controls, economic sanctions, anti-corruption and anti-competition laws, particularly the U.S. Foreign Corrupt Practices Act, data privacy and protection laws and environmental laws and regulations in many non-U.S. jurisdictions create heightened risks for our international operations. In the event that a governing regulatory body determined that we have violated any laws, including applicable import/export controls, economic sanctions or anti-corruption laws, we could be fined significant sums, incur sizable legal defense costs, be subject to debarment, and/or our import/export capabilities could be restricted, which could have a material and adverse effect on our business and reputation.
Additionally, unethical or fraudulent activities perpetrated by our directors, officers, senior management, associates, third-party suppliers and partners, including third-party shipping and freight forwarding companies, strategic partners and resellers, have exposed us in the past and in the future could continue to expose us to fraud, misappropriation, liability and reputational damage. For example, see Note 2, Revision of Previously Issued Consolidated Financial Statements to our audited consolidated financial statements and Note 2, Revision of Previously Issued Consolidated Financial Statements to our unaudited condensed consolidated financial statements. Such fraud, misappropriation, liability and/or damage to our reputation for these or any other reasons could have a material adverse effect on our business, results of operations, financial condition and cash flows, and could require additional resources to rebuild our reputation. Further, failure to comply with applicable laws and regulations and failure to maintain an effective system of internal controls may subject us to fines or sanctions and incurrence of substantial legal fees and costs. Our operating expenses could increase due to implementation of and compliance with existing and future laws and regulations or remediation measures that may be required if we are found to be noncompliant with any existing or future laws or regulations.
We are subject to risks and uncertainties associated with the impact of trade discussions between the United States and China and related U.S. security risks and export controls. The U.S. government has imposed various measures impacting trade with China, including levying various tariffs on imports from China and may impose additional measures in the future. For example, on May 15, 2019, the President of the United States issued Executive Order 13873, which authorizes export controls on entities determined to (among other things) be a U.S. security threat. The next day, the U.S. Commerce Department placed Huawei Technologies Co., Ltd. and 68 of its non-U.S. affiliates on the U.S. Entity List, generally imposing a license requirement for export to those entities of items subject to the Export Administration Regulations and a license review policy of presumption of denial for all exports to the entities added to the Entity List. In addition, in interim rulemaking issued in January 2021, and final rule making issued in June 2023, the U.S. Commerce Department issued regulations implementing Executive Order 13873, which governs information and communications technology and services transactions involving certain foreign adversaries, such as China and Russia (among other countries). On June 9, 2021, the President of the United States issued an Executive Order on Protecting Americans Sensitive Data from Foreign Adversaries, to elaborate upon measures to address the national emergency with respect to the information and communications technology and services supply chain that was declared in Executive Order 13873. As an additional example, the U.S. Commerce Department issued new rules in October 2022, supplemented by additional rules in October 2023, that further restrict the export of certain controlled items, in particular, advanced semiconductors, to companies based in China and certain other enumerated countries. We continue to assess the impact of these regulations. While our sales in China have been affected, we do not currently believe that the new regulations will have a material effect on our overall business or financial
48
Table of Contents
condition, as the primary vendor impacted by the regulations has indicated that global demand for the products subject to the export restrictions remains strong. Additionally, any future expansion of such regulations or change in interpretation of such regulations could, depending on how much advance notice we receive, result in us having a significant inventory position of items subject to such restrictions that we might not be able to sell or return to the vendor or obtain payment for from our customers. Our global operations, including in China, could be impacted by these trade restrictions and the overall uncertainty regarding trade between the United States and China. For example, in response to these and other U.S. actions, the Chinese government on July 3, 2023, imposed export restrictions on certain minerals, and in the future China could take additional countermeasures against U.S. companies doing business in or with China. We cannot predict whether China or any of the countries in which we operate could become the subject of new or additional trade restrictions. Import/export controls, tariffs, countermeasures or other trade measures involving our customers products could harm sales of such products or result in the loss of non-U.S. customers, which could harm our business.
We historically had an office in Russia that employed engineering and coding resources supporting the operation and maintenance of our cloud marketplace. On April 6, 2022, the President of the United States signed an Executive Order prohibiting, among others, new investments in Russia. While our operations in Russia were not material to our overall operations or specifically our cloud marketplace, operating in Russia for non-Russian companies became increasingly challenging due to the various trade sanctions imposed by the government of the United States, European Union, United Kingdom and other Western governments on Russian interests, the counter-measures adopted by the government of the Russian Federation in response thereto, the decisions made by actors in the private sector that go beyond the sanctions and the increasing animosity towards Western businesses in Russia.
In August 2022, we began the process of winding down our operations in Russia. In September 2022, we substantially completed the shutdown of our Russia operations, and we no longer operate in Russia. As of September 30, 2023, we no longer maintained a corporate entity in Russia and we no longer employed any associates in Russia. See Note 9, Restructuring Costs, to our audited condensed consolidated financial
statements and Note 8, Restructuring Costs, to our unaudited condensed consolidated financial statements.
Further, regional instability caused by, and any sanctions imposed in response to, geopolitical conflicts, including but not limited to the conflict between Russia and Ukraine and the conflict in Israel, Iran and surrounding areas, could lead to disruption and volatility in global markets that could adversely impact our business and supply chain, or that of our vendors or customers. At this stage, we are uncertain of the extent to which measures taken in response to the conflict could impact our business, results of operations, financial condition or cash flows.
Additionally, we have been and expect to continue to be subject to new and increasingly complex U.S. and non-U.S. government regulations that affect our operations in the United States and globally. Complying with such regulations may be time-consuming and costly, and compliance could result in the delay or loss of business opportunities. While we have implemented, and will continue to implement and maintain, measures designed to promote compliance with these laws, we cannot assure investors that such measures will be adequate or that our business will not be materially and adversely impacted in the event of an alleged violation.
We are also exposed to market risk primarily related to foreign currencies and interest rates. In particular, we are exposed to changes in the value of the U.S. dollar versus the local currency in which the products are sold and goods and services are purchased, including devaluation and revaluation of local currencies. Since more than half of our sales are from countries outside of the United States, other currencies, including, but not limited to, the euro, British pound, Chinese yuan, Indian rupee, Australian dollar, Mexican peso, Canadian dollar and Brazilian real, can have an impact on our results of operations (reported in U.S. dollars).
Currency variations, which may be caused or exacerbated by inflation, also contribute to fluctuations in sales of products and services in impacted jurisdictions. Accordingly, fluctuations in foreign currency exchange
49
Table of Contents
rates may positively or negatively impact our financial statements, which are reported in U.S. dollars. For example, in 2023, the euro and other currencies in which we transact business depreciated against the U.S. dollar, which had, and may continue to have, an adverse effect on our reported net sales and/or earnings from our foreign operations. The translation impact of foreign currencies relative to the U.S. dollar had a negative impact on our net sales growth of approximately 0.2% for Fiscal Year 2023 (Successor) compared to Fiscal Year 2022 (Successor). In addition, currency variations can adversely affect margins on sales of our products in countries outside of the United States.
We have managed our exposure to fluctuations in the value of currencies and interest rates using a variety of financial instruments entered into with financial institutions. Although we believe that we have appropriately diversified our exposures across counterparties and that through our ongoing monitoring procedures these counterparties are creditworthy financial institutions, we are nonetheless exposed to credit loss in the event of nonperformance by these counterparties. In addition, our hedging activities may not fully offset any adverse financial impact resulting from currency variations, which could affect our financial results.
Our businesses operate in various international markets, including certain emerging markets that are subject to greater political, economic and social uncertainties than developed countries.
We are monitoring the effects of Russias invasion of Ukraine. While such conflict has not yet materially impacted our business, geopolitical instability arising from such conflict, the imposition of sanctions, taxes and/or tariffs against Russia or commercial decisions to abstain from doing business with Russian-owned or Russian-managed vendors, and Russias response to such sanctions (including retaliatory acts), could adversely affect the global economic or specific international, regional and domestic markets, which could adversely impact our business. We are also monitoring the effects of the conflict in Israel, Iran and surrounding areas, which has not yet materially impacted our business but could likewise adversely affect the global economic or specific international, regional and domestic markets, which could adversely impact our business. Additionally, we operate internationally and to the extent future sanctions, laws, regulations or orders imposed by the United States, the European Union, the United Kingdom and other countries or private sector actors in response to the conflict differ between jurisdictions, we may experience regulatory and business uncertainty.
Changes in macroeconomic and geopolitical conditions can affect our business and results of operations.
Our revenues, profitability, financial position and cash flows are highly dependent on the broader movements of the macroeconomic environment. The volatility in the global economy has trickle-down effects on the overall IT market as consumers of IT products and services plan their capital expenditures in the face of economic uncertainty, which has resulted, and may continue to result, in fluctuating revenue, margins and earnings, difficulty forecasting inventory levels to achieve optimum order fill rates, difficulty collecting customer receivables, decreased availability of trade credit from suppliers and/or their credit insurance underwriters or decreased capital availability through debt and similar financing from external parties.
Further, an increase in inflation, as well as changes in existing and expected rates of inflation, could result in higher operating and labor costs, financing costs and supplier costs, which could have an adverse effect on our results of operations if we are unable to pass along such higher costs to customers. Inflation may also impact our customers ability to obtain financing, cash flows and profitability, which could adversely impact their ability to purchase our products and our ability to offer credit and collect receivables.
In addition, default by one of the several large financial institutions that are dependent on one another to meet their liquidity or operational needs or are perceived by the market to have similar financial weaknesses, so that a default by one institution causes a series of defaults by or runs on other institutions (sometimes referred to as a systemic risk) or a downgrade of U.S. or non-U.S. government securities by credit rating agencies, may expose us to investment losses, business disruption and liquidity constraints. There has recently been significant volatility and instability among banks and financial institutions. For example, on March 10, 2023, the Federal
50
Table of Contents
Deposit Insurance Corporation (FDIC) took control and was appointed receiver of Silicon Valley Bank (SVB), due primarily to liquidity concerns. Other domestic and foreign institutions have subsequently experienced similar liquidity issues. While our exposure to, and deposits with, these institutions were not, and are not currently, material, any future failure of financial institutions at which we maintain funds, or events involving limited liquidity, defaults, non-performance or other adverse conditions in the financial or credit markets impacting these institutions, or concerns or rumors about such events, may lead to disruptions in our ability to access our bank deposits or otherwise adversely impact our liquidity and financial performance. Such incidents have exposed, and in the future may impose, strains on the banking sector as a whole and demonstrate a heightened risk of systemic failures throughout the financial industry. We maintain cash balances at financial institutions in excess of the FDIC insurance limit, and if one or more of the financial institutions at which we maintain funds were to fail, there is no guarantee regarding the amount or timing of any recovery of the funds deposited, whether through the FDIC or otherwise. Additionally, we continue to monitor the risk that one or more of our vendors, suppliers, strategic partners, resellers, other business partners and financial institutions, could be impacted by such instability, which could adversely affect our business, results of operations, financial condition and cash flows.
Our business may also be impacted by sustained uncertainty about global economic conditions; continued negative economic trends or instability; heightened trade and geopolitical tension among the United States, China, Taiwan, Russia, Middle Eastern countries or other countries in which we operate or from which we procure products; civil unrest; political instability; global public health issues, a global recession or economic downturn in the countries in which we do business, leading to:
| | reduced demand for products in general; |
| | shifts in consumer demand for products and services, which may lead to loss of sales and/or market share; |
| | difficulty in forecasting demand, including the seasonality of demand; |
| | more intense competition, which may lead to loss of sales and/or market share; |
| | reduced prices and lower gross margin; |
| | loss of vendor rebates and other incentives; |
| | extended payment terms with customers; |
| | increased bad debt risks; |
| | shorter payment terms with vendors; |
| | reduced access to liquidity and higher financing and interest costs; |
| | increased currency volatility making hedging more expensive and more difficult to obtain; |
| | reduced availability of credit insurance capacity or acceptable terms to mitigate risk; and |
| | increased inventory losses related to obsolescence and/or excess quantities and/or theft/misappropriation. |
Each of these factors, individually or in the aggregate, could adversely and materially affect our results of operations, financial condition and cash flows. We may not be able to adequately adjust our cost structure in a timely fashion to remain competitive, which may cause our profitability to suffer.
Tariffs may result in increased prices and could adversely affect our business, results of operations, financial conditions and cash flows.
The U.S. government has imposed tariffs on certain products imported into the United States, and the Chinese government has imposed tariffs on certain products imported into China, which have increased the
51
Table of Contents
prices of many of the products that we purchase from our vendors. The tariffs, along with any additional tariffs or trade restrictions that may be implemented by the United States, China or other countries, could result in further increased prices or challenges in procuring product for resale. While we intend to pass price increases on to our customers, the effect of tariffs on prices may impact demand, sales and results of operations. Retaliatory tariffs imposed by other countries on U.S. goods have not yet had a significant impact, but we cannot predict further developments. The tariffs and the additional operational costs incurred in minimizing the number of products subject to the tariffs could adversely affect the operating profits for certain of our businesses and customer demand for certain products, which could have an adverse effect on our business, results of operations, financial condition and cash flows.
In addition, in the event that we pay tariffs for products we import from China which are then re-exported to other locations outside of the United States, we may be eligible for refunds of certain tariffs. In order to qualify for these tariff drawbacks, we must provide data and documentation to the U.S. government that we must obtain from third-party sources, such as our suppliers. There is no guarantee we will be able to obtain this additional data and documentation from those other sources, which could result in the U.S. government rejecting the drawback requests. Further, there are additional administrative costs expended by us in furtherance of these efforts. Finally, due to the backlog of drawback applications, the U.S. government has been slow in issuing the associated drawback refunds. Our inability to obtain the drawback refunds or significant delays in receiving them could result in a material adverse effect on our business.
U.S.-China tensions around technology, national security and human rights could adversely affect our business.
Our business within China is predominantly Technology Solutions, consisting of distribution of Western products in China. The evolving regulatory landscape in both the United States and China regarding technology and national security remains uncertain. Enactment by China of laws, regulations and/or practices that favor Chinese technology vendors over the Western ones that comprise our business could materially and adversely impact our business in China. Actions taken by the U.S. government to prohibit or restrict exports of key technology by U.S. vendors to Chinese end-customers, whether located in China or in other regions such as Europe, could also adversely affect our business. Net sales in China for Fiscal Year 2023 (Successor) were $3.1 billion. In addition, countermeasures imposed by China, such as export restrictions, could impact the supply of critical components to our vendors and their suppliers, which could adversely affect our business on a global basis.
To a lesser extent, we also distribute products in the United States made by Chinese vendors. Risks associated with doing business with these Chinese vendors, in particular actual or perceived cybersecurity risks of their products, could also adversely affect our business. For example, in October 2021, the offices of one such vendor, PAX Technology (PAX), a Chinese provider of point-of-sale devices used by millions of businesses and retailers globally, were raided in connection with an investigation related to PAXs reported potential involvement in cyberattacks on U.S. and European Union (EU) organizations. We continue to monitor public news sources for further updates and are investigating the impact of this event on Ingram Micros operations. These steps reflect the actions we would take as the result of any such similar incident.
In addition, changes in the relationship between China and Taiwan could disrupt the operations of several companies in Taiwan that are our vendors or are in our vendors supply chains. Disruption of certain critical operations in Taiwan may have a material adverse effect on key sectors within the global technology industry. Furthermore, scrutiny by the U.S. government on human rights practices in China, as well as on the transparency of companies with business operations in China, may likewise have an adverse effect on key sectors within the global technology industry.
Increasing attention on environmental, social and governance (ESG) matters may impact our business, subject us to unforeseen liability or cause harm to our reputation.
Recently, various stakeholders, including lenders, customers, vendors, local communities, regulators, public interest groups and consumers, are placing an increased focus on ESG matters, such as diversity, equity and
52
Table of Contents
inclusion, environmental protection and social responsibility. ESG standards are evolving, and if we are perceived, due to unfavorable ESG ratings or otherwise, to have not responded appropriately to those standards, regardless of whether there is a legal requirement to do so, such perception could have a negative impact on our reputation, which could, in turn, have a negative impact on our business, including as it relates to associate retention, consumer sales or investor interest. There are certain organizations that provide information to investors and other stakeholders on ESG matters that have developed ratings processes for evaluating companies on their approach to such ESG matters with no universal standard applied for these ratings. While some investors may use these ESG ratings to inform their investment and voting decisions, such ratings may result in misplaced focus on certain factors over others.
We have publicly communicated, and from time to time will continue to publicly communicate, certain initiatives and goals regarding ESG matters. There is no guarantee that we will be able to achieve these initiatives or goals. Our ability to successfully execute these initiatives and accurately report our progress presents numerous operational, financial, legal, reputational and other risks, many of which are outside of our control, and which could have a material negative impact on our business and reputation. Additionally, the implementation of these initiatives imposes additional costs and other administrative burdens on us. Our failure, or perceived failure, to pursue or fulfill our goals, targets and objectives or to satisfy various reporting standards on the time frames we announce could have negative impacts on our business, financial condition and results of operations and expose us to liability, including litigation. Our ability to meet the standards imposed on us or that we choose or aspire to achieve may impact the perceptions held by our various stakeholders or the communities in which we do business. Further, different stakeholders may assess our achievement of these standards inconsistently, which could result in a negative perception or misrepresentation of our policies and practices.
A number of our customers may also adopt, or have already adopted, policies that impose standards on suppliers, such as environmental testing requirements or social responsibility standards. Likewise, some of our vendors have adopted such policies and standards with respect to their customers. The failure to meet our customers or vendors requirements could have an adverse effect on our business, including our ability to retain such customers or vendors. In addition, any ESG issues in our own supply chain, such as human rights, safety or environmental issues, could have an adverse effect on our business, including harm to our reputation.
Our failure to comply with the requirements of environmental, health and safety regulations or other laws and regulations applicable to a distributor of consumer products could adversely affect our business.
Our business, facilities and operations are subject to various federal, state, local and foreign laws, rules and regulations addressing matters such as:
| | labor and employment; |
| | product safety and product stewardship, including regulations enforced by the United States Consumer Products Safety Commission; |
| | import and export activities; |
| | the internet and e-commerce; |
| | antitrust issues; |
| | taxes; and |
| | environmental, health, safety and other impacts, including as it relates to chemical usage, carbon and air emissions, worker health and safety, wastewater and storm water discharges, recycling of products at the end of their useful life and the generation, handling, storage, transportation, treatment and disposal of waste and other materials, including hazardous materials. |
These laws include the European Union Waste Electrical and Electronic Equipment Directive as enacted by individual European Union countries and other similar legislation adopted in North America, which make producers of electrical goods, including computers and printers, responsible for collection, recycling, treatment
53
Table of Contents
and disposal of recovered products. Failure to comply or allegations of noncompliance with these laws, rules and regulations could result in substantial costs, fines and civil or criminal sanctions, as well as third-party claims for property damage or personal injury. Further, environmental health and safety laws and the enforcement of such laws (including relating to climate change) may change, becoming more stringent over time, imposing greater compliance costs and increasing risks and penalties associated with violations.
In many countries, governmental bodies are enacting new or additional legislation and regulations to reduce or mitigate the potential impacts of climate change. If we, our suppliers or our vendors are required to comply with these laws and regulations, or if we choose to take voluntary steps to reduce or mitigate our impact on climate change, we may experience increased costs for energy and transportation, increased capital expenditures, increased insurance premiums and deductibles or other unforeseen costs or business disruptions, which could adversely impact our operations. Inconsistency of legislation and regulations among jurisdictions may also affect the costs of compliance with such laws and regulations. Any assessment of the potential impact of future climate change legislation, regulations or industry standards, as well as any international treaties and accords, is uncertain given the wide scope of potential regulatory change in the countries in which we operate.
We may also be subject to liability for the remediation of contaminated soil or groundwater, including at sites currently or formerly owned or operated by us or our predecessors in interest or in connection with third-party contaminated sites where have sent waste for treatment or disposal. While we take actions designed to ensure that we are in compliance with all applicable regulations, certain of these regulations, including those relating to the remediation of soil and groundwater, may impose strict liability and liability may be joint or several.
Although we believe that we are in substantial compliance with all applicable laws and regulations, because legal requirements frequently change and are subject to interpretation, we are unable to predict the ultimate cost of compliance or the consequences of non-compliance with these requirements, or the effect on our operations, any of which may be significant. We routinely incur costs in complying with these regulations and, if we fail to comply, we could incur significant penalties, such as criminal sanctions or civil remedies, including fines, penalties, injunctions or prohibitions on importing or exporting, and our operations may be shut down. A failure to comply with applicable laws and regulations, or concerns about product safety, also may lead to a recall or post-manufacture repair of selected products, resulting in the rejection of our products by our customers and end users, lost sales, increased customer service and support costs and costly litigation. In addition, failure to comply with environmental, health and safety requirements could require us to shut down one or more of our facilities. There is a risk that any claims or liabilities, including product liability claims, relating to such noncompliance may exceed, or fall outside the scope of, our insurance coverage. Any changes in regulations, the imposition of additional regulations or the enactment of any new governmental legislation that impacts employment/labor, trade, healthcare, tax, environmental or other business issues could have a material adverse impact on our business, results of operations, financial condition and cash flows.
Changes in accounting rules could adversely affect our reported operating results.
Our consolidated financial statements are prepared in accordance with GAAP. These principles are subject to interpretation by various governing bodies, including the Financial Accounting Standards Board, which create and interpret appropriate accounting standards. Future periodic assessments required by current or new accounting standards may result in additional noncash charges and/or changes in presentation or disclosure. A change from current accounting standards could have a significant adverse effect on our reported financial position or results of operations.
Unanticipated changes in effective tax rates or adverse outcomes resulting from examination of our income or other tax returns could adversely affect our results of operations and financial condition.
Together with our subsidiaries, we are subject to taxation in many jurisdictions worldwide. The future effective tax rates applicable to us and our subsidiaries as a group could be subject to volatility or adversely
54
Table of Contents
affected by a number of factors, including changes in the valuation of our deferred tax assets and liabilities, limitations on the tax deductibility of interest expense, tax effects of stock-based compensation and other executive compensation programs or changes in tax laws, regulations or interpretations thereof. In addition, we and our subsidiaries may be subject to audits of our income, sales and other taxes by U.S. federal, state, local and non-U.S. taxing authorities. Outcomes from these audits could have an adverse effect on our business, results of operations, financial condition and cash flows.
Changes in, or interpretations of, tax rules and regulations, changes in the mix of our business among different tax jurisdictions, and deterioration of the performance of our business may adversely affect our effective income tax rates or operating margins, and we may be required to pay additional taxes and/or tax assessments, as well as record valuation allowances relating to our deferred tax assets.
In addition to payroll taxes, we are subject to both income and transaction-based taxes in substantially all countries and jurisdictions in which we operate, which are complex. Changes to tax laws or regulations or to their interpretation or application by governments could adversely affect our future earnings and cash flows. For example, in light of continuing global fiscal challenges, various levels of government and international organizations such as the Organisation for Economic Co-operation and Development (OECD) and the European Union are increasingly focused on tax reform and other legislative or regulatory action to increase tax revenue. These tax reform efforts, such as the OECDs Base Erosion and Profit Shifting Project, are designed to ensure that corporate entities are taxed on a larger percentage of their earnings. Tax reform efforts include proposals that may change various aspects of the existing framework under which our tax obligations are determined in many of the countries in which we do business and increase the complexity, burden and cost of tax compliance. For example, the OECD/G20 Inclusive Framework released a statement on a two-pillar solution to address the tax challenges arising from the digital economy in October 2021, which includes proposals to reallocate profits among taxing jurisdictions based on a market-based concept rather than historical permanent establishment concepts and subject multinational enterprises to a global minimum corporate tax rate of 15%. These proposals have been agreed to in principle by 145 OECD member jurisdictions. In August 2022, the U.S. government enacted the Inflation Reduction Act, which imposes a corporate alternative minimum tax of 15% on adjusted financial statement income for certain corporations. Although we are currently evaluating the impact this law may have, we do not expect our effective tax rate to increase as a result of the legislation. Our effective income tax rate in the future could be adversely affected by changes in the mix of earnings in countries with differing statutory tax rates, changes in the valuation of deferred tax assets and liabilities, limitations on the tax deductibility of interest expense, tax effects of stock based compensation and other executive compensation programs, changes to our operating structure, changes in tax laws, regulations or interpretation thereof and the discovery of new information in the course of our tax return preparation process.
Likewise, changes to our transaction tax liabilities could adversely and materially affect our future results of operations, cash flows and our competitive position. We engage in a high volume of transactions where multiple types of consumption, commercial and service taxes are potentially applicable. An inability to appropriately identify, charge, remit and document such taxes, along with an inconsistency in the application of these taxes by the applicable taxing authorities, may negatively impact our gross and operating margins, financial position or cash flows.
We are subject to the continuous examination of both our income and transaction tax returns by the U.S. Internal Revenue Service and other domestic and foreign tax authorities. While we regularly evaluate our tax contingencies and uncertain tax positions to determine the adequacy of our provision for income and other taxes based on the technical merits and the likelihood of success resulting from tax examinations, any adverse outcome from these continuous examinations may have an adverse effect on our operating results and financial position.
55
Table of Contents
Risks Related to Our Indebtedness
Our substantial indebtedness could materially and adversely affect our financial condition, limit our ability to raise additional capital to fund our operations, limit our ability to increase or maintain existing levels of trade credit supplied from our suppliers and prevent us from fulfilling our obligations under our indebtedness.
We have a significant amount of indebtedness. As a result of our substantial indebtedness incurred in connection with the Imola Mergers, a significant amount of our cash flows is required to pay interest and principal on our outstanding indebtedness, and we may not generate sufficient cash flows from operations, or have future borrowings available under the ABL Revolving Credit Facility, to enable us to repay our indebtedness or to fund our other liquidity needs. As of June 29, 2024, we had total indebtedness of $3,629.5 million, including the 2029 Notes, borrowings outstanding under the ABL Revolving Credit Facility and borrowings under the Term Loan Credit Facility, and we had unused commitments under the ABL Revolving Credit Facility available to us of $3,500 million. On September 28, 2024, the Company had $3,379 million of availability under the ABL Revolving Credit Facility. Cash paid for interest expense was $18.1 million, $174.4 million, $320.0 million, $378.6 million and $171.2 million for the Predecessor 2021 Period, the Successor 2021 Period, Fiscal Year 2022 (Successor), Fiscal Year 2023 (Successor) and the Unaudited 2024 Interim Period (Successor), respectively. See Capitalization.
Subject to the limits contained in the ABL Credit Agreement and the Term Loan Credit Agreement, the Indenture and our other debt instruments, we may incur substantial additional debt from time to time to finance working capital, capital expenditures, investments or acquisitions or for other purposes. If we do so, the risks related to our high level of debt would further increase. Specifically, our high level of debt could have important consequences, including:
| | making it more difficult for us to satisfy our obligations with respect to our debt; |
| | limiting our ability to obtain additional financing to fund future working capital, capital expenditures, acquisitions or other general corporate requirements; |
| | requiring a substantial portion of our cash flows to be dedicated to debt service payments instead of other purposes, thereby reducing the amount of cash flows available for working capital, capital expenditures, acquisitions and other general corporate purposes; |
| | increasing our vulnerability to general adverse economic and market conditions; |
| | exposing us to the risk of increased interest rates as certain of our borrowings, including borrowings under the ABL Credit Facilities and the Term Loan Credit Facility, are at variable rates of interest; |
| | limiting our flexibility in planning for and reacting to changes in the markets in which we compete and to changing business and economic conditions; |
| | restricting us from making strategic acquisitions or causing us to make non-strategic divestitures in order to generate cash proceeds necessary to satisfy our debt obligations; |
| | impairing our ability to obtain additional financing in the future; |
| | placing us at a disadvantage compared to other, less leveraged competitors and affecting our ability to compete; |
| | limiting our ability to retain or increase levels of trade credit and financing provided by our suppliers, or generating less advantageous pricing or rebate structures from our suppliers; and |
| | increasing our cost of borrowing. |
We are also party to certain additional lines of credit, short-term overdraft facilities and other credit facilities with approximately $179.4 million outstanding under these facilities as of June 29, 2024. See Description of Material Indebtedness.
56
Table of Contents
We may not be able to generate sufficient cash flows from operations to service all of our indebtedness and may be forced to take other actions to satisfy our obligations under our indebtedness, which may not be successful.
Our ability to make scheduled payments on or refinance our debt obligations depends on our financial condition and operating performance, which are subject to prevailing economic and competitive conditions and to financial, business, legislative, regulatory and other factors beyond our control. We might not be able to maintain a level of cash flows from operations sufficient to permit us to pay the principal, premium, if any, and interest on our indebtedness.
If our cash flows and capital resources are insufficient to fund our debt service obligations, we could face substantial liquidity problems and could be forced to reduce or delay investments and capital expenditures or to dispose of material assets or operations, seek additional debt or equity capital or restructure or refinance our indebtedness. Additionally, we may not be able to obtain loans or other debt financings on commercially reasonable terms or at all. Even if successful, those alternative actions may not allow us to meet our scheduled debt service obligations. The Credit Agreements and the Indenture restrict, and the agreements governing our indebtedness in the future may restrict, our ability to dispose of certain assets and use the proceeds from such dispositions and may also restrict our ability to raise debt or equity capital to be used to repay other indebtedness when it becomes due. Because of these restrictions, we may not be able to consummate those dispositions or to obtain proceeds in an amount sufficient to meet any debt service obligations then due.
Our inability to generate sufficient cash flows to satisfy our debt obligations, or to refinance our indebtedness on commercially reasonable terms or at all, would materially and adversely affect our business, results of operations, financial condition and cash flows as well as our ability to satisfy our obligations under our indebtedness.
Additionally, any inability to generate sufficient cash flows to satisfy our debt obligations or to refinance our indebtedness on commercially reasonable terms or at all could result in a material adverse effect on our business, results of operations, financial condition and cash flows, and could negatively impact our ability to satisfy our obligations under our indebtedness, which in turn could negatively impact investments in our Common Stock. If we cannot make scheduled payments on our indebtedness, we will be in default and holders of our indebtedness could declare all outstanding principal and interest to be due and payable, the lenders under the ABL Revolving Credit Facility could terminate their commitments to loan additional money to us, the lenders could foreclose against the assets securing their borrowings and we could be forced into bankruptcy or liquidation. Any or all of these events could result in investors losing all or a part of their investments in our Common Stock.
The Indenture and the Credit Agreements contain a number of restrictive covenants that impose significant operating and financial restrictions on us and limit our ability to engage in acts that may be in our long-term best interest, including restrictions on our ability and the ability of our subsidiaries to:
| | incur additional indebtedness and guarantee indebtedness; |
| | pay dividends or make other distributions in respect of, repurchase or redeem, capital stock; |
| | prepay, redeem or repurchase certain debt; |
| | issue certain preferred stock or similar equity securities; |
| | make loans and investments; |
| | sell assets; |
| | incur liens; |
| | enter into agreements containing prohibitions affecting our subsidiaries ability to pay dividends; |
57
Table of Contents
| | enter into transactions with affiliates; and |
| | consolidate, merge or sell all or substantially all of our assets. |
As a result of all of these restrictions, we may be:
| | limited in how we conduct our business; |
| | unable to raise additional debt or equity financing to operate during general economic or business downturns; or |
| | unable to compete effectively or to take advantage of new business opportunities. |
These restrictions might hinder our ability to grow in accordance with our strategies. With respect to the ABL Credit Facilities, we will also be required by a springing financial covenant to, on any date when Adjusted Availability (as such term is defined in the ABL Credit Agreement) is less than the greater of (i) 10% of the lesser of the Line Cap (as such term is defined in the ABL Credit Agreement) and (ii) $300 million, maintain a minimum fixed charge coverage ratio of 1.00 to 1.00, tested for the four fiscal quarter periods ending on the last day of the most recently ended fiscal quarter for which financials have been delivered, and at the end of each succeeding fiscal quarter thereafter until the date on which Adjusted Availability has exceeded the greater of (x) 10% of the Line Cap and (y) $300 million for 30 consecutive calendar days. Our ability to meet the financial covenant could be affected by events beyond our control. While we anticipate that we will continue to be able to maintain compliance with this covenant immediately following the consummation of this offering, we cannot assure investors that we will not breach this covenant or other covenants in our Credit Facilities in the future, or other covenants in our future credit facilities.
A breach of the restrictive, reporting and other covenants under the Indenture or under the Credit Agreements could result in an event of default under the applicable indebtedness. Such a default, if not cured or waived, may allow the creditors to accelerate the related debt and may result in the acceleration of any other debt that is subject to an applicable cross-acceleration or cross-default provision. In addition, an event of default under the Credit Agreements would permit the lenders under the ABL Revolving Credit Facility to terminate all commitments to extend further credit thereunder. Furthermore, if we were unable to repay the amounts due and payable under the Credit Facilities, those lenders could proceed against the collateral securing such indebtedness. In the event our lenders or holders of the 2029 Notes accelerate the repayment of our borrowings, we and our subsidiaries may not have sufficient assets to repay that indebtedness.
Our variable rate indebtedness subjects us to interest rate risk, which could cause our debt service obligations to increase significantly.
Borrowings under the Credit Facilities are, and borrowings under the agreements governing our future indebtedness may be, subject to variable rates of interest, exposing us to interest rate risk. As interest rates increase, our debt service obligations on the variable rate indebtedness will increase even though the amount borrowed may remain the same, and our profit and cash flows, including cash available for servicing our indebtedness, will correspondingly decrease. Assuming that our ABL Revolving Credit Facility was fully drawn as of June 29, 2024, each one-eighth percentage point change in interest rates would result in a change of approximately $5.95 million in annual interest expense on the indebtedness under our Credit Facilities. See Managements Discussion and Analysis of Financial Condition and Results of OperationsQuantitative and Qualitative Disclosures About Market RiskInterest Rate Risk. To mitigate the Companys exposure to interest rate risk arising from the Companys long-term debt, the Company entered into certain agreements during the first quarter of 2023 to establish a 5.5% upper limit on the LIBOR interest rate applicable to a substantial portion of the borrowings under the Term Loan Credit Facility. During the second quarter of 2023, we amended the ABL Revolving Credit Facility and the Term Loan Credit Facility to transition from LIBOR to the Secured Overnight Financing Rate (SOFR) as the interest reference rate, and we amended the interest rate cap agreements to establish a 5.317% upper limit on the SOFR interest rate. These interest rate cap agreements transitioned from LIBOR to SOFR as the interest reference rate during the third quarter of 2023.
58
Table of Contents
These transitions may result in increased interest expense to us and may affect our ability in the future to incur debt on terms acceptable to us, which could adversely affect our business, results of operations, financial condition and cash flows. In the future, we may enter into other interest rate swaps that involve the exchange of floating for fixed rate interest payments in order to reduce interest rate volatility. However, it is possible that we will not maintain interest rate swaps with respect to any of our variable rate indebtedness. Alternatively, any swaps we enter into may not fully or effectively mitigate our interest rate risk.
The Indenture governing the 2029 Notes and the Credit Agreements governing the Credit Facilities contain cross-default or cross-acceleration provisions that may result in all of the debt issued under the Indenture and the Credit Agreements to become immediately due and payable because of a default under an unrelated debt instrument.
Our failure to comply with the obligations contained in the agreements governing any of our debt instruments could result in an event of default under such instruments, which could result in the 2029 Notes and the Credit Facilities (together with accrued and unpaid interest and other fees) becoming immediately due and
payable. In such event, we would need to raise funds from alternative sources, which funds may not be available to us on favorable terms, on a timely basis or at all. Alternatively, such a default could require us to sell certain of our assets and otherwise curtail our operations in order to pay our creditors. These alternative measures could have a material adverse effect on our business, results of operations, financial condition and cash flows, which could cause us to become bankrupt or insolvent or otherwise impair our ability to make cash available by dividend, debt repayment or otherwise to enable us to make payments in respect of our indebtedness.
Risks Related to Our Reliance on Third Parties
We face a variety of risks in our reliance on third-party service companies, including shipping companies and a cloud service provider, for the delivery of our products and outsourcing arrangements.
We rely almost entirely on arrangements with third-party shipping and freight forwarding companies for the delivery of our products. Freight and shipping charges may increase due to rising fuel cost, inflation, labor disputes or general price increases. For example, in 2021, one of our key transportation suppliers notified us of a significant rate increase in our transportation cost base. Any such increases have an immediate adverse effect on our margins unless we are able to pass the increased charges to our customers or renegotiate terms with our suppliers. Additionally, the termination of our arrangements with one or more of these third-party shipping companies, or the failure or inability of one or more of these third-party shipping companies to deliver products from vendors to us or products from us to our customers, even temporarily, could materially disrupt our business and harm our reputation and operating results, and we and our vendors and customers may be unable to mitigate such disruptions by securing alternate shipping arrangements.
Ingram Micro Xvantage utilizes the cloud infrastructure of the Google Cloud Platform and relies on AI-based tools associated with the Google Cloud Platform for the day-to-day functioning of some of the AI capabilities within the Xvantage platform, such as providing recommendations to users. If the Google Cloud Platform experiences technical issues, such as server outages, network disruptions, or performance degradation, it could directly and adversely impact the availability and performance of the Xvantage platform. Users may be unable to access the platform, experience lag or disconnections, or encounter other technical problems, leading to frustration and potential churn. Reliance on a single cloud provider or third-party service could also leave us vulnerable to vendor lock-in and price increases. We may not be able to easily switch Google Cloud operations to another cloud service provider or to our on-premise infrastructure if there are disruptions or interference with our use of Google Cloud.
In addition, we have outsourced various transaction-oriented service and support functions to business process outsource providers, including third-party customer service platforms that utilize AI in their provided services (subject to relevant terms of use governing Ingram Micros use of such products). We have also
59
Table of Contents
outsourced a significant portion of our IT infrastructure function and certain IT application development functions to third-party providers. We may outsource additional functions to third-party providers. Our reliance on third-party providers to provide services to us, our customers and suppliers, could result in significant disruptions and costs to our operations, including damaging our relationships with our suppliers and customers, if these third-party providers do not meet their obligations to adequately maintain an appropriate level of service for the outsourced functions or fail to adequately support our IT requirements. As a result of our outsourcing activities, it may also be more difficult to recruit and retain qualified associates for our business needs.
We or our vendors, suppliers or customers may experience damage to or disruptions at our respective facilities caused by natural disasters and other factors, such as climate change, which may result in our business, financial condition and results of operations being adversely affected.
Several of our facilities or those of our vendors, suppliers and customers could be subject to a catastrophic loss or business interruptions due to extreme weather events, including as a result of climate change (such as drought, wildfires, increased storm severity and frequency and sea level rise), earthquakes, tornadoes, floods, hurricanes, fire, power loss, telecommunication and information systems failure, inclement weather, failure of the power grid or other similar events. We maintain disaster recovery and business continuity plans that would be implemented in the event of incidents such as severe weather events; however, we cannot be certain that our plans will protect us or our vendors, suppliers or customers from all such events. While we maintain insurance coverage to mitigate business continuity risks, among other risks, such coverage may be insufficient to recover all such losses, or we may not be able to reestablish our operations and, as a result, our customers or suppliers may experience material disruptions in their operations as a result of such events, which could materially and adversely affect our business, results of operations, financial condition and cash flows.
Termination of a key supply or services agreement or a significant change in vendor terms or conditions of sale could negatively affect our operating margins, revenue or the level of capital required to fund our operations.
Our agreements with most of our key vendors are terminable upon short notice and for any reason. Additionally, under most of our agreements, our vendors are not required to accept the purchase orders we regularly place. Should our contractual relationships with vendors be terminated or, even if not terminated, should vendors decide to reject our purchase orders, our business may be materially and adversely impacted.
A significant percentage of our net sales relates to products sold to us by relatively few vendors. As a result of such concentration, terminations of supply or services agreements, a significant change in the terms or conditions of sale from one or more of our significant vendors or the bankruptcy or closure of business by one or more of our key vendors could negatively affect our operating margins, revenues and/or the level of capital required to fund our operations. Our vendors have the ability to make, and in the past have made, rapid and significantly adverse changes in their sales terms and conditions, such as reducing the amount of price protection and return rights offered to us, as well as reducing the level of purchase discounts and rebates they make available to us. In most cases, we have no guaranteed price or delivery agreements with vendors. In certain product categories, such as systems, limited price protection or return rights offered by vendors may have a bearing on the amount of product we may be willing to purchase for stock. We expect restrictive vendor terms and conditions to continue for the foreseeable future. Our inability to pass through to our customers the impact of these changes, as well as our failure to develop systems to manage ongoing vendor programs, could cause us to record inventory write-downs or other losses and could have a negative impact on our gross margins.
We receive purchase discounts and rebates from vendors based on various factors, including sales or purchase volume, breadth of customers and achievement of other quantitative and qualitative goals set by the vendors. These purchase discounts and rebates may affect gross margins and ultimately, profitability. Many purchase discounts from vendors are based on percentage increases in sales of products. Our operating results could be negatively impacted if these rebates or discounts are reduced or eliminated or if our vendors significantly increase the complexity of the process and costs for us to receive such rebates.
60
Table of Contents
Our ability to obtain particular products or product lines in the required quantities to fulfill customer orders on a timely basis is critical to our success. The technology industry experiences significant product supply shortages and customer order backlogs from time to time due to the inability of certain vendors to supply certain products on a timely basis. As a result, we have experienced, and may continue to experience, shortages of specific products that may last for an indefinite period of time, which can significantly impact pricing of such products. Vendors have, from time to time, made efforts to reduce the number of distributors with whom they do business. This could result in more intense competition as distributors strive to secure distribution rights with these vendors, which could have an adverse effect on our operating results. If vendors are not able to provide us with an adequate supply of products to fulfill our customer orders on a timely basis or we cannot otherwise obtain particular products or a product line or vendors substantially increase their existing distribution through other distributors, their own dealer networks or directly to resellers, our reputation, sales and profitability may materially suffer.
Our business may be adversely affected by some vendors strategies to consolidate business or increase their direct sales, which in turn could cause our business and operating results to suffer.
A determination by any of our primary vendors to consolidate their business with other distributors or systems integrators could negatively affect our business and operating results. Consolidation of vendors has resulted in fewer sources for some of the products and services that we distribute. This consolidation has also resulted in larger vendors that have significant operating and financial resources and wield significant bargaining power to pursue aggressive business terms. In certain cases, consolidation has led, and in the future may continue to lead, to vendors adjusting their strategies, streamlining product offerings and modifying the sales volume flowing through the distribution channel, relying more heavily on internal sales forces. For example, in January 2024, HPE, one of our longstanding vendor partners, announced its intention to acquire Juniper Networks, another one of our longstanding vendor partners, and changes in those vendors sales practices or strategies following the closing of the acquisition and subsequent integration of the businesses could result in a reduction in our aggregate revenues with respect to such accounts. Other vendors may reduce or eliminate promotional activities to reduce their expenses, which could, in turn, result in declined demand from our reseller or retailer customers and end users.
Some vendors, including some of our primary vendors, sell products and services directly to reseller and/or retail customers and/or end users, thereby significantly limiting our addressable market and business opportunities. If large vendors increasingly sell directly to end users or our resellers and retailers, rather than use us as the distributor of their products and services, our business and operating results will materially suffer.
Substantial defaults by our customers or the loss of significant customers could have a negative impact on our business, results of operations, financial condition or liquidity.
As is customary in many industries, we extend credit to our customers for a significant portion of our net sales. Customers have a period of time, generally 30 days after date of invoice, to make payment. We are subject to the risk that our customers will not pay for the products or services they have purchased, a risk that we have experienced more frequently in emerging foreign markets but has also occurred in the United States. For example, in 2022, one of our customers in the United States went into receivership and we experienced a loss of less than $10 million for which we did not have insurance coverage. As another example, an aging receivable related to a public sector customer in Latin America, with a balance of $8.1 million as of June 29, 2024, led to bad debt expense of $7.4 million during the quarter ended April 1, 2023, and an additional reserve may be required related to aging of this same receivable from a single project for which collections continue to be delayed. The risk that we may be unable to collect on receivables may increase if our customers experience decreases in demand for their products and services or otherwise become less stable, due to adverse economic conditions or otherwise. If there is a substantial deterioration in the collectability of our receivables or if we cannot obtain credit insurance at reasonable rates, are unable to collect under existing credit insurance policies or fail to take other actions to adequately mitigate such credit risk, our earnings, cash flows and our ability to utilize
61
Table of Contents
receivable-based financing could significantly deteriorate and credit insurance may become more expensive and on terms that are less favorable to us. In addition, our customers generally do not have an obligation to purchase products or services from us. In the event a significant customer decides to make its purchases from a competitor, experiences a significant change in demand from its own customer base, becomes financially unstable or is acquired by another company, our revenues, and our ability to access rebates or reduced pricing from product suppliers or vendors may be negatively impacted, resulting in a materially adverse effect to our business or results of operations.
We do not have guaranteed future sales of the products we sell and when we enter into contracts with our customers we generally take the risk of certain cost increases, and our business, financial condition, results of operations and operating margins may be negatively affected if we purchase more products than our customers require, product costs increase unexpectedly, we experience high start-up costs on new contracts or our contracts are terminated.
Certain of our contracts are long-term, fixed-price agreements with no guarantee of future sales volumes, and may be terminated for convenience on short notice by our customers, often without meaningful penalties, and often provide that we are reimbursed for the cost of any inventory specifically procured for the customer or inventory that is not commonly sold to our other customers. In addition, we purchase inventory based on our forecasts of anticipated future customer demand. As a result, we have taken, and will continue to take, the risk of holding excess inventory if our customers do not place orders consistent with our forecasts, particularly with respect to inventory that has a more limited shelf life. Also, even though we may sometimes enter into long-term pricing agreements with our vendors, we run the risk of not being able to pass along to our customers, or otherwise recover, unexpected increases in our product costs, including as a result of changing environmental laws and regulations, the effects of climate change on pricing and sourcing and commodity price increases and tariffs, which may increase above our established prices at the time we entered into the contract and established prices for products we provide. When we are awarded new contracts, particularly just-in-time contracts, we may incur high costs, including salary and overtime costs, to hire and train on-site personnel, in the start-up phase of our performance. In the event that we purchase more products than our customers require, product costs increase unexpectedly, we experience high start-up costs on new contracts, or our contracts are terminated, our business, financial condition, results of operations and operating margins could be negatively affected.
Risks Related to Information Technology, Data Privacy and Intellectual Property
Our dependence on a variety of information systems to operate our business could, if such systems are not properly functioning, maintained and available, result in disruptions to our business and harm our reputation and net sales.
We depend on a variety of information systems for our operations, many of which are proprietary, including one of our legacy mainframe enterprise resource planning (ERP) systems, which have historically supported many of our material business operations such as inventory and order management, shipping, receiving and accounting. Because a significant number of our information systems are internally developed systems and applications in the legacy programming language COBOL, it can be more difficult to upgrade or adapt them compared to commercially available software solutions and they require significant engineering expertise to maintain. We may not invest sufficient resources in, or be able to attract necessary talent to successfully maintain, our information systems.
More than a decade ago, we began our program to deploy a new global ERP system developed by SAP SE. Since then, our business has significantly diversified, and new technologies allow legacy systems and diverse applications to easily be connected in a modular way, which allows these legacy systems to be part of a flexible, powerful and efficient solution. Today, the majority of our distribution business still runs on our legacy mainframe ERP system. We can make no assurances as to whether the modularity of our system construct will continue to operate efficiently or as expected, which could in turn impact our ability to operate or for our
62
Table of Contents
customers or vendors to transact with us normally. In addition, maintaining and supporting disparate ERPs, including the failure of any portion or module thereof, may pose risks to our ability to operate successfully and efficiently within an effective system of internal controls (including appropriate controls over financial reporting), as well as our ability to assess the adequacy of such internal controls.
We can make no assurances that the combined systems strategy will be successful or that we will not have additional disruptions, delays and/or negative business impacts from future deployments.
Disruptions, delays or deficiencies in the design, implementation, performance and maintenance of our various IT systems could adversely and materially affect our ability to effectively run and manage our business, including by potentially limiting our customers ability to access our price and product availability information or place orders. Portions of our IT infrastructure also may experience interruptions, delays or cessations of service or may produce errors in connection with systems integration or migration work that takes place from time to time. We may not be successful in implementing new systems and transitioning data, which could cause business disruptions and be more expensive, time consuming, disruptive and resource-intensive than anticipated. Such disruptions could adversely impact our ability to fulfill orders or to attract and retain customers, and could interrupt other business processes. Moreover, the expenses associated with these initiatives can be difficult to predict, and we may incur substantial additional expenses in excess of what is currently expected, particularly if any of these initiatives is unsuccessful or proves unsustainable, which may require us to incur additional costs. We may also be limited in our ability to integrate any new business that we may acquire into our information systems. If our information systems do not allow us to transmit accurate information, even for a short period of time, to key decision makers, the ability to manage our business could be disrupted and the results of operations and our financial condition could be materially and adversely affected. Failure to properly or adequately address these issues could impact our ability to perform necessary business operations, which could materially and adversely affect our reputation, competitive position, business, results of operations and financial condition.
We may not be able to prevent or timely detect breaches of, or attacks on, our information technology systems.
We rely on the internet for our orders and information exchanges with our suppliers, vendors and customers. The internet in general, and individual websites in particular, have experienced a number of disruptions, slowdowns and security breaches, some of which were caused by organized attacks. If we were to experience a security breakdown, disruption or breach that compromised sensitive information, including personal information, this could materially harm our relationships with our customers, suppliers or associates; impair our order processing; damage our reputation in the industry and with our customers; open us to potential litigation, regulatory inquiry or investigation, enforcement action, and associated costs or other liabilities; or more generally prevent our customers and suppliers from accessing information, which could cause us to lose business. Computer programmers, state and non-state actors and hackers may be able to penetrate our network security and misappropriate or compromise our confidential information or that of third parties stored on our systems, create system disruptions or cause shutdowns. For example, some of our associates have mistakenly clicked on a phishing email that resulted in compromised network credentials or other stolen information. None of these incidents has been material, and as described below, we employ defenses designed to mitigate the risk of these types of events, but we cannot guarantee that these defenses will succeed given the changing tactics and sophistication of tools deployed by threat actors around the world. In addition, ransomware attacks or other forms of cyber extortion present a significant concern as such attacks may impose costs in the form of remediation, post-attack notification obligations or other legal or regulatory requirements, and operational delays and other interruptions to normal business activities. In addition, sophisticated hardware and operating system software and applications that we procure from third parties may contain defects in design or manufacture, including bugs and other problems that could unexpectedly interfere with the operation of the system. For instance, one of our suppliers, SolarWinds, fell victim to one of the largest and most sophisticated supply chain attacks in recent history. This attack, reportedly perpetrated by nation-state actors, infected SolarWinds software that was eventually distributed to more than 30,000 SolarWinds customers, including us. This third-party security incident necessitated us taking additional steps to secure our systems, including by conducting a forensic
63
Table of Contents
investigation and patching relevant software. Though we uncovered no evidence that the SolarWinds attack resulted in any actual compromise of our systems or data, incidents such as this impose costs and may adversely affect our operations.
Cyberattacks, including by state-sponsored actors, continue to become more sophisticated and persistent, and any such attacks which result in a security breach and/or personal data breach may adversely impact our business, or result in regulatory investigation, litigation or other liability.
We deploy data security measures, including physical, technical and administrative safeguards, and contingency plans reasonably designed to mitigate these risks and to satisfy regulatory, contractual and other legal requirements in the United States and other countries as required by our global footprint; however, we cannot assure investors that a breakdown, disruption or breach will not occur in the future. In particular, we have taken steps to address the potential risk presented by ransomware attacks, for instance by standardizing our disaster recovery program and by conducting backup and recovery exercises. Additionally, we conduct industry-standard audits of our data security program and maintain active programmatic data security certifications. The costs of eliminating or alleviating cyberattacks or other information security vulnerabilities, including bugs, viruses, worms and malicious software programs could be significant, and our efforts to address or anticipate these problems may not be successful and could result in interruptions, delays, cessation of service and loss of existing or potential customers and may impede our sales, distribution or other critical functions.
We manage and store proprietary information and sensitive or confidential data relating to our business. In addition, we routinely process, store and transmit large amounts of data for our partners, which may include sensitive information and personal information. Confidential information may also inadvertently be disclosed in connection with our repair and refurbishment and/or our electronic waste disposal services. Breaches of our security measures or the accidental loss, inadvertent disclosure or unapproved dissemination of proprietary information or sensitive or confidential data about us or our customers or vendors, including the potential loss or disclosure of such information or data as a result of fraud, trickery or other forms of deception, could expose us, our customers or vendors, or affected individuals to loss or misuse of this information, result in litigation, regulatory scrutiny and potential liability for us, damage our brand and reputation or otherwise materially harm our business. In addition, the cost and operational consequences of implementing further data protection measures could be significant. Such breaches, costs and consequences could materially and adversely affect our business, results of operations, financial condition and cash flows.
Changes in the regulatory environment regarding privacy and data protection regulations could have a material adverse effect on our results of operations.
We may process personal data (i.e., data relating to a reasonably identifiable natural individual) in relation to our associates, customers, business partners, vendors, suppliers and other third parties, and the collection, use, sharing and protection of personal data is highly regulated in many jurisdictions in which we operate. For example, in the EU and the European Economic Area (the EEA), the GDPR imposes restrictions that, in many respects, are more stringent, and impose more significant burdens on businesses, than many privacy laws, including those in the United States, which are applicable to our business. GDPR is directly applicable in each EU and EEA member state; however, it provides that EU and EEA member states may establish further conditions, limitations and regulations, and these could further limit our ability to collect, process, share, disclose and otherwise use personal data and/or could cause our compliance costs to increase, ultimately having an adverse effect on our business.
GDPR limits the circumstances under which personal data may be transferred out of the EU and EEA to third countries, which may affect our ability to operate with respect to such cross-border transfers. Specifically, under GDPR, personal data may only be transferred out of the EU/EEA to countries that have adequate protections in place, as determined by the European Commission (EC), or subject to a lawful data transfer mechanism, such as the EC-approved Standard Contractual Clauses (SCCs). Where we transfer personal data
64
Table of Contents
out of the EU or EEA to countries without an EC adequacy decision, we seek to comply with the relevant EU data export requirements, including by entering into SCCs. Further, these cross-border data transfer rules and the mechanisms used by companies such as ours are under scrutiny and the ongoing legality of such transfer mechanisms is not certain. That uncertainty increases our compliance costs. For example, despite the adoption of the EU-U.S. Data Privacy Framework to legitimize EU-to-U.S. personal data transfers, there is ongoing litigation challenging both the U.S. adequacy decision and the use of the Standard Contractual Clauses to legitimize transfers of personal data to the United States. If the use of Standard Contractual Clauses in such circumstances is invalidated by the European courts, we may need to renegotiate certain contracts or change certain data processing operations to remain in compliance with GDPR. In the United Kingdom, regulators have implemented their own United Kingdom-specific requirements, such as by requiring parties to use an International Data Transfer Agreement or otherwise amend the EU SCCs when transferring data to countries without adequate protections in place. Switzerland similarly has its own Swiss-specific requirements. These additional requirements increase the costs of negotiating and executing contracts with suppliers, vendors and customers when the United Kingdom, Switzerland or the EU are involved.
We depend on a number of third parties in relation to the operation of our business, a number of which process personal data on our behalf. With each such provider we attempt to mitigate the associated risks of using third parties by entering into contractual arrangements, including data processing agreements, to ensure that providers only process personal data according to our instructions and that they have sufficient technical and organizational security measures in place to protect such data. Where we transfer personal data outside the EEA to such third parties, we do so in compliance with the relevant data export requirements, as described above. However, there is no assurance that these contractual measures and our own privacy and security-related safeguards will protect us from all risks associated with the third-party processing, storage and transmission of such information. Any violation of data privacy or security laws by our third-party processors could have a material adverse effect on our business and result in the fines and penalties outlined below.
We are subject to the supervision of local data protection authorities in those EU and EEA jurisdictions where we are established or otherwise subject to the GDPR. Fines for violation of the GDPR may be significant: up to the greater of 20 million Euros or 4% of total global annual turnover. In addition to the foregoing, a breach of the GDPR could result in regulatory investigations, reputational damage, orders to cease, change our processing of our data, enforcement notices, assessment notices (for a compulsory audit), as well as potential civil claims including class-action type litigation where individuals suffer harm.
We are also subject to evolving EU privacy laws on cookies and e-marketing. Regulators have interpreted GDPR to require opt-in for marketing and the use of cookies, web beacons and similar technologies that are not strictly necessary for the proper functioning of a website or online application. Violations of these requirements are potentially subject to fines at the same levels as the GDPR generally (i.e., the greater of 20 million Euros or 4% of total global annual turnover). We are likely to be required to expend further capital and other resources to ensure compliance as expectations, precedent and guidance from regulators continue to evolve around issues related to tracking technologies and e-marketing.
Other jurisdictions outside the EU and EEA, including several states in the United States and a number of countries around the world, have enacted or are considering enacting comprehensive data privacy and data protection laws, including laws that borrow various concepts from GDPR. For example, in 2020 and 2021, laws went into effect in California, Brazil and China regulating the collection, use and sharing of personal data in those jurisdictions, and new data privacy laws in various states, as well as updates to states existing laws, have since come into effect or will come into effect in the future. These laws, such as the California Consumer Privacy Act, as amended (CCPA), allow for substantial penalties for non-compliance. For example, under the CCPA, in addition to fines that may be imposed by the State Attorney General and/or the California Privacy Protection Agency, consumers themselves have a private right of action against a company for failure to utilize reasonable security procedures that leads to a data breach. In addition, numerous countries, such as China and Russia, have enacted data localization laws that require certain data to stay within their borders and impose significant
65
Table of Contents
penalties for failure to comply. As laws in the jurisdictions in which we operate continue to change, we face additional costs to update our compliance efforts and additional risks related to potential complaints and associated penalties, fines, reputational damage and other costs.
Further, many jurisdictions are considering or have adopted cybersecurity requirements that may apply to our business. For example, in July 2023, the Securities and Exchange Commission (the SEC) adopted new cybersecurity rules for public companies that are subject to the reporting requirements of the Securities Exchange Act of 1934 (as amended, the Exchange Act). Under these new rules, registered companies must disclose a material cybersecurity incident within four business days of managements determination that the incident is material. Companies also must include updated cybersecurity risk management, strategy and governance disclosures, including disclosures regarding managements role in assessing and managing risks from cybersecurity threats. These new rules became effective for companies other than smaller reporting companies on December 18, 2023. Outside the United States, China has implemented, and other jurisdictions may implement, laws that require companies information technology security environments to be certified against certain standards. Such laws may be complex, ambiguous, and subject to varying interpretation, which may create uncertainty regarding compliance.
Finally, we may also face audits or investigations by one or more government agencies and/or customers, business partners and vendors relating to our compliance with these regulations that could result in the imposition of penalties or fines and/or impact our business relationships. We have implemented a compliance program with input from external advisors designed to ensure our compliance with these privacy and data protection obligations; however, we cannot assure that our program will address or mitigate all potential risks of non-compliance. Moreover, the costs of compliance with, and other burdens imposed by, such laws, regulations and policies that are applicable to us may limit the use and adoption of our products and solutions and could have a material adverse effect on our business and results of operations.
Issues in the development and use of AI and ML, combined with an uncertain regulatory environment, may result in reputational harm, liability, risks to our confidential information, proprietary information and personal data, or an adverse effect on our business, results of operations, financial condition and cash flows.
We currently incorporate AI and ML capabilities into our Ingram Micro Xvantage platform, and our goal is to further enhance our competitive position and the experience of our customers and vendors through the use or development of such tools. The complex and rapidly evolving legal and regulatory landscape, including in the countries in which we currently offer Ingram Micro Xvantage the United States, Germany, Canada, the United Kingdom, Mexico, Colombia, Austria, France, Italy, Belgium, the Netherlands, Spain, India and Australia as well as the expectations of consumers, the nature of the AI tools currently in the market, and their use and deployment by our vendors, competitors and other third parties, each present potential risks and challenges.
For instance:
| | Legislators and regulators in the U.S. and elsewhere are increasingly interested in the development, deployment, use, and safety of AI systems. For example, in May 2024, Colorado enacted the first of its kind in the U.S. state-level statute regulating the development and deployment of AI systems. In the EU, the Artificial Intelligence Act entered into force in August 2024. Other jurisdictions, such as California, are considering or have enacted similar legislation and regulation regarding transparency, oversight and governance related to AI. The introduction of AI into new or existing products may result in increased governmental or regulatory scrutiny, and adapting to or complying with new legal requirements may adversely impact our operations or market position; |
| | If we, our vendors, or our third-party partners experience an actual or perceived personal data breach or security incident because of the use of AI, we may lose confidential, sensitive and/or proprietary information, see We may not be able to prevent or timely detect breaches of, or attacks on, our information technology systems; |
| | The intellectual property ownership and license rights, including copyright, as applied to AI technologies has not been fully addressed by U.S. courts or other federal or state laws or regulations, |
66
Table of Contents
| and the use or adoption of third-party AI technologies into our products and services may result in exposure to claims of copyright infringement or other intellectual property misappropriation; |
| | While we aim to use AI ethically and attempt to identify and mitigate ethical issues presented by its use, we may be unsuccessful in identifying or resolving issues before they arise, or the output result may not align with our expectations, or that of our customers, impacting our relationships with customers, partners and suppliers or other unintended results; and |
| | We face significant competition from other companies. If we are unable to incorporate AI capabilities that enhance the functionality and reliability of our products, we may lose market share or be unable to attract or retain customers. |
Any of these outcomes could damage our reputation, result in the loss of valuable property and information, and adversely impact our business, results of operations, financial condition and cash flows.
We may become involved in intellectual property disputes that could cause us to incur substantial costs, divert the efforts of management or require us to pay substantial damages or licensing fees.
As a distributor of products and as a service provider, including of our cloud marketplace technology, from time to time we receive notifications from third parties alleging infringements of intellectual property rights allegedly held by others relating to the products or services we sell. As we continue to expand the products and services we offer and the geographies and channels in which we participate, our potential exposure to disputes related to intellectual property rights infringement increases. Litigation with respect to patents or other intellectual property matters could result in substantial costs and diversion of management and other resources and could have an adverse effect on our operations. Further, we may be obligated to indemnify and defend our customers if the products or services we sell are alleged to infringe any third partys intellectual property rights. While we may be able to seek indemnification and defense from our vendors and suppliers to protect our customers and our company against such claims, there is no assurance that we will be successful in obtaining such indemnification or defense or that we will be fully protected against such claims or that such indemnification and defense rights will be sufficient. We also may be unable to insure against such claims. We may also be prohibited from marketing products or services, be forced to market products or services without desirable features, be forced to pay additional licensing fees to continue to distribute certain products or perform certain services, or incur substantial costs to defend legal actions, including when third parties claim that we or vendors who may or may not have indemnified us are infringing upon their intellectual property rights. The validity, subsistence and enforceability of the intellectual property rights portfolio that we currently hold, develop or acquire may be challenged. We may receive such a challenge from individuals and groups who purchase intellectual property assets for the sole purpose of asserting claims of infringement and attempting to extract settlements from target companies. Even if we believe that such infringement claims are without merit, the claims may be time-consuming and costly to defend and may divert managements attention and resources away from our business. Claims of intellectual property infringement may require us to enter into costly settlements or pay costly damage awards, or face a temporary or permanent injunction prohibiting us from marketing or selling certain products or services, which could affect our ability to compete effectively. If an infringement claim is successful, we may be required to pay damages or seek royalty or license arrangements, which may not be available on commercially reasonable terms.
Risks Related to Our Relationship with Platinum and Being a Controlled Company
After the completion of this offering, we will be a controlled company within the meaning of the NYSE rules and, as a result, we will qualify for, and intend to rely on, exemptions from certain corporate governance requirements. Our stockholders will not have the same protections afforded to stockholders of other companies that are subject to such requirements.
After the completion of this offering, Platinum will continue to hold more than a majority of the voting power of our outstanding Common Stock entitled to vote generally in the election of directors. As a result, we
67
Table of Contents
will be a controlled company within the meaning of the corporate governance standards of the NYSE, and may elect not to comply with certain corporate governance requirements, including the requirements that within one year of the date of the listing of our Common Stock:
| | a majority of the members of our board of directors are independent directors as defined under the rules of the NYSE; |
| | our board of directors has a compensation committee that is composed entirely of independent directors with a written charter addressing the committees purpose and responsibilities; |
| | our director nominations be made, or recommended to the full board of directors, by our independent directors or by a nominations committee that is composed entirely of independent directors and that we adopt a written charter or board resolution addressing the nominations process; and |
| | we complete an annual performance evaluation of our compensation and nominating and corporate governance committees. |
Following this offering, we intend to utilize some of these exemptions. For example, we do not intend to have a majority of independent directors, our compensation and nominating and corporate governance committees may not be composed entirely of independent directors and we may not perform annual performance evaluations with respect to such committees. The independence standards are intended to ensure that directors who meet those standards are free of any conflicting interest that could influence their actions as directors. Accordingly, our stockholders will not have the same protections afforded to stockholders of companies that are subject to all of the corporate governance requirements of the NYSE. In the event that we cease to be a controlled company, we will be required to comply with the above referenced requirements within one year.
In addition, in response to the adoption of Rule 10C-1 under the Exchange Act, by the SEC, the national securities exchanges (including the NYSE) adopted amendments to their existing listing standards to comply with provisions of Rule 10C-1, which require, among other things, that:
| | compensation committees be composed of fully independent directors, as determined pursuant to new and existing independence requirements; |
| | compensation committees be explicitly charged with hiring and overseeing compensation consultants, legal counsel and other committee advisers; and |
| | compensation committees be required to consider, when engaging compensation consultants, legal counsel or other advisers, certain independence factors, including factors that examine the relationship between the consultant or advisers employer and us. |
As a controlled company, we will not be subject to these compensation committee independence requirements.
Platinum controls us, and its interests may conflict with ours or other stockholders in the future.
After the completion of this offering, and assuming an offering of 11,600,000 shares of Common Stock by us and 7,000,000 shares of Common Stock by the selling stockholder, Platinum will continue to control approximately 90.8% of the voting power of our outstanding Common Stock (or 89.6% of the voting power of all of our outstanding shares of Common Stock if the underwriters exercise in full their option to purchase additional shares of Common Stock, solely to cover over-allotments, if any), and thus, in each case, hold more than a majority of the voting power of our outstanding Common Stock entitled to vote generally in the election of directors. Platinum will be able to control the election and removal of our directors and thereby control our policies and operations, including the appointment of management, future issuances of our Common Stock or other securities, payment of dividends, if any, on our Common Stock, the incurrence or modification of indebtedness by us, amendment of our amended and restated certificate of incorporation and amended and restated bylaws and the entering into of extraordinary transactions, and their interests may not in all cases be
68
Table of Contents
aligned with the interests of our other stockholders. This concentration of voting control could deprive stockholders of an opportunity to receive a premium for their shares of Common Stock as part of a sale of our company and ultimately might affect the market price of our Common Stock. This concentration of ownership may also adversely affect our share price.
Moreover, in accordance with our amended and restated certificate of incorporation and the Investor Rights Agreement, Platinum will have the right to nominate for election to our board of directors a number of individuals designated by Platinum constituting a majority thereof for so long as it beneficially owns at least 50% of the voting power of all shares of our outstanding stock entitled to vote generally in the election of our directors. See Certain Relationships and Related Person TransactionsAgreements to Be Entered into in Connection with this OfferingInvestor Rights Agreement and Description of Capital Stock. In the event that Platinum ceases to own shares of our stock representing a majority of the total voting power, for so long as Platinum continues to own a significant percentage of our stock, it will still be able to significantly influence or effectively control the composition of our board of directors and the approval of actions requiring stockholder approval through its voting power. Accordingly, for such period of time, Platinum will have significant influence with respect to our management, business plans and policies, including the appointment and removal of our officers.
Platinum is in the business of making investments in companies and may from time to time acquire and hold interests in businesses that compete directly or indirectly with us or whose interests are otherwise not aligned with ours. Our amended and restated certificate of incorporation will provide that neither Platinum nor any of its affiliates or any director who is not employed by us or his or her affiliates will have any duty to refrain from engaging, directly or indirectly, in the same business activities or similar business activities or lines of business in which we operate. Platinum and its affiliates also may pursue acquisition opportunities that may be complementary to our business and, as a result, those acquisition opportunities may not be available to us.
Anti-takeover provisions in our organizational documents could delay or prevent a change of control.
Certain provisions of our amended and restated certificate of incorporation and amended and restated bylaws may have an anti-takeover effect and may delay, defer or prevent a merger, acquisition, tender offer, takeover attempt or other change of control transaction that a stockholder might consider in its best interest, including those attempts that might result in a premium over the market price for the shares held by our stockholders.
Among other things, these provisions:
| | grant Platinum the right to nominate for election to our board of directors no fewer than that number of directors that would constitute: (a) a majority of the total number of directors so long as the Platinum Stockholder and Platinum collectively beneficially own at least 50% of the then-outstanding capital stock of the Company; (b) 40% of the total number of directors so long as the Platinum Stockholder and Platinum collectively beneficially own at least 40% but less than 50% of the then-outstanding capital stock of the Company; (c) 30% of the total number of directors so long as the Platinum Stockholder and Platinum collectively beneficially own at least 30% but less than 40% of the then-outstanding capital stock of the Company; (d) 20% of the total number of directors so long as the Platinum Stockholder and Platinum collectively beneficially own at least 20% but less than 30% of the then-outstanding capital stock of the Company; and (e) 10% of the total number of directors so long as the Platinum Stockholder and Platinum collectively beneficially own at least 5% but less than 20% of the then-outstanding capital stock of the Company; |
| | permit our board of directors to establish the number of directors and fill vacancies and newly created directorships, subject to the rights granted to Platinum pursuant to our amended and restated certificate of incorporation and the Investor Rights Agreement; |
| | establish a classified board of directors, as a result of which our board of directors will be divided into three classes, with each class serving for staggered three-year terms; |
69
Table of Contents
| | provide for the removal of directors only for cause and only upon the affirmative vote of the holders of at least 66 and 2/3% of the shares of Common Stock entitled to vote generally in the election of directors if Platinum and its affiliates cease to beneficially own at least 50% of shares of Common Stock entitled to vote generally in the election of directors; |
| | provide that at all meetings of our board of directors prior to the date when Platinum ceases to beneficially own at least 30% of the total voting power of all then-outstanding shares of our stock entitled to vote generally in the election of directors, a quorum for the transaction of business shall include at least one director nominated by Platinum; |
| | provide for the ability of our board of directors to issue one or more series of preferred stock, including blank check preferred stock; |
| | designate Delaware as the sole forum for certain litigation against us; |
| | provide for advance notice requirements for nominations of directors by stockholders and for stockholders to include matters to be considered at our annual stockholder meetings; |
| | provide certain limitations on convening special stockholder meetings in the event Platinum beneficially owns less than 50% of the voting power of all outstanding shares of our stock entitled to vote generally in the election of directors; |
| | prohibit cumulative voting in the election of directors; |
| | provide that actions by our stockholders be taken only at an annual or special meeting of our stockholders, and not by written consent, in the event Platinum beneficially owns less than 50% of the voting power of all outstanding shares of our stock entitled to vote generally in the election of directors; |
| | provide (i) that the board of directors is expressly authorized to alter or repeal our amended and restated bylaws and (ii) that our stockholders may only amend our amended and restated bylaws with the approval of 66 and 2/3% or more of all of the outstanding shares of our stock entitled to vote, in the event Platinum beneficially owns less than 50% of the total voting power of all then-outstanding shares of our stock entitled to vote generally in the election of directors; and |
| | provide that certain provisions of our amended and restated certificate of incorporation may be amended only by the affirmative vote of the holders of at least 66 and 2/3% in voting power of the outstanding shares of our stock entitled to vote, in the event Platinum beneficially owns less than 50% of the total voting power of all then-outstanding shares of our stock entitled to vote generally in the election of directors; provided, however, that any such alteration or amendment which would adversely affect the rights of Platinum shall require the prior written consent of Platinum. |
Any provision of our amended and restated certificate of incorporation, amended and restated bylaws or Delaware law that has the effect of delaying, preventing or deterring a change in control could limit the opportunity for our stockholders to receive a premium for their shares of our Common Stock and could also affect the price that some investors are willing to pay for our Common Stock. In addition, our stockholders may be limited in their ability to obtain a premium for their shares. See Description of Capital Stock.
Risks Related to this Offering and Ownership of Our Common Stock
No market currently exists for our Common Stock, and an active, liquid trading market for our Common Stock may not develop, which may cause shares of our Common Stock to trade at a discount from the initial offering price and make it difficult for stockholders to sell the shares of Common Stock they purchase.
Prior to this offering, there has not been a public trading market for shares of our Common Stock. Ingram Micro Inc. ceased being a publicly traded company in 2016. We cannot predict the extent to which investor interest in us will lead to the development of a trading market or how active and liquid that market may become. If an active and liquid trading market does not develop or continue, stockholders may have difficulty selling their
70
Table of Contents
shares of our Common Stock at an attractive price or at all. The initial public offering price per share of Common Stock will be determined by negotiations between us, the selling stockholder and the underwriters, and may not be indicative of the price at which shares of our Common Stock will trade in the public market after this offering. The market price of our Common Stock may decline below the initial offering price, and stockholders may not be able to sell their shares of our Common Stock at or above the price paid in this offering, or at all.
Stockholders will incur immediate and substantial dilution.
We anticipate the initial public offering price per share of our Common Stock will be substantially higher than the as further adjusted net tangible book value (deficit) per share of our Common Stock. Therefore, investors who purchase shares of our Common Stock in this offering will pay a price per share that substantially exceeds our as further adjusted net tangible book value (deficit) per share after this offering. Such investors will experience immediate dilution of $12.92 per share, representing the difference between our as further adjusted net tangible book value (deficit) per share after giving effect to the Offering Reorganization Transactions, this offering and the assumed initial public offering price. Furthermore, such investors may experience additional dilution upon future equity issuances or upon the exercise of options to purchase our Common Stock or vesting of restricted stock units or other stock-based awards granted to our associates, executive officers and directors under the 2024 Plan that we intend to adopt in connection with this offering. See Dilution.
Because our executive officers hold, or in the future may hold, long-term incentive awards that will vest upon a change of control, these officers may have interests in us that conflict with those of our stockholders.
Our executive officers hold, or in the future may hold, long-term incentive awards that would automatically vest upon a change of control. As a result, these officers may view certain change of control transactions more favorably than other stockholders due to the vesting opportunities available to them and, as a result, may have an economic incentive to support a transaction that may not be viewed as favorable by other stockholders.
As a result of becoming a publicly traded company, we will be required to design and maintain adequate internal control over financial reporting. Failure to comply with requirements to design, implement and maintain effective internal control over financial reporting and/or failure to effectively remediate material weaknesses could have a material adverse effect on our business and the price of our Common Stock, and could result in our financial statements becoming unreliable.
As a privately held company, we were not required to evaluate the effectiveness of our internal control over financial reporting in a manner that meets the standards of publicly traded companies required by the rules and regulations of the SEC regarding compliance with Section 404 of the Sarbanes-Oxley Act (Section 404). Upon consummation of this offering, we will become a publicly traded company subject to the rules and regulations established from time to time by the SEC and the NYSE. These rules and regulations will require, among other things, that we establish and periodically evaluate the design and operating effectiveness of our internal control over financial reporting.
Reporting obligations as a publicly traded company will place a considerable strain on our financial and management systems, processes and controls, as well as on our personnel for the foreseeable future. In addition, as a publicly traded company, we will be required to document and test our internal control over financial reporting pursuant to the rules and regulations of the SEC so that our management can report as to the effectiveness of our internal control over financial reporting. Testing and maintaining internal controls may divert our managements attention from other matters that are important to the operation of our business. In addition, when our independent registered public accounting firm is required to undertake an assessment of our internal control over financial reporting, the cost of our compliance with the rules and regulations of the SEC over Section 404 will correspondingly increase. Our compliance with applicable provisions of Section 404 will require that we incur substantial accounting expense and expend significant management time on compliance-related issues as we implement additional corporate governance practices and comply with reporting requirements.
71
Table of Contents
Section 404(a) requires that, beginning with our second annual report filed on Form 10-K following our initial public offering, management assess and report annually on the effectiveness of our internal control over financial reporting and disclose any material weaknesses in our internal control over financial reporting. Section 404(b) requires our independent registered public accounting firm to issue a report that attests to the effectiveness of our internal control over financial reporting as of the end of the fiscal year. We expect our first Section 404(a) assessment will take place for our annual report for the year ending December 27, 2025. We are in the process of evaluating our internal controls to allow management to report on the effectiveness of our internal control over financial reporting. Upon completion of this process, we may identify control deficiencies of varying degrees of severity under applicable SEC rules and regulations that require remediation. As a publicly traded company, we will be required to report, among other things, control deficiencies that constitute a material weakness and changes in internal control over financial reporting that, or that are reasonably likely to, materially affect internal control over financial reporting. A material weakness is a deficiency, or a combination of deficiencies, in internal control over financial reporting, such that there is a reasonable possibility that a material misstatement of our annual or interim financial statements will not be prevented or detected on a timely basis. To comply with the requirements of being a publicly traded company, we have undertaken various actions, and may need to take additional actions, such as implementing and enhancing our internal controls and procedures and hiring additional accounting or internal audit staff. Further, because there are inherent limitations in all control systems, even our remediated and effective internal control over financial reporting may not prevent or detect all material misstatements. Additionally, any projection or the result of any evaluation of effectiveness of these measures in future periods remain subject to the risk that our internal control over financial reporting may become inadequate because of changes in our business condition, changes in accounting rules and regulations, or to the degree our compliance with our internal policies or procedures may deteriorate. If we fail to timely design and maintain the effectiveness of our internal control over financial reporting, we may not be able to produce reliable financial reports and will be less able to detect and prevent material misstatements due to error or fraud.
Additionally, as described in the risk factor directly below, we have identified material weaknesses in our internal control over financial reporting. As we become a publicly traded company and subject to Section 404, we may identify additional material weaknesses.
We have identified material weaknesses in our internal control over financial reporting, which have resulted in restatements and revisions of certain of our consolidated financial statements, which has created additional risks and uncertainties that may have a material adverse effect on our business, financial position and results of operations. If we are unable to remediate these material weaknesses, or if we identify additional material weaknesses in the future or otherwise fail to design and maintain effective internal control over financial reporting, we may not be able to accurately or timely report our financial condition or results of operations, which may adversely affect investor confidence and the price of our Common Stock, or impair our ability to comply with applicable laws and regulations.
During the course of preparing for this offering, we identified a material weakness as we did not design and maintain an effective risk assessment process at a precise enough level to identify risks of material misstatement in the consolidated financial statements related to evolving and growing areas of the business. This material weakness contributed to an additional material weakness around the design and maintenance of effective controls over the identification of and accounting for multi-period software license agreements.
These material weaknesses resulted in immaterial misstatements to the interim and annual consolidated financial statements between 2021 and 2023 and the revision of the 2022 annual consolidated financial statements (balance sheet and the statement of cash flows) and 2023 interim condensed consolidated financial statements (balance sheet and the statement of cash flows) and the restatement of certain interim and annual consolidated financial statements between 2020 and 2023, as a result of errors in the consolidated balance sheets and consolidated statements of cash flows.
72
Table of Contents
Additionally, these material weaknesses could result in further misstatements of the aforementioned accounts and disclosures that would result in a material misstatement to the annual or interim consolidated financial statements that would not be prevented or detected. As a result of these material weaknesses and errors, we have become subject to a number of additional risks and uncertainties and unanticipated costs for accounting, legal and other fees and expenses. We may become subject to legal proceedings as a result of the material weaknesses and errors, which could result in reputational harm, the loss of key employees, additional defense and other costs. Any of the foregoing impacts, individually or in the aggregate, may have a material adverse effect on our business, financial position and results of operations.
We are taking a number of steps to remediate these material weaknesses and to strengthen our internal control over financial reporting. These remediation measures are ongoing, and include strengthening the regional controllership function, revising policies and procedures and implementing additional training to support an effective risk assessment process over evolving and growing areas of the business. The implementation of these remediation measures is in the early stages and will require validation and testing of design and operating effectiveness of internal controls over multiple financial reporting cycles. Implementing the necessary changes to internal controls may involve substantial costs and divert our managements attention from other matters that are important to the operation of our business. At this time, we cannot provide an estimate of costs expected to be incurred in connection with implementing our remediation plan; however, the remediation measures will be time consuming, will result in us incurring significant costs, and will place significant demands on our financial and operational resources.
While we expect to remediate the material weaknesses, we cannot assure investors that these measures will significantly improve or remediate the material weaknesses described above or that we will be able to do so in a timely manner. If the steps we take do not remediate these material weaknesses, or future material weaknesses, in a timely manner, if we identify additional material weaknesses in our internal control over financial reporting, if we are unable to comply with the requirements of the rules and regulations of the SEC over Section 404 in a timely manner, if we are unable to assert that our internal control over financial reporting is effective, that may result in a material misstatement of our annual or interim financial statements that would not be prevented or detected on a timely basis, which, in turn, could jeopardize our ability to comply with our reporting obligations, including those under the Indenture and Credit Agreements which may give rise to a default thereunder restrict our access to the capital markets, cause investors to lose confidence in the accuracy, completeness or reliability of our financial reports and adversely impact the price of our Common Stock. As a result of such failures, we could also become subject to investigations or sanctions by the NYSE, the SEC, or other regulatory authorities, and become subject to litigation from investors and stockholders, which could harm our reputation, financial condition or divert financial and management resources from our core business, and would have a material adverse effect on our business, financial condition and results of operations.
Our stock price may change significantly following this offering, and stockholders may not be able to resell shares of our Common Stock at or above the price paid or at all and could lose all or part of their investment as a result.
We, the selling stockholder and the underwriters will negotiate to determine the initial public offering price. Stockholders may not be able to resell their shares at or above the initial public offering price due to a number of factors such as those listed in Risks Related to Our Business and Our Industry and the following:
| | results of operations that vary from the expectations of securities analysts and investors; |
| | results of operations that vary from those of our competitors compared to market expectations; |
| | changes in expectations as to our future financial performance, including financial estimates and investment recommendations by securities analysts and investors; |
| | changes in market valuations of, or earnings and other announcements by, companies in our industry; |
| | declines in the market prices of stocks generally, particularly those of information technology companies; |
73
Table of Contents
| | departures of key management personnel; |
| | strategic actions by us or our competitors; |
| | announcements by us, our competitors or our vendors of significant contracts, price reductions, new products or technologies, acquisitions, joint marketing relationships, joint ventures, other strategic relationships or capital commitments; |
| | changes in preference of our customers; |
| | changes in general economic or market conditions or trends in our industry or the economy as a whole and, in particular, in the consumer spending environment; |
| | changes in business or regulatory conditions which adversely affect our industry or us; |
| | future issuances, exchanges or sales, or expected issuances, exchanges or sales of our Common Stock or other securities; |
| | investor perceptions of or the investment opportunity associated with our Common Stock relative to other investment alternatives; |
| | investors responses to press releases or other public announcements by us or third parties, including our filings with the SEC; |
| | adverse resolutions relating to new or pending litigation or governmental investigations; |
| | guidance, if any, that we provide to the public, any changes in this guidance or our failure to meet this guidance; |
| | the development and sustainability of an active trading market for our stock; |
| | changes in accounting principles; and |
| | other events or factors, including those resulting from informational technology system failures and disruptions, natural disasters, war, acts of terrorism or responses to these events. |
Furthermore, the stock market may experience extreme volatility that, in some cases, may be unrelated or disproportionate to the operating performance of particular companies. These broad market and industry fluctuations may adversely affect the market price of our Common Stock, regardless of our actual operating performance. In addition, price volatility may be greater if the public float and trading volume of our Common Stock is low.
In the past, following periods of market volatility, stockholders have instituted securities class action litigation. If we were to become involved in securities litigation, it could have a substantial cost and divert resources and the attention of executive management from our business regardless of the outcome of such litigation.
We may change our dividend policy at any time, and, in the event we determine not to pay any cash dividends on our Common Stock in the future, stockholders may not receive any return on investment unless they sell their Common Stock for a price greater than that which they paid for it.
We anticipate paying a quarterly cash dividend on our Common Stock of $0.074 per share beginning in the first quarter of 2025. We anticipate paying aggregate cash dividends of $70 million per annum on our Common Stock, resulting in an annual yield of 1.4% based on a price of $21.50 per share, which is the midpoint of the estimated price range set forth on the cover page of this prospectus. Although we anticipate paying such a quarterly cash dividend, we have no obligation to pay any dividend, and our board of directors may decide to change the dividend policy at any time without notice to the stockholders. Any decision to declare and pay dividends in the future will be, subject to our compliance with applicable law, made at the sole discretion of our board of directors and will depend on, among other things, general and economic conditions, our financial condition and results of operations, our available cash and current and anticipated cash needs, capital
74
Table of Contents
requirements, contractual and tax implications on the payment of dividends by us to our stockholders or by our subsidiaries to us, including restrictions and subject to the covenants under our Credit Facilities, the Indenture and any other future indebtedness or preferred securities we may incur or issue, and such other factors as our board of directors may deem relevant. See Dividend Policy and Description of Material Indebtedness. Future dividends may also be affected by factors that our board of directors deems relevant, including our potential future capital requirements for investments, legal risks, changes in federal and state income tax laws or corporate laws and contractual restrictions such as financial or operating covenants in our debt arrangements. As a result, there can be no assurance that we will pay any future dividends, and it is possible that we may need to reduce or eliminate the payment of dividends on our Common Stock in the future. If we decide to not pay future dividends, then stockholders may not receive any return on an investment in our Common Stock unless they sell our Common Stock for a price greater than the purchase price, which may not occur.
If securities or industry analysts do not publish research or reports about our business or if they downgrade our stock or our sector, our stock price and trading volume could decline.
The trading market for our Common Stock will rely in part on the research and reports that industry or financial analysts publish about us or our business. We do not control these analysts. Furthermore, if one or more of the analysts who do cover us downgrade our stock or our industry, or the stock of any of our competitors, or publish inaccurate or unfavorable research about our business, the price of our stock could decline. If one or more of these analysts stop covering us or fail to publish reports on us regularly, we could lose visibility in the market, which in turn could cause our stock price or trading volume to decline.
We will incur significantly increased costs and become subject to additional regulations and requirements as a result of becoming a publicly traded company, and our management will be required to devote substantial time to new compliance matters, which could lower our profits or make it more difficult to run our business.
As a publicly traded company, we will incur significant legal, regulatory, finance, accounting, investor relations and other expenses that we have not incurred as a privately held company, including costs associated with applicable reporting requirements. As a result of having publicly traded Common Stock, we will also be required to comply with, and incur costs associated with such compliance with, the Sarbanes-Oxley Act and the Dodd-Frank Act, the PCAOB, as well as rules and regulations implemented by the SEC and the NYSE. The expenses incurred by public companies generally for reporting and corporate governance purposes have been increasing. We expect these rules and regulations to increase our legal and financial compliance costs and to make some activities more time-consuming and costly. We anticipate that these costs will materially increase our general and administrative expenses. Our management will need to devote a substantial amount of time to ensure that we comply with all of these requirements, including expanded corporate governance standards, diverting the attention of management away from revenue-producing activities.
In addition, these laws and regulations also could make it more difficult or costly for us to obtain certain types of insurance, including director and officer liability insurance, and we may be forced to accept reduced policy limits and coverage or incur substantially higher costs to obtain the same or similar coverage. These laws and regulations could also make it more difficult for us to attract and retain qualified persons to serve on our board of directors, our board committees or as our executive officers. Furthermore, if we are unable to satisfy our obligations as a publicly traded company, we could be subject to delisting of our Common Stock, fines, sanctions and other regulatory action and potentially civil litigation.
If we or our selling stockholder sell additional shares of our Common Stock after this offering or are perceived by the public markets as intending to sell them, including pursuant to exceptions in contractual lock-up agreements, or the expiration of the Lock-Up Period, and the anticipation of such events, the market price of our Common Stock could decline.
The sale of substantial amounts of shares of our Common Stock in the public market, or the perception that such sales could occur, could harm the prevailing market price of shares of our Common Stock. These sales, or
75
Table of Contents
the possibility that these sales may occur, also might make it more difficult for us to sell shares of our Common Stock in the future at a time and at a price that we deem appropriate. Upon completion of this offering, we will have a total of 235,495,185 shares of our Common Stock outstanding. All of the shares of our Common Stock sold in this offering will be freely tradable without restriction or further registration under the Securities Act of 1933, as amended (the Securities Act), by persons other than our affiliates, as that term is defined under Rule 144 of the Securities Act (Rule 144). See Shares Eligible for Future Sale.
We, all of our directors, executive officers, the selling stockholder and holders of substantially all of the outstanding Common Stock and securities exercisable for or convertible into Common Stock of Ingram Micro Holding Corporation immediately prior to this offering, have entered into lock-up agreements with the underwriters, pursuant to which, all such parties have agreed, subject to certain exceptions, not to sell, dispose of or hedge any shares of our Common Stock or securities convertible into or exchangeable for shares of our Common Stock for 180 days from the date of this prospectus (the Lock-Up Period), except with the prior written consent of any two of Morgan Stanley & Co. LLC, Goldman Sachs & Co. LLC and J.P. Morgan Securities LLC on behalf of the underwriters. See UnderwritingNo Sale of Similar Securities. As a result of the foregoing, substantially all of our outstanding Common Stock and securities directly or indirectly convertible into or exchangeable or exercisable for our Common Stock are subject to a lock-up agreement during the Lock-Up Period.
Upon the expiration of the lock-up agreements at the end of the Lock-Up Period as described above, all of such shares will be eligible for resale in the public market, subject in the case of shares held by our affiliates, to volume, manner of sale and other limitations under Rule 144. We expect that Platinum will continue to be considered an affiliate following the expiration of the Lock-Up Period based on its expected shares of ownership and its board nomination rights. Certain other of our stockholders may also be considered affiliates at that time. However, subject to the expiration or waiver of the Lock-Up Period, certain of the holders of these shares of Common Stock will have the right, subject to certain exceptions and conditions, to require us to register their shares of Common Stock under the Securities Act, and they will have the right to participate in future registrations of securities by us. Registration of any of these outstanding shares of Common Stock would result in such shares becoming freely tradable without compliance with Rule 144 upon effectiveness of the registration statement. See Shares Eligible for Future Sale.
The cornerstone investor has indicated an interest in purchasing up to an aggregate of $70 million in shares of Common Stock in this offering at the initial public offering price. The shares of Common Stock to be purchased by the cornerstone investor will not be subject to a lock-up agreement with the underwriters. Because indications of interest are not binding agreements or commitments to purchase, the cornerstone investor may determine to purchase more, less or no shares in this offering or the underwriters may determine to sell more, less or no shares to the cornerstone investor. If the cornerstone investor is allocated all or a portion of the shares in which they have indicated an interest in this offering, or more, and purchase any such shares, such purchases could reduce the available public float for our shares of Common Stock if the cornerstone investor holds such shares long-term.
We intend to file one or more registration statements on Form S-8 under the Securities Act to register shares of our Common Stock or securities convertible into or exchangeable for shares of our Common Stock issued pursuant to the 2024 Plan that we intend to adopt in connection with this offering. Any such Form S-8 registration statements will automatically become effective upon filing. Accordingly, shares registered under such registration statements will be available for sale in the open market subject to certain Rule 144 limitations applicable to affiliates and the terms of lock-up agreements applicable to those shares. We expect that the initial registration statement on Form S-8 will cover 20,347,826 shares of our Common Stock.
Our board of directors will be authorized to issue and designate shares of our preferred stock in additional series without stockholder approval.
Our amended and restated certificate of incorporation will authorize our board of directors, without the approval of our stockholders, to issue 100,000,000 shares of our preferred stock, subject to limitations prescribed
76
Table of Contents
by applicable law, rules and regulations and the provisions of our amended and restated certificate of incorporation, as shares of preferred stock in series, to establish from time to time the number of shares to be included in each such series and to fix the designation, powers, preferences and rights of the shares of each such series and the qualifications, limitations or restrictions thereof. The powers, preferences and rights of these additional series of preferred stock may be senior to or on parity with our Common Stock, which may reduce its value.
Claims for indemnification by our directors, officers or Platinum Advisors may reduce our available funds to satisfy successful third-party claims against us and may reduce the amount of money available to us.
Our amended and restated certificate of incorporation and amended and restated bylaws will provide that we will indemnify our directors and officers, in each case to the fullest extent permitted by the Delaware General Corporation Law (the DGCL).
In addition, as permitted by Section 145 of the DGCL, our amended and restated bylaws to be effective immediately prior to the completion of this offering and our indemnification agreements that we will enter into prior to the consummation of this offering with our directors and officers provide that:
| | we will indemnify our directors and officers for serving us in those capacities or for serving other business enterprises at our request, to the fullest extent permitted by the DGCL, which provides that a corporation may indemnify such person if such person acted in good faith and in a manner such person reasonably believed to be in or not opposed to our best interests and, with respect to any criminal proceeding, had no reasonable cause to believe such persons conduct was unlawful; |
| | we may, in our discretion, indemnify associates and agents in those circumstances where indemnification is permitted by applicable law; |
| | we are required to advance expenses, as incurred, to our directors and officers in connection with defending a proceeding, except that such directors or officers shall undertake to repay such advances if it is ultimately determined that any such person is not entitled to indemnification; |
| | we will not be obligated pursuant to our amended and restated bylaws to indemnify a person with respect to proceedings initiated by that person against us or our other indemnitees, except with respect to proceedings authorized by our board of directors or brought to enforce a right to indemnification; |
| | the rights conferred in our amended and restated bylaws are not exclusive, and we are authorized to enter into indemnification agreements with our directors, officers, associates and agents and to obtain insurance to indemnify such persons; and |
| | we may not retroactively amend our amended and restated bylaws provisions to reduce our indemnification obligations to directors, officers, associates and agents. |
In addition, the Investor Rights Agreement we expect to enter into in connection with this offering will provide that if we retain Platinum Advisors to provide corporate and advisory services to us, then we will reimburse Platinum Advisors for all third party costs incurred in rendering such services and indemnify Platinum Advisors and its officers, directors, managers, employees, affiliates, agents and other representatives, to the fullest extent permitted by law, against all liabilities, costs and expenses incurred in connection with such services other than if and to the extent that such liabilities, costs and expenses arise as a result of the gross negligence, bad faith, fraud or willful misconduct of Platinum Advisors. See Certain Relationships and Related Person TransactionsAgreements to Be Entered into in Connection with this OfferingInvestor Rights Agreement.
77
Table of Contents
Our amended and restated certificate of incorporation will contain exclusive forum provisions for certain stockholder litigation matters, which would limit our stockholders ability to obtain a favorable judicial forum for disputes with us or our directors, officers, associates or stockholders.
Our amended and restated certificate of incorporation that will be in effect upon completion of this offering will provide, subject to limited exceptions, that unless we consent to the selection of an alternative forum, the Court of Chancery of the State of Delaware shall, to the fullest extent permitted by law, be the sole and exclusive forum for (1) any derivative action or proceeding brought on our behalf, (2) any action asserting a claim of breach of any fiduciary duty owed by, or other wrongdoing by, any of our current or former directors, officers or other associates to us or our stockholders, creditors or other constituents, or a claim of aiding and abetting any such breach of fiduciary duty, (3) any action asserting a claim against us or any of our directors, officers or employees arising pursuant to any provision of the DGCL or our amended and restated certificate of incorporation or our amended and restated bylaws, (4) any action to interpret, apply, enforce or determine the validity of the amended and restated certificate of incorporation, (5) any other action asserting a claim that is governed by the internal affairs doctrine of the State of Delaware or (6) any other action asserting an internal corporate claim, as defined in Section 115 of the DGCL. As described below, this provision will not apply to suits brought to enforce any duty or liability created by the Securities Act or Exchange Act, or rules and regulations thereunder.
To the extent that any such claims may be based upon federal law claims, Section 27 of the Exchange Act creates exclusive federal jurisdiction over all suits brought to enforce any duty or liability created by the Exchange Act or the rules and regulations thereunder. Neither the exclusive forum provision nor the federal forum provision of our amended and restated certificate of incorporation will apply to suits brought to enforce any duty or liability created by the Exchange Act. Accordingly, actions by our stockholders to enforce any duty or liability created by the Exchange Act or the rules and regulations thereunder must be brought in federal court.
Section 22 of the Securities Act creates concurrent jurisdiction for federal and state courts over all suits brought to enforce any duty or liability created by the Securities Act or the rules and regulations thereunder. However, our amended and restated certificate of incorporation, which will become effective immediately prior to the completion of this offering, contains a federal forum provision which provides that unless we consent in writing to the selection of an alternative forum, the federal district courts of the United States of America will be the exclusive forum for the resolution of any complaint asserting a cause of action arising under the Securities Act. Our decision to adopt such a federal forum provision followed a decision by the Supreme Court of the State of Delaware holding that such provisions are facially valid under the DGCL. While there can be no assurances that federal or state courts will follow the holding of the Delaware Supreme Court or determine that our federal forum provision should be enforced in a particular case, application of our federal forum provision means that suits brought by our stockholders to enforce any duty or liability created by the Securities Act must be brought in federal court and cannot be brought in state court.
Any person or entity purchasing or otherwise acquiring any interest in shares of our capital stock shall be deemed to have had notice of and consented to the forum provisions in our amended and restated certificate of incorporation, including the federal forum provision. Additionally, our stockholders cannot waive compliance with the federal securities laws and rules and regulations thereunder. This choice of forum provision may limit a stockholders ability to bring a claim in a judicial forum that it finds favorable for disputes with us or any of our directors, officers, other associates or stockholders which may discourage lawsuits with respect to such claims. Alternatively, if a court were to find the choice of forum provision contained in our amended and restated certificate of incorporation to be inapplicable or unenforceable in an action, we may incur additional costs associated with resolving such action in other jurisdictions, which could harm our business, operating results and financial condition.
78
Table of Contents
LETTER FROM OUR CHIEF EXECUTIVE OFFICER
Ingram MicroPast and Present
On the heels of celebrating Ingram Micros 45th anniversary in July 2024, I cant help but be amazed at the journey weve taken over our nearly five-decade history. Helping people realize the promise of technology has always been our mission: from our founding in 1979 as a small computer products distributor to today where we believe based on our experience in the industry we are able to reach nearly 90% of the global population with technology services and solutions. Over the years, our business has evolved from solely providing IT products to serving as an integral link in the technology lifecycle and an aggregator solving for business outcomes. I believe no other company delivers as broad or as deep of a spectrum of services to the worlds leading global technology brands.
Throughout my 25-year career with our organization, I have witnessed many changes in the IT industry that have shaped both our professional and personal lives and I expect the rate of change to continue to accelerate over the coming decades. I am honored to lead this phenomenal organization to further our strategic initiatives to remove complexity from technology consumption while continuing to strengthen our position as an integral partner helping to power the brands we serve.
Our unwavering commitment to customer experience, coupled with our broad geographic reach and extensive portfolio of products and services, has positioned us as an innovative leader within the technology ecosystem. Our reach extends across six continents, close to 200 countries and is supported by our approximately 24,150 associates, innovative digital technologists, experienced engineers, and creative go-to-market professionals. Our partners encompass some of the worlds leading technology companies, including Advanced Micro Devices, Apple, Cisco, Dell Technologies, Hewlett Packard Enterprise, HP Inc., Lenovo, Microsoft, NVIDIA and Super Micro Computer and our solutions are trusted by more than 161,000 customers. Weve also created unique services that pave the path for emerging technology brands around the world, many of whom are poised to become the technology leaders of tomorrow.
Our Core Values
Our commitment to a shared set of principles is the foundation of our past achievements and essential to our present and future success.
| | Results. We deliver successful business outcomes and an excellent experience for our business partners, ourselves and our teams. |
| | Courage. We embrace change and are willing to make difficult decisions that deliver better results to our customers, vendors and fellow associates. |
| | Integrity. We strive to exemplify the highest ethical standards, led by honesty, fairness and dignity in each and every action we take. |
| | Responsibility. We say what we do and we do what we say. We are responsible for our individual and team actions, meet our customer and financial commitments and recognize our social, community and environmental responsibilities. |
| | Imagination. We believe that creativity, agility and resourcefulness reinforce a competitive, entrepreneurial spirit. There is no substitute for the constant desire to be better and achieve more. |
| | Talent. We are committed to learning, collaborating, inventing and always maintaining transparency. Our people and their diverse talents define us. Attracting, inspiring, retaining and celebrating our best individuals is the foundation of our success. |
Where We Are Headed
As we prepare to go public yet again, 28 years after our initial debut on the New York Stock Exchange, I am excited by the opportunities that lie ahead for our partners and our company. We continue to put our customers
79
Table of Contents
and partners in the middle of everything we do, listening and responding to their need to simplify and automate the delivery of next generation technology solutions. We continue to evolve to enable partners to make better informed business decisions, generate more customer demand and develop new product offerings. We are digitizing the technology value chain and changing the way technology is distributed and demand is generated.
Join Us
The approximately $3.1 trillion global information technology industry forever changed during the global pandemic. The unprecedented complications brought forth by the pandemic underscored the critical need for robust, innovative IT solutions, and decades of anticipated digital transformation investments were accelerated to help soothe a world in crisis. As a vital link in the IT channel, connecting our customers with crucial technology from our vendors, we have continued to invest in our own digital transformation to make these interactions as seamless as possible. We understand that to stay at the forefront of the IT distribution industry, we must anticipate and prepare for the next refresh cycle, enabling our customers to procure the innovative technologies that will allow them to meet the evolving demands of the market. The evolving geopolitical landscape and the revolutionary impact of AI and other emerging technologies across a wide array of industries have presented new opportunities, as well as challenges, for us and our partners, and Ingram Micros resilience and commitment to delivering best-in-class experiences remain unchanged. Ive been humbled by the character, commitment, and vitality of our associates, and I have never been prouder to be a part of this fantastic organization!
I hope you will join us for the next chapter of our journey.
Respectfully,
Paul Bay, Chief Executive Officer
80
Table of Contents
CAUTIONARY NOTE REGARDING FORWARD-LOOKING STATEMENTS
Certain matters we discuss in this prospectus may constitute forward-looking statements. You can identify forward-looking statements because they contain words such as believes, expects, may, will, should, seeks, intends, plans, estimates, or anticipates, or similar expressions which concern our strategy, plans, projections or intentions. These forward-looking statements are included throughout this prospectus, including in the sections entitled Summary, Risk Factors, Managements Discussion and Analysis of Financial Condition and Results of Operations and Business, and relate to matters such as our industry, growth strategy, goals and expectations concerning our market position, future operations, margins, profitability, capital expenditures, liquidity and capital resources and other financial and operating information. By their nature, forward-looking statements: speak only as of the date they are made; are not statements of historical fact or guarantees of future performance; and are subject to risks, uncertainties, assumptions or changes in circumstances that are difficult to predict or quantify. Our expectations, beliefs and projections are expressed in good faith and we believe there is a reasonable basis for them. However, there can be no assurance that managements expectations, beliefs and projections will result or be achieved and actual results may vary materially from what is expressed in or indicated by the forward-looking statements.
There are a number of risks, uncertainties and other important factors that could cause our actual results to differ materially from the forward-looking statements contained in this prospectus. Such risks, uncertainties and other important factors include, among others, the risks, uncertainties and factors set forth above under Risk Factors, and the following:
| | general economic conditions; |
| | our estimates of the size of the markets for our products and services; |
| | our ability to identify and integrate acquisitions and technologies into our platform; |
| | our plans to continue to expand; |
| | the provision of transition services to the buyer in the CLS Sale and our ability to adjust our cost base as those transition service agreements expire; |
| | our ability to continue to successfully develop and deploy Ingram Micro Xvantage; |
| | the effect of the COVID-19 pandemic on our business; |
| | our ability to retain and recruit key personnel; |
| | the competition our products and services face and our ability to adapt to industry changes, including supply constraints for many categories of technology; |
| | current and potential litigation involving us; |
| | the global nature of our business, including the various laws and regulations applicable to us; |
| | the effect of various political, geo-political and economic issues and our ability to comply with laws and regulations we are subject to, both in the United States and internationally; |
| | various environmental, social and governance initiatives; |
| | our financing efforts; |
| | our relationships with our customers, OEMs and suppliers; |
| | our ability to maintain and protect our intellectual property; |
| | the performance and security of our services, including information processing and cybersecurity provided by third parties; |
| | our ownership structure; |
81
Table of Contents
| | our dependence upon Ingram Micro Inc. and its controlled subsidiaries for our results of operations, cash flows and distributions; |
| | our status as a controlled company and the extent to which Platinums interests following this offering conflict with our or your interests; and |
| | the incurrence of substantial costs in connection with this offering. |
82
Table of Contents
We estimate that the net proceeds that we will receive from the sale of 11,600,000 shares of Common Stock that we are selling in this offering will be approximately $227.6 million at an assumed initial public offering price of $21.50 per share (the midpoint of the estimated price range set forth on the cover of this prospectus), after deducting the estimated underwriting discounts and commissions and estimated offering expenses payable by us. We will not receive any proceeds from the sale of the shares of our Common Stock in this offering by the selling stockholder.
We estimate that the net proceeds to the selling stockholder from this offering will be approximately $142.2 million or, if the underwriters exercise in full their option to purchase additional shares of Common Stock as described herein, approximately $198.9 million, in each case, assuming an initial public offering price of $21.50 per share (the midpoint of the estimated price range set forth on the cover page of this prospectus), and after deducting the underwriting discounts and commissions and estimated offering expenses payable by us. We will not receive any proceeds from the sale of shares by the selling stockholder, including pursuant to any exercise by the underwriters of their option to purchase additional shares of our Common Stock from the selling stockholder as described herein, but we will be required to pay the underwriting discounts and commissions associated with such sales of shares. See Underwriting.
Each $1.00 increase (decrease) in the assumed initial public offering price of $21.50 per share (the midpoint of the estimated price range set forth on the cover of this prospectus) would increase (decrease) the net proceeds to us from this offering, after deducting the estimated underwriting discounts and commissions and estimated offering expenses payable by us, by approximately $11.0 million, assuming that the number of shares offered by us, as set forth on the cover page of this prospectus, remains the same. We may also increase or decrease the number of shares we are offering. Each increase (decrease) of one million shares in the number of shares sold in this offering by us, as set forth of the cover page of this prospectus, would increase (decrease) the net proceeds to us from this offering by approximately $20.3 million, after deducting the estimated underwriting discounts and commissions and estimated offering expenses payable by us, assuming that the number of shares offered by us, as set forth on the cover page of this prospectus, remains the same. We do not expect that a change in the offering price or the number of shares by these amounts would have a material effect on our intended uses of the net proceeds from this offering.
We intend to use our net proceeds from this offering to repay approximately $227.6 million of outstanding indebtedness under the Term Loan Credit Facility.
Following the 2024 Refinancing, as of September 20, 2024, $1,160 million was outstanding under the Term Loan Credit Facility. The interest rate applicable to borrowings under our term loans will be, at our option, either (1) the base rate (which is the highest of (x) the then current federal funds rate set by the Federal Reserve Bank of New York, plus 0.50%, (y) the prime rate on such day and (z) the one-month SOFR rate published on such date plus 1.00%) plus an applicable margin or (2) one-, three- or six-month SOFR plus an applicable margin. The Term Loan Credit Facility matures on September 19, 2031.
JPMorgan Chase Bank, N.A., an affiliate of J.P. Morgan Securities LLC, an underwriter of this offering, is a lender and joint lead arranger and bookrunner under the Term Loan Credit Facility. On or about October 1, 2024, JPMorgan Chase Bank, N.A. held approximately $51.0 million of term loans outstanding under the Term Loan Credit Facility (which is approximately 4.40% of the outstanding borrowings thereunder). Jefferies Finance LLC, an affiliate of Jefferies LLC, an underwriter of this offering, is a lender under the Term Loan Credit Facility. On or about October 1, 2024, Jefferies Finance LLC held approximately $6.3 million of term loans outstanding under the Term Loan Credit Facility (which is approximately 0.54% of the outstanding borrowings thereunder). Raymond James Bank, an affiliate of Raymond James & Associates, Inc., an underwriter of this offering, is a lender under the Term Loan Credit Facility. On or about October 1, 2024, Raymond James Bank held approximately $25.0 million of term loans outstanding under the Term Loan Credit Facility (which is approximately 2.16% of the outstanding borrowings thereunder). Stifel Bank & Trust, an affiliate of Stifel, Nicolaus & Company, Incorporated, an underwriter of this offering, is a lender and joint lead arranger and bookrunner under the Term Loan Credit Facility. On or about
83
Table of Contents
October 1, 2024, Stifel Bank & Trust held approximately $7.90 million of term loans outstanding under the Term Loan Credit Facility (which is approximately 0.68% of the outstanding borrowings thereunder). As a result of the foregoing, in the event we repay a portion of the outstanding borrowings under the Term Loan Credit Facility with the net proceeds of this offering, then neither J.P. Morgan Securities LLC, Jefferies LLC, Raymond James & Associates, Inc., Stifel, Nicolaus & Company, Incorporated, nor any of the other underwriters will have a conflict of interest with us within the meaning of Rule 5121, as administered by FINRA, as none of the underwriters are expected to receive more than 5% of the proceeds of this offering. See Description of Material Indebtedness and Underwriting.
84
Table of Contents
We anticipate paying a quarterly cash dividend on our Common Stock of $0.074 per share beginning in the first quarter of 2025. We anticipate paying aggregate cash dividends of $70 million per annum on our Common Stock, resulting in an annual yield of 1.4% based on a price of $21.50 per share, which is the midpoint of the estimated price range set forth on the cover page of this prospectus. The declaration, amount and payment of any future dividends on our Common Stock will be, subject to compliance with applicable law, at the sole discretion of our board of directors. Our board of directors may take into account, among other things, general and economic conditions, our financial condition and results of operations, our available cash and current and anticipated cash needs, capital requirements, contractual and tax implications on the payment of dividends by us to our stockholders or by our subsidiaries to us, including restrictions under our Credit Facilities, the Indenture governing the 2029 Notes and other indebtedness or preferred securities we may incur or issue and such other factors as our board of directors may deem relevant. If we elect to pay such dividends in the future, we may reduce or discontinue entirely the payment of such dividends at any time.
Ingram Micro Holding Corporation is a holding company with no material assets other than indirect ownership of the stock of Ingram Micro Inc., and its operations are conducted through its wholly owned subsidiaries. Our operating subsidiaries are currently subject to certain restrictions and covenants under the Credit Agreements and the Indenture. Our ability to pay cash dividends will depend on the payment of distributions by our current and future subsidiaries, including Ingram Micro Inc., and such distributions may be restricted as a result of contractual agreements, including any future agreements governing their indebtedness. See Risk FactorsRisks Related to Our Business and Our IndustryWe are a holding company. Our sole material asset after completion of this offering will be our equity interest in Ingram Micro Inc. and, as such, we will depend on our subsidiaries for cash to fund all of our expenses. These restrictions and covenants may restrict the ability of those entities to make distributions to Ingram Micro Holding Corporation. See Description of Material Indebtedness and Risk FactorsRisks Related to Our IndebtednessThe Indenture and the Credit Agreements contain a number of restrictive covenants that impose significant operating and financial restrictions on us and limit our ability to engage in acts that may be in our long-term best interest, including restrictions on our ability and the ability of our subsidiaries to...: Any additional financing arrangement we enter into in the future may include restrictive covenants that limit our subsidiaries ability to pay dividends to us. In addition, Delaware law may impose requirements that may restrict our ability to pay dividends to holders of our Common Stock.
85
Table of Contents
The following table sets forth our cash, cash equivalents and capitalization as of June 29, 2024:
| | on an actual basis; |
| | on an as adjusted basis to give effect to the effectiveness of our amended and restated certificate of incorporation and stock conversion, each of which will occur prior to the consummation of this offering; and |
| | on an as further adjusted basis to give effect to (i) the sale by us of 11,600,000 shares of Common Stock in this offering at an assumed initial public offering price of $21.50 per share (the midpoint of the estimated price range set forth on the cover of this prospectus) and (ii) the application of the net proceeds to be received by us as described in Use of Proceeds. |
The as further adjusted information set forth in the table below is illustrative only and will be adjusted based on the actual public offering price and other terms of this offering determined at pricing. You should read this capitalization table together with the information contained in Use of Proceeds, Managements Discussion and Analysis of Financial Condition and Results of Operations and Description of Material Indebtedness, as well as our audited consolidated financial statements and related notes and our unaudited pro forma condensed combined financial statements and related notes, each included elsewhere in this prospectus.
| As of June 29, 2024 | ||||||||||||
| ($ in thousands, except par value and share data) |
Actual | As Adjusted | As Further Adjusted(1) |
|||||||||
| Cash and cash equivalents |
$ | 928,762 | $ | 928,762 | $ | 928,762 | ||||||
|
|
|
|
|
|
|
|||||||
| Debt: |
||||||||||||
| ABL Revolving Credit Facility (2) |
$ | | $ | | $ | | ||||||
| Term Loan Credit Facility (3) |
1,216,789 | 1,216,789 | 996,965 | |||||||||
| 2029 Notes |
1,966,259 | 1,966,259 | 1,966,259 | |||||||||
| Other Indebtedness |
446,482 | 446,482 | 446,482 | |||||||||
| Total debt |
3,629,530 | 3,629,530 | 3,409,706 | |||||||||
|
|
|
|
|
|
|
|||||||
| Stockholders equity (4) |
||||||||||||
| Class A voting common stock, par value $0.01, 30,000 shares authorized, 26,382 shares issued and outstanding; and no shares authorized, issued and outstanding, as adjusted and as further adjusted |
| | | |||||||||
| Class B non-voting common stock, par value $0.01, 300 shares authorized, 198 shares issued and outstanding; and no shares authorized, issued and outstanding, as adjusted and as further adjusted |
| | | |||||||||
| Common Stock, no shares authorized, issued and outstanding, actual; par value $0.01, 222,400,000 shares issued and outstanding, as adjusted; and par value $0.01, 235,495,185 shares issued and outstanding, as further adjusted (5) |
| | 130 | |||||||||
| Additional paid-in capital |
2,658,000 | 2,658,000 | 2,915,646 | |||||||||
| Retained earnings |
1,177,314 | 1,177,314 | 1,144,690 | (6) | ||||||||
| Accumulated and other comprehensive loss |
(371,609 | ) | (371,609 | ) | (371,609 | ) | ||||||
|
|
|
|
|
|
|
|||||||
| Total stockholders equity |
3,463,705 | 3,463,705 | 3,688,857 | |||||||||
|
|
|
|
|
|
|
|||||||
| Total capitalization |
$ | 7,093,235 | $ | 7,093,235 | $ | 7,098,563 | ||||||
|
|
|
|
|
|
|
|||||||
86
Table of Contents
| (1) | Each $1.00 increase (decrease) in the assumed initial public offering price of $21.50 per share (the midpoint of the estimated price range set forth on the cover of this prospectus) would increase (decrease) the net proceeds we receive in this offering and each of cash and cash equivalents, additional paid-in-capital, total stockholders equity and total capitalization by approximately $11.0 million, after deducting the estimated underwriting discounts and commissions and estimated offering expenses payable by us, assuming that the number of shares offered by us, as set forth on the cover page of this prospectus, remains the same. Similarly, each increase (decrease) of one million shares in the number of shares sold in this offering by us, as set forth on the cover page of this prospectus, would increase (decrease) our net proceeds from this offering and each of cash and cash equivalents, additional paid-in-capital, total stockholders equity and total capitalization by approximately $20.3 million, after deducting the estimated underwriting discounts and commissions and estimated offering expenses payable by us with respect to an offering of shares of Common Stock by us and the selling stockholder. |
| (2) | As of June 29, 2024, the ABL Revolving Credit Facility had a full committed capacity of $3,500 million and availability thereunder of $3,500 million. As of September 28, 2024, the ABL Revolving Credit Facility had an availability of $3,379 million. |
| (3) | Following the completion of this offering and after giving effect to the 2024 Refinancing, we will have approximately $932.4 million in principal amount outstanding under the Term Loan Credit Facility. For additional information on the 2024 Refinancing, please see SummaryRecent Developments2024 Refinancing. |
| (4) | Stockholders equity on an as further adjusted basis gives effect to this offering of shares of our Common Stock as contemplated by this prospectus, includes stock-based compensation expense of $30.1 million associated with the Initial Grants reflected as an increase to additional paid-in capital and retained earnings and does not give effect to any exercise of the underwriters option to purchase additional shares of Common Stock (solely to cover over-allotments, if any) from the selling stockholder for 30 days following the date of this prospectus. |
| (5) | As further adjusted shares include the Monié Grant. |
| (6) | Primarily reflects stock-based compensation expense of $30.1 million associated with the Initial Grants. |
The above discussion and table are based on 235,495,185 shares of our Common Stock outstanding as of June 29, 2024 and exclude the following:
| | Except as explained below, 20,347,826 shares of Common Stock reserved for issuance under the 2024 Plan which we intend to adopt in connection with this offering. The discussion and table reflect (i) the Initial Grants and (ii) the Monié Grant. See Executive CompensationCompensation Discussion and Analysis2024 Stock Incentive Plan. The shares reserved for future issuance under the 2024 Plan include 5,098,828 shares of Common Stock (based on an assumed initial public offering price of $21.50 per share, which is the midpoint of the estimated offering price range set forth on the cover page of this prospectus) issuable upon the vesting of time and performance vesting restricted stock units which we intend to grant in connection with this offering (of which, the Initial Grants and Monié Grant will vest on the first trading day following the effective date of this registration statement and the remaining time vesting restricted stock units will vest over a multi-year period subject to the award holders continuous service with us, or, if earlier, upon the achievement of specified returns on invested capital by Platinum). Any increase or decrease in the actual initial public offering price will impact the number of shares underlying the Initial Grants and Monié Grant. |
| | No exercise of the underwriters option to purchase up to 2,790,000 additional shares of Common Stock (solely to cover over-allotments, if any) from the selling stockholder. |
87
Table of Contents
If you purchase any of the shares offered by this prospectus, you will experience dilution to the extent the offering price paid by purchasers of our Common Stock in this offering will exceed the as further adjusted net tangible book value (deficit) per share of our Common Stock upon completion of this offering.
As of June 29, 2024, we had an as adjusted net tangible book value (deficit) of $1,794.5 million, or $8.07 per share of Common Stock. As adjusted net tangible book value (deficit) is equal to total tangible assets less total liabilities, which is not included within stockholders equity, after giving effect to the effectiveness of our amended and restated certificate of incorporation and stock conversion, each of which will occur prior to the consummation of this offering, assuming such transactions had taken place on June 29, 2024. As adjusted net tangible book value (deficit) per share is determined by dividing our net tangible book value (deficit) by the aggregate number of shares of our Common Stock outstanding, after giving effect to the adjustment described above.
After giving further effect to our sale of shares of Common Stock in this offering at an assumed initial public offering price of $21.50 per share (the midpoint of the estimated price range set forth on the cover page of this prospectus) and the use of proceeds therefrom as described in Use of Proceeds, after deducting the underwriting discounts and estimated offering expenses payable by us, our as further adjusted net tangible book value (deficit) as of June 29, 2024 would have been $2,019.6 million, or $8.58 per share of Common Stock. This represents an immediate increase in as further adjusted net tangible book value (deficit) of $0.51 per share to our existing stockholders and an immediate dilution of $12.92 per share to new investors purchasing shares of Common Stock in this offering.
The following table illustrates this dilution on a per share basis:
| Assumed initial public offering price per share of Common Stock |
$ | 21.50 | ||||||
| As adjusted net tangible book value (deficit) per share as of June 29, 2024 |
$ | 8.07 | ||||||
| Increase in as further adjusted net tangible book value (deficit) per share of Common Stock attributable to investors in this offering and the use of proceeds from this offering |
$ | 0.51 | ||||||
|
|
|
|||||||
| As further adjusted net tangible book value (deficit) per share of Common Stock after giving effect to this offering |
$ | 8.58 | ||||||
|
|
|
|||||||
| Dilution per share of Common Stock to new investors in this offering |
$ | 12.92 | ||||||
|
|
|
Each $1.00 increase (decrease) in the assumed initial public offering price of $21.50 per share (the midpoint of the estimated price range set forth on the cover of this prospectus) would increase (decrease) our as further adjusted net tangible book value (deficit) by approximately $11.0 million, or approximately $0.05 per share, and the dilution per common share to new investors in this offering by approximately $0.95 per share, assuming that the number of shares offered by us, as set forth on the cover page of this prospectus, remains the same, and after deducting the estimated underwriting discounts and commissions and estimated offering expenses payable by us. We may also increase or decrease the number of shares we are offering. An increase (decrease) of one million shares in the number of shares of Common Stock offered by us, as set forth on the cover page of this prospectus, would increase (decrease) the as further adjusted net tangible book value (deficit) per share by approximately $0.05 and decrease (increase) the dilution per share to new investors by approximately $0.05, after deducting the estimated underwriting discounts and commissions and estimated offering expenses payable by us.
88
Table of Contents
The following table summarizes, as of June 29, 2024, on the same as adjusted basis, the number of shares of Common Stock purchased from us, the total consideration paid to us and the average price per share of Common Stock paid by existing stockholders or to be paid by new investors purchasing shares of Common Stock in this offering:
| Shares Purchased | Total Consideration | Average Price | ||||||||||||||||||
| Number | Percent | Amount | Percent | Per Share | ||||||||||||||||
| Existing owners |
223,895,185 | 95.1 | % | $ | 8,314,012,000 | 97.1 | % | $ | 37.13 | |||||||||||
| New investors in this offering |
11,600,000 | 4.9 | % | $ | 249,400,000 | 2.9 | % | $ | 21.50 | |||||||||||
|
|
|
|
|
|
|
|
|
|
|
|||||||||||
| Total |
235,495,185 | 100 | % | $ | 8,563,412,000 | 100 | % | $ | 36.36 | |||||||||||
|
|
|
|
|
|
|
|
|
|
|
|||||||||||
The sale by the selling stockholder in this offering will reduce the number of shares of Common Stock held by existing stockholders to 216,895,185, or approximately 92.1% of the total shares of Common Stock outstanding after this offering, which will increase the number of shares of Common Stock held by new investors to 18,600,000, or approximately 7.9% of the total shares of Common Stock outstanding after this offering.
If the underwriters exercise their option to purchase additional shares of Common Stock (solely to cover over-allotments, if any) from the selling stockholder in full, the number of shares of our Common Stock held by our existing stockholders would be reduced to 214,105,185, or approximately 90.9% of the total shares of Common Stock outstanding after this offering, which would increase the number of shares held by new investors to 21,390,000, or approximately 9.1% of the total shares of Common Stock outstanding after this offering.
The outstanding share information above is based on 235,495,185 shares of Common Stock outstanding as of June 29, 2024 and excludes:
| | Except as explained below, 20,347,826 shares of Common Stock reserved for issuance under the 2024 Plan which we intend to adopt in connection with this offering. The discussion and table reflect (i) the Initial Grants and (ii) the Monié Grant. See Executive CompensationCompensation Discussion and Analysis2024 Stock Incentive Plan. The shares reserved for future issuance under the 2024 Plan include 5,098,828 shares of Common Stock (based on an assumed initial public offering price of $21.50 per share, which is the midpoint of the estimated offering price range set forth on the cover page of this prospectus) issuable upon the vesting of time and performance vesting restricted stock units which we intend to grant in connection with this offering (of which, the Initial Grants and Monié Grant will vest on the first trading day following the effective date of this registration statement and the remaining time vesting restricted stock units will vest over a multi-year period subject to the award holders continuous service with us, or, if earlier, upon the achievement of specified returns on invested capital by Platinum). Any increase or decrease in the actual initial public offering price will impact the number of shares underlying the Initial Grants and Monié Grant. |
89
Table of Contents
UNAUDITED PRO FORMA CONDENSED COMBINED STATEMENT OF INCOME
Platinum formed Ingram Micro Holding Corporation (formerly known as Imola Holding Corporation) on September 28, 2020, and on December 9, 2020, Imola Acquisition Corporation, an investment vehicle of certain private investment funds sponsored and ultimately controlled by Platinum, Tianjin Tianhai Logistics Investment Management Co., Ltd., HNA Technology Co., Ltd. (HNA Tech), a part of HNA Group, GCL Investment Management, Inc., Ingram Micro, and Imola Merger Corporation (Escrow Issuer) entered into an agreement pursuant to which Platinum indirectly acquired (through Imola Acquisition Corporation) Ingram Micro from affiliates of HNA Tech, for aggregate cash consideration of approximately $7.2 billion, net of any indebtedness acquired (the Acquisition Agreement). The acquisition closed on July 2, 2021 (the Acquisition Closing Date). To fund a portion of the consideration for the acquisition, Platinum contributed certain amounts in cash to an indirect parent of Ingram Micro in exchange for the issuance to Platinum of equity in such parent entity in connection with the acquisition (the Equity Contribution). Concurrently with the Equity Contribution and to finance the remaining portion of the consideration for the acquisition, Ingram Micro entered into the following:
| | the ABL Credit Facilities, consisting of a $500 million ABL Term Loan Facility and a $3,500 million ABL Revolving Credit Facility; |
| | the $2,000 million Term Loan Credit Facility; and |
| | the $2,000 million 2029 Notes. |
In connection with the acquisition, Ingram Micro repaid in full, or satisfied and discharged in full, the obligations under any governing instruments, as applicable, of the then existing indebtedness of the Company and its subsidiaries, except for certain additional lines of credit, short-term overdraft facilities and other credit facilities with approximately $179.4 million outstanding as of June 29, 2024, and entered into the agreements governing its current indebtedness as described above (the Financing Transactions). See Description of Material Indebtedness.
As part of the acquisition, Imola Merger Corporation merged with and into GCL Investment Management Inc., an affiliate of HNA Tech, which immediately thereafter merged with and into GCL Investment Holdings, Inc., which subsequently and immediately then merged with and into Ingram Micro, with Ingram Micro as the surviving entity (collectively, and together with the closing of the transactions contemplated by the Acquisition Agreement, the Equity Contribution and the Financing Transactions related to the acquisition, the Imola Mergers).
The Company has a fiscal year of a 52- or 53-week period ending on the Saturday nearest to December 31. This unaudited pro forma condensed combined financial information of the Company includes the unaudited pro forma condensed combined income statement data for the fiscal year ended January 1, 2022, with the related explanatory notes thereto (the Unaudited Pro Forma Condensed Combined Statement of Income) and reflects the Imola Mergers as if all such transactions occurred on January 3, 2021.
The unaudited pro forma condensed combined statement of income for the fiscal year ended January 1, 2022 was derived from the audited statements of income and accompanying notes for the Predecessor 2021 Period from January 3, 2021 to July 2, 2021 and the Successor 2021 Period from July 3, 2021 to January 1, 2022. The Company had immaterial operations from January 3, 2021 to July 2, 2021, the date of the Imola Mergers. The unaudited pro forma condensed combined financial information was prepared in accordance with Article 11 of Regulation S-X under the Securities Act. The Company has elected not to present managements adjustments and will only be presenting transaction accounting adjustments in the following unaudited pro forma condensed combined statement of income. The detailed assumptions used to prepare the unaudited pro forma condensed combined statement of income are contained in the notes hereto and such assumptions should be reviewed in their entirety.
90
Table of Contents
For the purpose of discussing our financial results, (i) we refer to ourselves (Ingram Micro Holding Corporation) as the Successor in the periods following the Imola Mergers and the Predecessor (Ingram Micro Inc.) during the periods preceding the Imola Mergers and (ii) we refer to the period from January 3, 2021 to July 2, 2021 as the Predecessor 2021 Period and the period from July 3, 2021 to January 1, 2022 as the Successor 2021 Period. The financial information of the Company has been separated by a vertical line on the face of the consolidated financial statements to distinguish the Successor and Predecessor periods. See Note 1, Organization and Basis of Presentation, to our audited consolidated financial statements.
An unaudited pro forma condensed combined balance sheet as of January 1, 2022 is not presented because the Successor 2021 Period consolidated balance sheet, including acquisition-related adjustments, has already been included in our historical balance sheet as of January 1, 2022, which is included elsewhere in this prospectus.
The unaudited pro forma condensed combined statement of income has been prepared for illustrative purposes only and does not purport to reflect the results the combined company may achieve in future periods or results of operations that actually would have been realized had we completed the Imola Mergers on January 3, 2021.
91
Table of Contents
The unaudited pro forma condensed combined statement of income should be read in conjunction with our historical audited consolidated financial statements and the accompanying notes included elsewhere in this prospectus, as well as the financial and other information appearing elsewhere in this prospectus, including information contained in the sections titled Risk Factors, Use of Proceeds, Capitalization, and Managements Discussion and Analysis of Financial Condition and Results of Operations.
| Predecessor | Successor |
Transaction Accounting Adjustments for the Imola Mergers |
Financing Transaction Accounting Adjustments for the Imola Mergers |
Unaudited Pro Forma Combined 2021 Period Fiscal Year Ended January 1, 2022 |
||||||||||||||||||||||||||||
| Predecessor 2021 Period |
Successor 2021 Period |
|||||||||||||||||||||||||||||||
| Period from January 3, 2021 to July 2, 2021 |
Period from July 3, 2021 to January 1, 2022 |
Note | Note | Note | ||||||||||||||||||||||||||||
| Net sales |
$ | 26,406,869 | $ | 28,048,703 | | $ | 54,455,572 | |||||||||||||||||||||||||
| Cost of sales |
24,419,489 | 25,925,610 | | 50,345,099 | ||||||||||||||||||||||||||||
|
|
|
|
|
|
|
|
|
|||||||||||||||||||||||||
| Gross profit |
1,987,380 | 2,123,093 | | 4,110,473 | ||||||||||||||||||||||||||||
|
|
|
|
|
|
|
|
|
|||||||||||||||||||||||||
| Operating expenses: |
||||||||||||||||||||||||||||||||
| Selling, general and administrative |
1,459,364 | 1,684,170 | 19,279 | 1 | (a) | 3,203,846 | ||||||||||||||||||||||||||
| | | 18,663 | 1 | (b) | | |||||||||||||||||||||||||||
| | | 9,870 | 1 | (c) | | |||||||||||||||||||||||||||
| | | 12,500 | 1 | (d) | | |||||||||||||||||||||||||||
| Merger-related costs |
2,314 | 114,332 | | 116,646 | ||||||||||||||||||||||||||||
| Restructuring costs |
202 | 831 | | 1,033 | ||||||||||||||||||||||||||||
|
|
|
|
|
|
|
|
|
|||||||||||||||||||||||||
| Total operating expenses |
1,461,880 | 1,799,333 | 60,312 | 3,321,525 | ||||||||||||||||||||||||||||
|
|
|
|
|
|
|
|
|
|||||||||||||||||||||||||
| Income from operations |
525,500 | 323,760 | (60,312 | ) | 788,948 | |||||||||||||||||||||||||||
|
|
|
|
|
|
|
|
|
|||||||||||||||||||||||||
| Other (income) expense: |
||||||||||||||||||||||||||||||||
| Interest income |
(11,744 | ) | (6,306 | ) | | (18,050 | ) | |||||||||||||||||||||||||
| Interest expense |
44,281 | 183,208 | | 85,153 | 2 | (a) | 312,642 | |||||||||||||||||||||||||
| Net foreign currency exchange loss (gain) |
1,419 | 17,473 | | 18,892 | ||||||||||||||||||||||||||||
| Other |
(13,410 | ) | 12,628 | | (782 | ) | ||||||||||||||||||||||||||
|
|
|
|
|
|
|
|
|
|
|
|||||||||||||||||||||||
| Total other (income) expense |
20,546 | 207,003 | | 85,153 | 312,702 | |||||||||||||||||||||||||||
|
|
|
|
|
|
|
|
|
|
|
|||||||||||||||||||||||
| Income from continuing operations before income taxes |
504,954 | 116,757 | (60,312 | ) | (85,153 | ) | 476,246 | |||||||||||||||||||||||||
| Provision for income taxes |
126,479 | 20,023 | (15,078 | ) | 1 | (e) | (21,288 | ) | 2 | (b) | 110,136 | |||||||||||||||||||||
|
|
|
|
|
|
|
|
|
|
|
|||||||||||||||||||||||
| Net income |
$ | 378,475 | $ | 96,734 | $ | (45,234 | ) | (63,864 | ) | $ | 366,110 | |||||||||||||||||||||
| Weighted Average Shares of common stock outstanding |
100 | 26,473 | 26,427 | |||||||||||||||||||||||||||||
| Basic and Diluted earnings per share |
3,784,750 | 3,654 | 13,854 | 2 | (c) | |||||||||||||||||||||||||||
|
|
|
|
|
|
|
|||||||||||||||||||||||||||
92
Table of Contents
Note 1 Transaction Accounting Adjustments for the Imola Mergers
| (a) | Reflects the assumed adjustments to eliminate historical depreciation expense and record new depreciation expense based on the fair value of the identifiable acquired fixed assets as if the Imola Mergers occurred at the beginning of 2021. The depreciation of fixed assets is based on the periods over which the economic benefits of the fixed assets are expected to be realized. |
| Preliminary Fair Value |
Estimated Remaining Useful Life |
Depreciation Expense for Unaudited Pro Forma Combined 2021 Period |
||||||||||
| Land |
$ | 18,229 | | | ||||||||
| Buildings |
45,205 | 34 Years | 1,330 | |||||||||
| Leasehold improvements |
64,007 | 2.4 Years | 26,786 | |||||||||
| Distribution equipment |
214,512 | 3.3 Years | 64,460 | |||||||||
| Computer equipment and software |
222,389 | 2.7 Years | 81,468 | |||||||||
|
|
|
|
|
|||||||||
| $ | 564,342 | $ | 174,044 | |||||||||
| Elimination of historical depreciation of fixed assets |
(154,765 | ) | ||||||||||
|
|
|
|||||||||||
| Net adjustments to depreciation of fixed assets |
$ | 19,279 | ||||||||||
|
|
|
|||||||||||
| (b) | Reflects the assumed adjustments to eliminate historical amortization expense and record new amortization expense based on the fair value of the identifiable acquired intangible assets as if the Imola Mergers occurred at the beginning of 2021. The amortization of intangible assets is based on the periods over which the economic benefits of the intangible assets are expected to be realized. |
| Preliminary Fair Value |
Estimated Useful Life |
Amortization Expense for Unaudited Pro Forma Combined 2021 Period |
||||||||||
| (in thousands) | (in thousands) | |||||||||||
| Tradenames |
$ | 445,000 | 15 Years | $ | 29,150 | |||||||
| Developed technology |
105,000 | 8 Years | 12,432 | |||||||||
| Customer relationships |
615,000 | 12 Years | 51,213 | |||||||||
| Others |
8,129 | 1 Year | 8,129 | |||||||||
|
|
|
|
|
|||||||||
| $ | 1,173,129 | $ | 100,924 | |||||||||
| Elimination of historical amortization of intangible assets |
(82,261 | ) | ||||||||||
|
|
|
|||||||||||
| Net adjustments to amortization of intangible assets |
$ | 18,663 | ||||||||||
|
|
|
|||||||||||
93
Table of Contents
| (c) | Represents the additional expense operating lease assets and liabilities based on the fair value of the operating lease assets and liabilities as if the Imola Mergers occurred at the beginning of 2021. |
| Unaudited Pro Forma Combined 2021 Period |
||||
| (in thousands) | ||||
| Lease operating lease amortization expense for fiscal year 2021 |
$ | 163,930 | ||
| Elimination of historical amortization expense of operating lease assets |
(154,060 | ) | ||
|
|
|
|||
| Net adjustments to operating lease amortization |
$ | 9,870 | ||
|
|
|
|||
| (d) | Reflects the additional annual advisory fee payable to Platinum Advisors, as if a full year fee was paid and which will no longer be payable following the completion of this offering. |
| Unaudited Pro Forma Combined 2021 Period |
||||
| (in thousands) | ||||
| Full year advisory fee |
$ | 25,000 | ||
| Elimination of historical advisory fee |
(12,500 | ) | ||
|
|
|
|||
| $ | 12,500 | |||
|
|
|
|||
| (e) | Reflects the assumed income tax benefit related to the pro forma adjustments to the annual advisory fee paid to Platinum Advisors, depreciation, amortization of intangible assets, and amortization of operating lease assets. The actual effective tax rate could differ significantly from the assumed tax rates used for the purposes of preparing the unaudited pro forma condensed combined financial information for a variety of factors, including but not limited to relative mix of earnings or losses and various tax rates within the jurisdictions in which we operate, such as: (a) losses in certain jurisdictions in which we are not able to record a tax benefit; (b) changes in the valuation allowance on deferred tax assets; and (c) changes in tax laws or interpretations thereof. The tax benefit also does not consider any impact to U.S. foreign tax credit utilization and any other U.S. international tax calculations from the pro forma adjustments. |
| Unaudited Pro Forma Combined 2021 Period |
||||
| (in thousands) | ||||
| Income tax benefit of assumed depreciation expense of fixed assets(1) |
$ | (4,820 | ) | |
| Income tax benefit of assumed amortization of intangible assets (1) |
(4,666 | ) | ||
| Income tax benefit of assumed amortization of operating lease assets (1) |
(2,468 | ) | ||
| Income tax benefit of assumed annual advisory fee (2) |
(3,125 | ) | ||
|
|
|
|||
| Net adjustments to provision for income taxes |
$ | (15,078 | ) | |
|
|
|
|||
| (1) | Calculated using an assumed global blended tax rate of 25% for depreciation & amortization. |
| (2) | Calculated using an assumed blended U.S. federal and state tax rate of 25% for the advisory fee paid to Platinum Advisors. |
94
Table of Contents
Note 2 Financing Transaction Accounting Adjustments for Imola Mergers
| (a) | Reflects the incremental interest expense and amortization of debt financing fees and original issuance discounts, as well as the elimination of our historical interest expense, and amortization of discount and deferred financing costs related to our historical senior unsecured notes. |
| Unaudited Pro Forma Combined 2021 Period |
||||
| (in thousands) | ||||
| Interest expense on the 2029 Notes and Credit Facilities (1) |
$ | 223,393 | ||
| Elimination of historical interest expense for debt paid |
(144,803 | ) | ||
| Unused line fee on ABL Revolving Credit Facility |
6,563 | |||
|
|
|
|||
| Net adjustment to interest expense |
$ | 85,153 | ||
|
|
|
|||
| (1) | For pro forma purposes, interest expense adjustments have been calculated using a weighted average effective interest rate of 5.17%, 5.20% and 4.17% for the 2029 Notes, the Term Loan Credit Facility and ABL Term Loan Facility, respectively. |
| (b) | Reflects the assumed income tax benefit related to the pro forma adjustments related to incremental interest expense calculated using an assumed blended U.S. federal and state tax rate of 25%. The U.S. blended tax rate was utilized as the incremental debt is located in the United States. The estimated tax benefit does not consider the potential impact of Section 163(j) which limits business interest expense deductions. Section 163(j) generally limits a taxpayers business net interest expense deductions for a taxable year to 30% of the taxpayers adjusted taxable income (ATI) for that year. The tax benefit also does not consider any impact to U.S. foreign tax credit utilization from incremental interest expense. |
| (c) | Basic and diluted earnings per share are calculated as follows: |
| Unaudited Pro Forma Combined 2021 Period |
||||||||
| (in thousands except share and per share data) |
||||||||
| Class A | Class B | |||||||
| Net income |
365,459 | 651 | ||||||
| Weighted average shares of common stock outstanding |
26,380 | 47 | ||||||
| Basic earnings per share |
13,854 | 13,854 | ||||||
| Diluted earnings per share |
13,854 | 13,854 | ||||||
95
Table of Contents
MANAGEMENTS DISCUSSION AND ANALYSIS OF FINANCIAL CONDITION
AND RESULTS OF OPERATIONS
The following discussion and analysis of our financial condition and results of operations should be read in conjunction with the consolidated financial statements and related notes included elsewhere in this prospectus. Some of the information contained in this discussion and analysis, including information with respect to our planned investments in our research and development, sales and marketing and general and administrative functions, includes forward-looking statements that involve risks and uncertainties. You should review the sections titled Cautionary Note Regarding Forward-Looking Statements and Risk Factors for a discussion of forward-looking statements and important factors that could cause actual results to differ materially from the results described in or implied by the forward-looking statements contained in the following discussion and analysis.
Our Fiscal Year is a 52- or 53-week period ending on the Saturday nearest to December 31. For the purpose of discussing our financial results, we refer to ourselves (Ingram Micro Holding Corporation) as the Successor in the periods following the Imola Mergers and the Predecessor (Ingram Micro Inc.) during the periods preceding the Imola Mergers. All references herein to Fiscal Year 2022 (Successor) and Fiscal Year 2023 (Successor) represent the Fiscal Years ended December 31, 2022 (52 weeks) and December 30, 2023 (52 weeks), respectively. For purposes of discussing our unaudited financial results, all references herein to the Unaudited 2023 Interim Period (Successor) and the Unaudited 2024 Interim Period (Successor) represent the twenty-six weeks ended July 1, 2023 (Successor) and June 29, 2024 (Successor), respectively. When discussing our financial results for the 2021 fiscal year, we refer to the period from January 3, 2021 to July 2, 2021 as the Predecessor 2021 Period and the period from July 3, 2021 to January 1, 2022 as the Successor 2021 Period. To facilitate comparability of Fiscal Year 2022 (Successor) and Fiscal Year 2023 (Successor) to the fiscal year ended January 1, 2022, this prospectus also includes unaudited pro forma condensed combined financial information for key financial metrics and results of operations for the year ended January 1, 2022 to illustrate the effects of the Imola Mergers, on a pro forma basis, as if they had occurred on January 3, 2021 (the Unaudited Pro Forma Combined 2021 Period). See Unaudited Pro Forma Condensed Combined Statement of Income. In addition, this Managements Discussion and Analysis of Financial Condition and Results of Operations has been corrected to give effect to the revision of our consolidated balance sheet, consolidated statement of income and consolidated statements of cash flows, as more fully described in Note 2, Significant Accounting PoliciesRevision of Previously Issued Consolidated Financial Statements, to our audited consolidated financial statements. All financial data included in this Managements Discussion and Analysis of Financial Condition and Results of Operations section are in thousands, except as otherwise indicated.
Overview
Ingram Micro is a leading solutions provider by revenue for the global IT ecosystem helping power the worlds leading technology brands. Through our global reach and broad portfolio of products, professional services offerings and software, cloud and digital solutions, we remove complexity and maximize the value of the technology products our partners make, sell or use, providing the world more ways to realize the promise of technology.
With operations in 57 countries and 134 logistics and service centers worldwide, we serve as a solutions aggregator that we believe based on our experience in the industry enables us, together with our more than 1,500 vendor partners, to reach nearly 90% of the global population with technology. OEMs and software providers rely on us to simplify global sales channels, gain operational efficiencies and address complex technology deployments, including through our global Ingram Micro Cloud Marketplace and CloudBlue digital commerce platform. Our highly diversified base of more than 161,000 customers includes value-added resellers, system integrators, telecommunications companies and managed service providers. We provide our customers with broad product availability, technical expertise and a full suite of professional services to simplify their deployment and maximize their use of technology, including data-driven business and market insights, pre-sales engineering, post-sales integration, technical support and financing solutions. We manage more than 850 million
96
Table of Contents
units of technology products across more than 220,000 unique SKUs every year and handle, on average, in excess of 12,000 technical engineering calls monthly. Additionally, we provide resellers, retailers and vendors with our ITAD and Reverse Logistics and Repairs services to advance environmental sustainability through responsibly collecting and beneficially repurposing e-waste through remanufacturing, recycling, refurbishing and reselling technology devices.
More than a decade ago, we embarked on a journey from being a traditional IT products distributor to creating an integrated marketplace for customized solutions. Since then, even in the midst of the recent global softening in demand for certain of our traditional offerings, including our client and endpoint solutions, we have invested more than $2 billion in technical resources, intellectual property, digital processes and systems, advanced solutions, specialty markets and professional services. From its inception, this organic evolution, aided by a number of key acquisitions, has focused on creating a one-stop-shop experience for our thousands of customers to seamlessly procure and manage a comprehensive suite of technology solutions and services. The XaaS market has now been a rapidly expanding market and a key growth driver for several years, leading to our accelerated development of highly integrated solutions, services and marketplaces. First launched in 2010, our cloud marketplace has been a transformative part of our journey, enabling leading software vendors to connect with thousands of customers, who in turn support millions of end users, in what we believe to be the worlds largest cloud ecosystem. Today, our cloud marketplace hosts more than 200 cloud solutions, aggregates 29 marketplaces and manages over 36 million seats, for more than 33,000 customers. Building on our successful cloud marketplace, our proprietary CloudBlue digital commerce platform, and other acquired and organically developed intellectual property, in 2022 we launched Ingram Micro Xvantage, our fully automated, self-learning and innovative digital platform, which is now live in key countries around the globe. We believe that our customers will increasingly experience a single pane of glass through which we offer a full menu of IT devices, software solutions, cloud-based subscriptions, and technology services across hundreds of vendors and brands as we migrate our cloud marketplace and other marketplaces to Ingram Micro Xvantage and continuously integrate additional capabilities to the platform. Through Ingram Micro Xvantage, many tasks that previously took hours or even days, such as order status updates, price quotes and vendor catalog management activities, can now be accomplished by the platform in a few minutes, driving significant efficiency gains for our vendors, customers and associates. We believe that we offer our third-party partners the industrys first comprehensive and streamlined distribution experience in a single integrated digital platform. Harnessing the insights gained from hundreds of millions of transactions over the past decade, Ingram Micro Xvantage is a significant milestone in our evolution benefiting from many years of investment and IT distribution experience. As our dynamic business model continues to evolve and we continue our transition to becoming more of a platform company, we will be better able to adapt to customer demands in the constantly shifting IT landscape.
Our focus on successful business outcomes for our partners and their clients, together with the investments described above, have enabled us to deliver solid financial results and expand our advanced solutions and cloud businesses even in the midst of the recent global softening in demand for certain of our traditional offerings, including our client and endpoint solutions.
Advanced Solutions generated net sales of $7,329 million for the Predecessor 2021 Period, $8,309 million for the Successor 2021 Period, $17,354 million for Fiscal Year 2022 (Successor), $17,883.3 million for Fiscal Year 2023 (Successor) and $8,164.9 million for the Unaudited 2024 Interim Period (Successor). Cloud generated net sales of $125.9 million for the Predecessor 2021 Period, $161.7 million for the Successor 2021 Period, $326.0 million for Fiscal Year 2022 (Successor), $383.3 million for Fiscal Year 2023 (Successor) and $226.1 million for the Unaudited 2024 Interim Period (Successor).
Our History
Ingram Micro was founded in 1979 as Micro D Inc. Over the course of several decades, we have significantly expanded our global footprint, product breadth and technology expertise. We have grown through a series of organic and inorganic investments, expanding our presence in key strategic focus, areas of software,
97
Table of Contents
cloud, cybersecurity and supply chain solutions. We leverage these leading capabilities to power our differentiated solutions including Ingram Micro Xvantage. We are among the largest technology distributors in the world by revenue and/or global footprint.
Platinum formed Ingram Micro Holding Corporation (formerly known as Imola Holding Corporation) on September 28, 2020, and on December 9, 2020, Imola Acquisition Corporation, an investment vehicle of certain private investment funds sponsored and ultimately controlled by Platinum, Tianjin Tianhai Logistics Investment Management Co., Ltd., HNA Technology Co., Ltd. (HNA Tech), a part of HNA Group, GCL Investment Management, Inc., Ingram Micro and Imola Merger Corporation (Escrow Issuer) entered into an agreement pursuant to which Platinum indirectly acquired (through Imola Acquisition Corporation) Ingram Micro from affiliates of HNA Tech, for aggregate cash consideration of approximately $7.2 billion, net of any indebtedness acquired (the Acquisition Agreement). Pursuant to the Acquisition Agreement, HNA Tech had the right to receive an amount not to exceed $325.0 million in the aggregate, on the achievement by the Company of certain adjusted EBITDA targets for fiscal years 2021, 2022 and 2023. Based upon adjusted EBITDA achieved through the end of the Successor 2021 Period, such payment of an expected $325.0 million was earned in its entirety and was paid on April 11, 2022.
The acquisition closed on July 2, 2021 (the Acquisition Closing Date). To fund a portion of the consideration for the acquisition, Platinum contributed certain amounts in cash to an indirect parent of Ingram Micro in exchange for the issuance to Platinum of equity in such parent entity in connection with the acquisition (the Equity Contribution). Concurrently with the Equity Contribution and to finance the remaining portion of the consideration for the acquisition, Ingram Micro entered into the following:
| | the ABL Credit Facilities, consisting of a $500 million ABL Term Loan Facility and a $3,500 million ABL Revolving Credit Facility; |
| | the $2,000 million Term Loan Credit Facility; and |
| | the $2,000 million 2029 Notes. |
In connection with the acquisition, Ingram Micro repaid in full, or satisfied and discharged in full, the obligations under any governing instruments, as applicable, of the then existing indebtedness of the Company and its subsidiaries, except for certain additional lines of credit, short-term overdraft facilities and other credit facilities with approximately $179.4 million outstanding as of June 29, 2024, and entered into the agreements governing its current indebtedness as described above (the Financing Transactions). See Description of Material Indebtedness.
As part of the acquisition, Imola Merger Corporation merged with and into GCL Investment Management Inc., an affiliate of HNA Tech, which immediately thereafter merged with and into GCL Investment Holdings, Inc., which subsequently and immediately then merged with and into Ingram Micro, with Ingram Micro as the surviving entity (collectively, and together with the closing of the transactions contemplated by the Acquisition Agreement, the Equity Contribution and the Financing Transactions related to the acquisition, the Imola Mergers).
On December 8, 2021, we announced the CLS Sale. The transaction contemplated a primary closing date with respect to the vast majority of the operations that were the subject of the CLS Sale and successive deferred closings in respect of other operations. The primary closing of the transaction occurred on April 4, 2022 and the deferred closings were completed between the primary closing date and November 16, 2022. In connection with the primary closing of the transaction on April 4, 2022, we entered into a TSA with CMA CGM Group, under which we are providing certain services, including logistical, IT and corporate services. The services provided under the TSA will terminate at various times but those that are not fully transitioned by the applicable specified time may be extended under certain circumstances to no later than 24 months from April 4, 2022, unless otherwise extended by mutual agreement. The majority of the human resources services we are obligated to
98
Table of Contents
provide under the TSA were fully transitioned and completed by the end of December 2022. In addition, the majority of the operations and IT services were transitioned during 2023, and management expects the remaining services to be fully transitioned and completed by the end of 2024. On April 4, 2022, we used a portion of the proceeds received from the CLS Sale to pay down the full outstanding balance of our $500 million ABL Term Loan Facility. In June 2023, we voluntarily paid down $500 million of the principal balance of our Term Loan Credit Facility over and above the normal quarterly installments. In June 2024, we voluntarily paid down an incremental $150 million of the principal balance of our Term Loan Credit Facility. In connection with the 2024 Refinancing, on September 20, 2024, we voluntarily paid down an incremental $100 million of the principal balance of our Term Loan Credit Facility. Following the 2024 Refinancing, $1,160 million remained outstanding under the Term Loan Credit Facility.
The business encompassed in the CLS Sale had $781.0 million, $853.1 million and $399.2 million of net sales for the Predecessor 2021 Period, the Successor 2021 Period and Fiscal Year 2022 (Successor), respectively, and $42.2 million, $29.0 million and $3.7 million of income from operations for the Predecessor 2021 Period, the Successor 2021 Period and Fiscal Year 2022 (Successor), respectively.
Ingram Micro Timeline
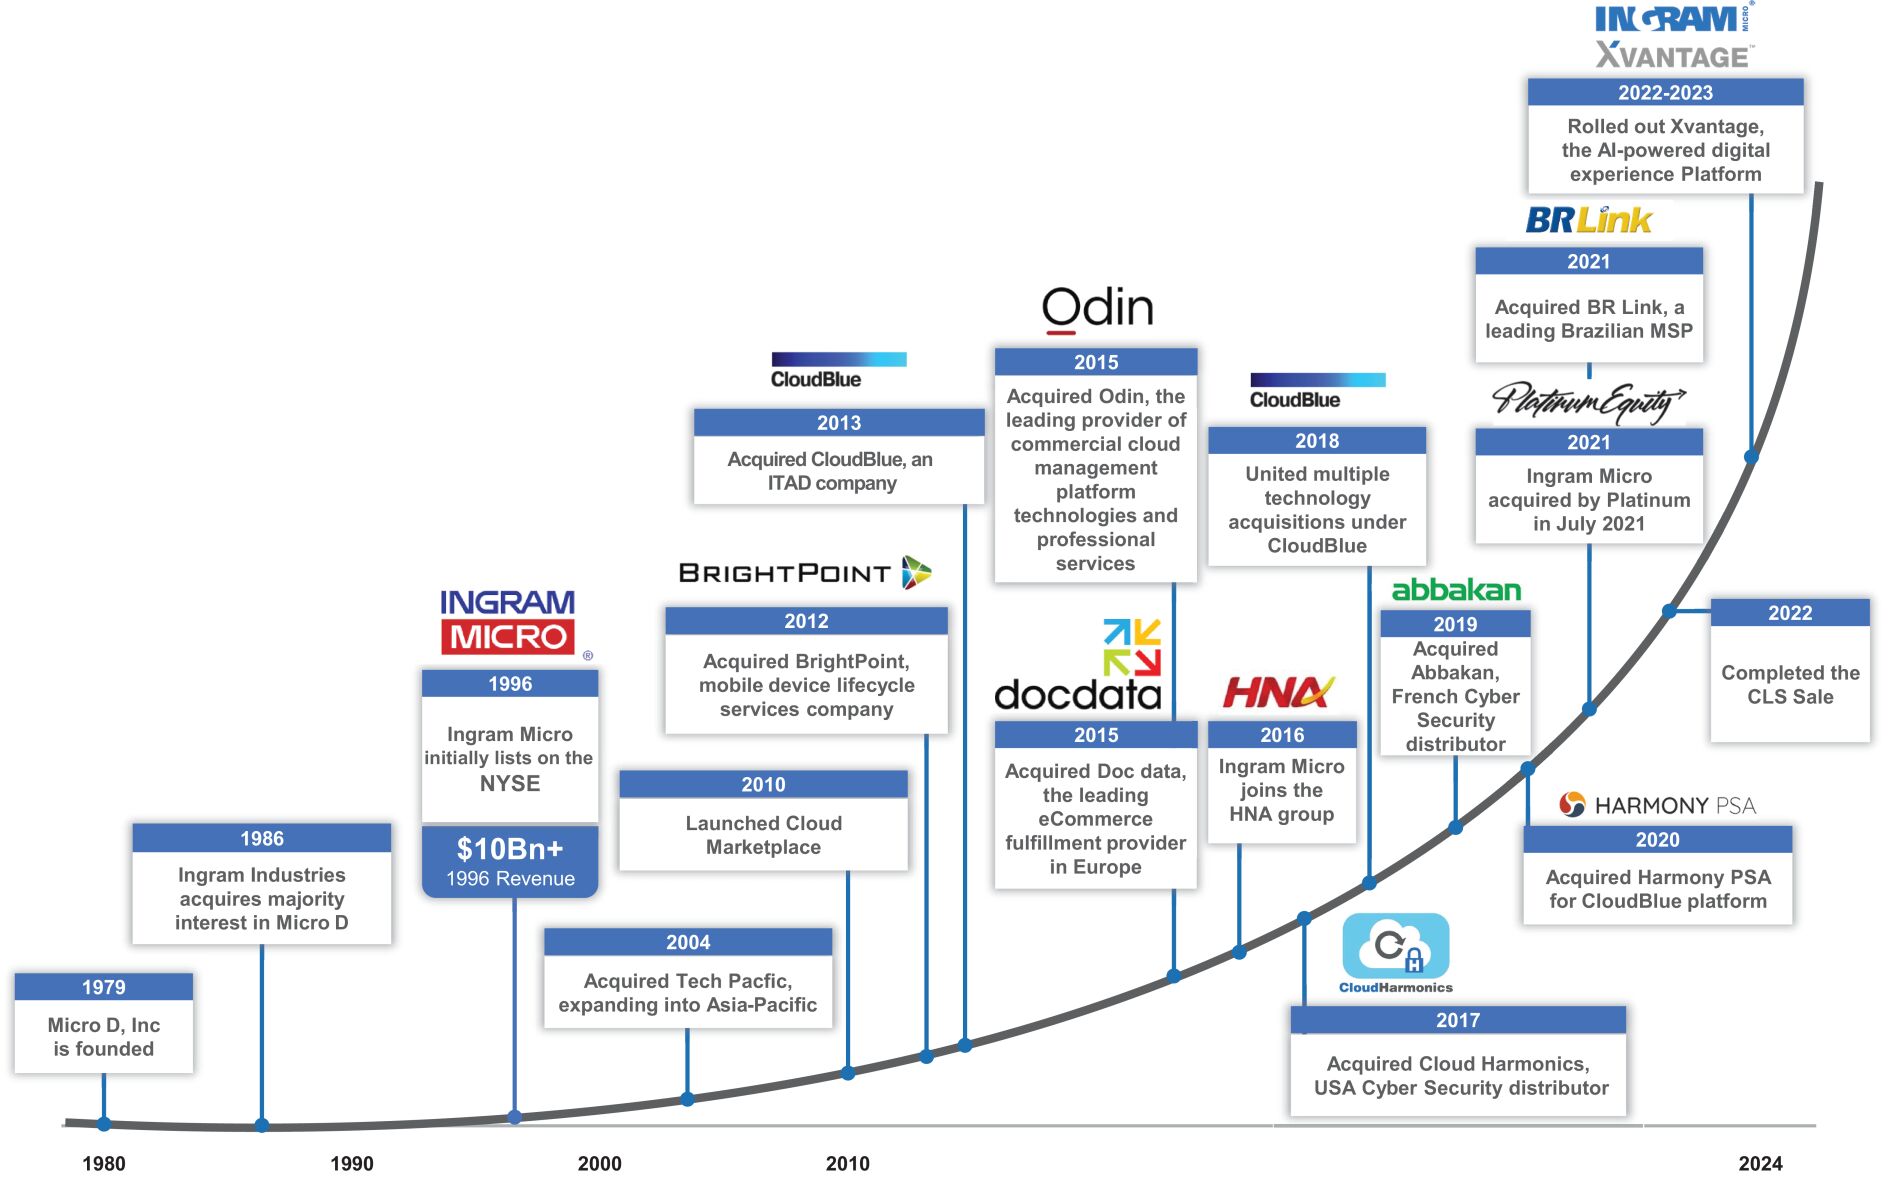
Operating Segments
Our business is organized into four reporting segments based on the different geographic regions in which we operate: North America, EMEA, Asia-Pacific and Latin America.
99
Table of Contents
The table below summarizes our results of operations by these reporting segments for the Predecessor 2021 Period, the Successor 2021 Period, the Unaudited Pro Forma Combined 2021 Period, Fiscal Year 2022 (Successor), the Unaudited 2023 Interim Period (Successor), Fiscal Year 2023 (Successor) and the Unaudited 2024 Interim Period (Successor).
| Predecessor | Successor | Combined | Successor | |||||||||||||||||||||||||
| Predecessor 2021 Period |
Successor 2021 Period |
Unaudited Pro Forma Combined 2021 Period |
Fiscal Year 2022 |
Fiscal Year 2023 |
Unaudited 2023 Interim Period |
Unaudited 2024 Interim Period |
||||||||||||||||||||||
| (Amounts in millions) | Period from January 3, 2021 to July 2, 2021 |
Period from July 3, 2021 to January 1, 2022 |
Fiscal Year Ended January 1, 2022 |
Year Ended December 31, 2022 |
Year Ended December 30, 2023 |
Twenty-six Weeks Ended July 1, 2023 |
Twenty-six Weeks Ended June 29, 2024 |
|||||||||||||||||||||
| Net Sales |
||||||||||||||||||||||||||||
| North America |
$ | 10,568 | $ | 11,573 | $ | 22,141 | $ | 20,908 | $ | 18,196 | $ | 9,111 | $ | 8,421 | ||||||||||||||
| EMEA |
8,539 | 8,526 | 17,065 | 15,052 | 14,481 | 6,881 | 6,724 | |||||||||||||||||||||
| Asia-Pacific |
5,520 | 6,097 | 11,617 | 11,185 | 11,573 | 5,337 | 6,007 | |||||||||||||||||||||
| Latin America |
1,780 | 1,853 | 3,633 | 3,679 | 3,790 | 1,766 | 1,724 | |||||||||||||||||||||
| Total |
$ | 26,407 | $ | 28,049 | $ | 54,456 | $ | 50,824 | $ | 48,040 | $ | 23,095 | $ | 22,876 | ||||||||||||||
| Income from Operations |
||||||||||||||||||||||||||||
| North America |
$ | 202 | $ | 203 | $ | 374 | $ | 414 | $ | 351 | $ | 146 | $ | 123 | ||||||||||||||
| EMEA |
170 | 197 | 361 | 315 | 316 | 138 | 101 | |||||||||||||||||||||
| Asia-Pacific |
115 | 127 | 229 | 230 | 247 | 115 | 112 | |||||||||||||||||||||
| Latin America |
65 | 61 | 128 | 113 | 94 | 39 | 48 | |||||||||||||||||||||
| Corporate |
1 | (236 | ) | (247 | ) | (72 | ) | (33 | ) | (18 | ) | (21 | ) | |||||||||||||||
| Gain on CLS Sale |
| | | 2,284 | | | | |||||||||||||||||||||
| Cash-based compensation |
(27 | ) | (28 | ) | (56 | ) | (35 | ) | (31 | ) | (19 | ) | (12 | ) | ||||||||||||||
| Total |
$ | 526 | $ | 324 | $ | 789 | $ | 3,249 | $ | 944 | $ | 401 | $ | 351 | ||||||||||||||
| Income from Operations Margin |
||||||||||||||||||||||||||||
| North America |
1.91 | % | 1.75 | % | 1.69 | % | 1.98 | % | 1.93 | % | 1.61 | % | 1.47 | % | ||||||||||||||
| EMEA |
2.00 | % | 2.30 | % | 2.12 | % | 2.09 | % | 2.19 | % | 2.01 | % | 1.51 | % | ||||||||||||||
| Asia-Pacific |
2.08 | % | 2.09 | % | 1.97 | % | 2.06 | % | 2.14 | % | 2.15 | % | 1.86 | % | ||||||||||||||
| Latin America |
3.64 | % | 3.31 | % | 3.52 | % | 3.08 | % | 2.47 | % | 2.23 | % | 2.77 | % | ||||||||||||||
| Corporate |
| | | | | | ||||||||||||||||||||||
| Gain on CLS Sale |
| | | | | | | |||||||||||||||||||||
| Cash-based compensation |
| | | | | | | |||||||||||||||||||||
| Total |
1.99 | % | 1.15 | % | 1.45 | % | 6.39 | % | 1.97 | % | 1.74 | % | 1.54 | % | ||||||||||||||
100
Table of Contents
Key Operating Metrics and Non-GAAP Financial Measures
We monitor the following key non-GAAP financial measures to help us evaluate our business, identify trends affecting our business, measure our performance, formulate business plans and make strategic decisions. Certain judgments and estimates are inherent in our processes to calculate these metrics. We believe that, in addition to our results determined in accordance with GAAP the following metrics are useful in evaluating our business and the underlying trends that are affecting our performance. See Non-GAAP Financial Measures below for more detail and the accompanying reconciliations.
| Predecessor | Successor | |||||||||||||||||||||||||||
| Predecessor 2021 Period |
Successor 2021 Period |
Fiscal Year 2022 |
Fiscal Year 2023 |
Unaudited 2023 Interim Period |
Unaudited 2024 Interim Period |
|||||||||||||||||||||||
| (Amounts in thousands) |
Period from January 3, 2021 to July 2, 2021 |
Period from July 3, 2021 to January 1, 2022 |
Year Ended December 31, 2022 |
Year Ended December 30, 2023 |
Twenty-six Weeks Ended July 1, 2023 |
Twenty-six Weeks Ended June 29, 2024 |
||||||||||||||||||||||
| Non-GAAP Financial Data |
||||||||||||||||||||||||||||
| Adjusted Income from Operations |
$ | 549,684 | $ | 613,906 | $ | 1,162,132 | $ | 1,103,561 | $ | 465,249 | $ | 440,475 | ||||||||||||||||
| Adjusted Income from Operations Margin |
2.08 | % | 2.19 | % | 2.29 | % | 2.30 | % | 2.01 | % | 1.93 | % | ||||||||||||||||
| Adjusted Return on Invested Capital |
21.7 | % | 14.4 | % | 14.1 | % | 12.4 | % | 11.5 | % | 10.4 | % | ||||||||||||||||
| EBITDA |
$ | 637,033 | $ | 431,143 | $ | 3,308,971 | $ | 1,051,863 | $ | 453,648 | $ | 403,476 | ||||||||||||||||
| Adjusted EBITDA |
$ | 647,770 | $ | 746,278 | $ | 1,349,399 | $ | 1,353,092 | $ | 603,731 | $ | 568,999 | ||||||||||||||||
| Non-GAAP Net Income |
$ | 400,512 | $ | 322,001 | $ | 678,746 | $ | 638,118 | $ | 268,605 | $ | 255,627 | ||||||||||||||||
| Adjusted Free Cash Flow |
$ | (626,795 | ) | $ | 205,483 | $ | (351,891 | ) | $ | 19,911 | $ | 287,983 | $ | 360,745 | ||||||||||||||
We believe EBITDA, Adjusted EBITDA, Adjusted Income from Operations and Adjusted Income from Operations Margin are all useful measures to our management as well as investors, analysts and other interested parties to assist in assessing the performance of the Company on a more meaningful and consistent basis before certain non-cash or non-recurring items that are not core to our business. These metrics have all generally shown growth over the periods presented as we have continued to drive revenue and gross margin growth and leverage on our operating expenses. As we continue to move our mix of business more toward higher margin Advanced Solutions and cloud product offerings, as well as seeing generally higher prices for high-demand, supply-constrained products, we have generated growth in gross profits to help offset, or more than offset, the growth in selling, general and administrative (SG&A) expenses from inflationary trends and investments necessary to service our higher net sales as a whole.
Management believes that in addition to our results determined in accordance with GAAP, Non-GAAP Net Income is useful in evaluating our business and the underlying trends that are affecting our performance because it applies a tax-effected profitability metric that is useful in evaluating our business and the underlying trends that are affecting our performance, and Non-GAAP Net Income is a key measure used by our management, Platinum and our board of directors to evaluate our financial performance, generate future financial plans and make strategic decisions regarding the allocation of capital.
We view adjusted free cash flow as an important measure to evaluate our ability to generate operating cash flows after capital expenditures, which we in turn use to fund financing and investing needs. Our operating cash flows move most significantly based upon our changes in working capital.
We believe Adjusted Return on Invested Capital measures both our profitability and the efficiency with which we invest our capital in the business. This metric has been decreasing since the Successor 2021 Period reflective of our revised capital structure resulting from the Imola Mergers, as well as some volatility in the
101
Table of Contents
investment in working capital driven by supply constraints and lower profit levels driven by the impact of market softness particularly in client and endpoint solutions categories, but continues to represent a strong return overall and usage of working capital to run our business.
Key Factors and Trends Affecting Our Operating Results
Global Demand for IT Products and Value-Added Services
We are dependent on global IT spend, which is influenced by broader economic trends and their impacts on enterprise spending, as well as new product introductions and product transitions by technology vendors. Driven by the rapid evolution of the technology industry, frequent fluctuations in market demand, and the increasing complexity of solutions, which often integrate offerings from multiple vendors and service providers, vendors increasingly rely on distributors to bring their products to market more efficiently along with providing value-added services. We have diverse relationships with many global vendors and offer a full end-to-end solution including comprehensive services, positioning us well to capture demand in key technology sectors. We expect to continue investing in our services offerings, as well as our relationships with existing and emerging vendors with the goal of expanding the breadth and depth of what we already believe to be the industrys most comprehensive offering.
Market Adoption of Cloud Solutions and XaaS
The accelerating transition from on-premises software solutions to cloud-based solutions can drive a revenue mix shift to our higher margin cloud offerings. According to IDC, public cloud software deployment is expected to grow at a CAGR of 18.8% from 2023 to 2027 while on-premise software deployment is expected to grow at a CAGR of 3.4% over the same period. Because of our advanced capabilities and offerings, we believe this industry shift is a net positive for our business, and it demonstrates the comprehensive value of our business model. To capture this opportunity, we plan to continue investing in development and go-to-market support for our cloud offerings and marketplaces, including those already integrated into Ingram Micro Xvantage.
Product, Line of Business and Global Presence
Our product, service and solution offerings consist of Client and Endpoint Solutions, Advanced Solutions, Cloud-based Solutions and Other, which include the product and service categories further described below. Results are impacted by changes in product mix, including entry or expansion into new markets, new product offerings and the exit or retraction of certain business. Furthermore, we have invested most heavily in recent years into Advanced Solutions and Cloud-based Solutions and capabilities globally, for which an increased need for more complex solutions coupled with more products being consumed on an as-a-service basis is driving a more rapid shift towards these offerings. Advanced Solutions and Cloud sales now collectively comprise more than one-third of our net sales.
As part of our global presence in each of our four geographic regions, we offer customers a full spectrum of hardware and software, cloud services and logistics expertise through three main lines of business: Technology Solutions, Cloud and Other. In each of our geographic segments we offer customers the product categories listed below broken down under the respective line of business. Beginning in the second quarter of 2024, we began to refer to our Commercial & Consumer category as Client and Endpoint Solutions as a better reflection of the nature of the products and services within that category.
Technology Solutions:
| | Client and Endpoint Solutions (formerly referred to as Commercial & Consumer). We offer a variety of higher-volume products targeted for corporate and individual end users, including desktop personal computers, notebooks, tablets, printers, components (including hard drives, motherboards, video cards, etc.), application software, peripherals, accessories and Ingram Micro branded solutions. We also offer a variety of products that enable mobile computing and productivity, including phones, phone tablets (including two-in-one notebook/tablet devices), smartphones, feature phones, mobile phone accessories, wearables and mobility software. |
102
Table of Contents
| | Advanced Solutions. We offer enterprise grade hardware and software products aimed at corporate and enterprise users and generally characterized by specific projects, which account for lower volumes but higher-margin products individually and collectively in the form of solutions and related services. And while Advanced Solutions requires higher operational expenditures, primarily in the form of technical capabilities to serve the market, the operating margin delivered by this business is also generally stronger than Client and Endpoint Solutions. Within this product category, we offer servers, storage, networking, hybrid and software-defined solutions, cyber security, power and cooling and virtualization (software and hardware) solutions. This category also includes training, professional services and financial solutions related to these product sets. We also offer customers DC / POS, physical security, audio visual & digital signage, UCC and Telephony, IoT (smart office/home automation) and AI products. |
Cloud:
| | Cloud-based Solutions. Our cloud portfolio comprises third-party services and subscriptions spanning a breadth of products from solution software through infrastructure-as-a-service. As technology consumption increasingly moves to XaaS, we have expanded our cloud solutions to more than 200 third-party cloud-based services or subscription offerings, including business applications, security, communications and collaboration, cloud enablement solutions and infrastructure-as-a-service. Also included here are the offerings of our CloudBlue business, which provides customers with multi-channel and multi-tier catalog management, subscription management, billing and orchestration capabilities through a SaaS model. |
Other:
| | Other Offerings. We provide customers with ITAD, reverse logistics and repair and other related solutions, and prior to April 2022 included the operations sold through the CLS Sale further described herein. See CLS Sale. These offerings represent less than 10% of net sales for all periods presented herein. |
The following table presents net sales across our four product categories for each of the periods indicated.
| Predecessor | Successor | Successor | Successor | |||||||||||||||||||||||||||||
| Period from January 3, 2021 to July 2, 2021 |
Period from July 3, 2021 to January 1, 2022 |
Fiscal Year Ended 2022 |
Fiscal Year Ended 2023 |
|||||||||||||||||||||||||||||
| Net sales: |
||||||||||||||||||||||||||||||||
| Client and Endpoint Solutions |
$ | 16,900,639 | 64 | % | $ | 18,310,621 | 65 | % | $ | 31,994,972 | 63 | % | $ | 29,149,776 | 61 | % | ||||||||||||||||
| Advanced Solutions |
7,329,449 | 28 | 8,309,073 | 30 | 17,353,836 | 34 | 17,883,252 | 37 | ||||||||||||||||||||||||
| Cloud-based Solutions |
125,975 | 1 | 161,669 | 1 | 325,981 | 1 | 383,329 | 1 | ||||||||||||||||||||||||
| Other(1) |
2,050,806 | 7 | 1,267,340 | 4 | 1,149,701 | 2 | 624,007 | 1 | ||||||||||||||||||||||||
|
|
|
|
|
|
|
|
|
|
|
|
|
|
|
|
|
|||||||||||||||||
| Total |
$ | 26,406,869 | 100 | % | $ | 28,048,703 | 100 | % | $ | 50,824,490 | 100 | % | $ | 48,040,364 | 100 | % | ||||||||||||||||
|
|
|
|
|
|
|
|
|
|
|
|
|
|
|
|
|
|||||||||||||||||
| (1) | Other net sales consist mainly of revenues associated with our Commerce & Lifecycle Services business which was primarily disposed of and sold effective April 4, 2022. |
End-market demand across IT products in each of the geographic regions in which we operate affects the relative mix of our revenues and may lead to fluctuations in our overall profitability.
Vendors are increasingly focused on their global presence and we are consistently growing our share of the total addressable market with global vendors. Exposure to emerging markets, especially Asia-Pacific and Latin America, is
103
Table of Contents
driving higher growth and operating margin. Emerging markets typically require lower capital investment given less automation, and we experience higher operating margins due to their lower average labor costs.
Vendor Relationships
Our vendors include many of the largest tech companies, including Advanced Micro Devices, Apple, Cisco, Dell Technologies, Hewlett Packard Enterprise, HP Inc., Lenovo, Microsoft, NVIDIA and Super Micro Computer. Ingram Micros access to products, especially when supply constraints exist, is enhanced by the strength of our long-standing relationships with vendors. Vendors typically select distributors based on global reach, scale, contract terms, the strength of partnerships and service capabilities offered.
The value of our inventory is subject to risks of obsolescence and price reductions driven by vendors and by market conditions. To mitigate such risks, our vendors typically offer price protection, return rights and stock rotation privileges. We closely monitor our inventory levels and attempt to time our purchases to address demand levels while maximizing contractual protections provided by our vendors. We monitor both our inventory levels and customer demand patterns at each of our facilities and are able to stock products next to our vendors and resellers, which effectively minimizes our shipping costs.
Liquidity and Access to Capital and Credit
Our business requires investment in working capital to meet movements in demand and seasonality. Our working capital needs depend on terms and conditions established with vendors and resellers, as well as our customers ability to pay us on time, and cash conversion rates affect our overall liquidity and cash flow.
Our resellers might fail to pay their obligations in a timely manner, which could adversely affect our operations and profitability. We protect ourselves from such risks by purchasing credit insurance in many markets, as well as by only doing business with customers we believe are creditworthy. We are able to act quickly in case of failure of timely payments, such as escalating communications and credit holds.
Substantial trade credit and similar offerings from our vendors, coupled with access to our borrowing facilities and ongoing cash flows from our business, are key to financing the necessary investment in inventory and trade credit that we offer to our customers.
The cash flow profile of our business is countercyclical. In times of elevated demand, more working capital investment may be required while overall working capital investment tends to reduce in times of decreasing demand. For example, when our sales initially decreased during the onset of the COVID-19 pandemic, we experienced a reduction in overall working capital investment of more than $500 million over the second and third quarters of 2020, increasing our adjusted free cash flow significantly during that same period.
Mergers and acquisitions are a core part of our business strategy, leading to elevated leverage from time to time. However, given our consistent and predictable cash flow generation, we are able to adequately manage our leverage profile. We are dependent on external sources of capital to fund our business, but also use internally generated cash flow as a significant source of funding.
As of June 29, 2024, we had $3,500 million available under our $3,500 million ABL Revolving Credit Facility, which, if borrowed, can be used to fund any such working capital needs or to fund any of our business strategies.
Supply Constraints
Our future success is dependent on the health of our global supply chain. We have a large presence across North America, Europe and the Middle East, Asia-Pacific and Latin America, and any supply constraints can disrupt our global operations. Disruptions in local or international supply chains can cause significant delays, impacting inventory levels across our facilities. Supply chain constraints can also cause product prices and related fulfillment expenses to increase as well as prices we charge our customers.
104
Table of Contents
As one of the largest technology distributors in the world, our strong relationships with vendors globally allow us to access a broad range of products. This global presence and breadth of offerings helps insulate our operations from potential impacts to our local and international supply chains. For example, during the supply constraints experienced most prominently during 2022, we were able to secure favorable allocations of product from our vendors when product became available, or in some cases we were able to offer alternatives that could be sourced more rapidly.
Impact of Labor, Warehousing, Transportation and Other Fulfillment Costs
Our business is impacted by increases in labor, warehousing, transportation and other fulfillment costs. In periods of labor shortages, our operating costs typically increase. While increasing costs associated with labor shortages can impact profitability, we have developed a number of initiatives to mitigate the impact on our profitability. Our flexible workforce structure comprising a mix of temporary and permanent associates, allows us to modulate our local workforces based on demand, including typical seasonality. Furthermore, our extensive operating history, as well as our global scale provide us with access to local and international carriers to secure critical volume discounts that help offset the impact of increasing transportation costs.
Seasonality
We experience some seasonal fluctuations in demand in our business. For instance, we typically see lower demand, particularly in Europe, during the summer months. Additionally, we also experience an increase in demand in the fourth quarter, driven primarily by typical enterprise budgeting cycles in our client and endpoint solutions business and the pre-holiday impacts of stocking in the retail channel and associated higher logistics-based fulfillment fees. These seasonal fluctuations have historically impacted our revenue and working capital including receivables, payables and inventory. Our extensive experience combined with a flexible workforce allows us to modulate our operations and workforce demand fluctuations throughout the year.
Foreign Currency Fluctuations
We are exposed to the impact of foreign currency fluctuations and interest rate changes due to our international sales and global funding. In the normal course of business, we employ established policies and procedures to manage our exposure to fluctuations in the value of foreign currencies using a variety of financial instruments. It is our policy to utilize financial instruments to reduce risks where internal netting cannot be effectively employed and not to enter into foreign currency or interest rate transactions for speculative purposes.
As our international operations constitute a significant portion of our consolidated net sales, they are subject to fluctuations in the U.S. dollar against foreign currencies. In order to provide a framework for assessing our financial performance we exclude the effect of foreign currency fluctuations for certain periods by comparing the percent change in net sales and other key metrics on a constant currency basis. These key metrics on a constant currency basis are not GAAP financial measures. Amounts presented on a constant currency basis remove the impact of changes in exchange rates between the U.S. dollar and the local currencies of our foreign subsidiaries by translating the current period amounts into U.S. dollars using the same foreign currency exchange rates that were used to translate the amounts for the previous comparable period.
Our foreign currency risk management objective is to protect our earnings and cash flows resulting from sales, purchases and other transactions from the adverse impact of exchange rate movements. Foreign exchange risk is managed by using forward contracts to offset exchange risk associated with receivables and payables. We generally maintain hedge coverage between minimum and maximum percentages. During 2023, hedged transactions were denominated in U.S. dollars, Canadian dollars, euros, British pounds, Danish krone, Hungarian forint, Israeli shekel, Norwegian kroner, Swedish krona, Swiss francs, Polish zloty, South African rand, Australian dollars, Japanese yen, New Zealand dollars, Singapore dollars, Bulgarian lev, Czech koruna, Hong Kong dollars, Romanian leu, Brazilian real, Colombian pesos, Chilean pesos, Indian rupee, Chinese yuan, Turkish lira, Moroccan dirham, Thai baht, Malaysian ringgit and Indonesian rupiah.
105
Table of Contents
Components of Results of Operations
Net Sales
We are one of the largest distributors of technology hardware, software and services worldwide, including a leading global presence in cloud, based on revenues. We offer a broad range of IT products and services to help generate demand and create efficiencies for our customers and suppliers around the world. We serve as an integral link in the global technology value chain, driving sales and profitability for the worlds leading technology companies, resellers, mobile network operators and other customers. Our results of operations have been, and will continue to be, directly affected by the conditions in the economy in general.
Gross Margin
The technology distribution industry in which we operate is characterized by narrow gross profit as a percentage of net sales, or gross margin. Historically, our margins have also been impacted by pressures from price competition and declining average selling prices, as well as changes in vendor terms and conditions, including, but not limited to, variations in vendor rebates and incentives, our ability to return inventory to vendors and time periods qualifying for price protection. We expect competitive pricing pressures and restrictive vendor terms and conditions to continue in the foreseeable future. In addition, our margins have been and may continue to be impacted by our inventory levels which are based on projections of future demand, product availability, product acceptance and marketability and market conditions. Any sudden decline in demand and/or rapid technological changes in products could cause us to have a charge for excess and/or obsolete inventory. Likewise, in times of heavy demand or when supply constraints become significant, prices for certain technology products will tend to increase. To manage our profitability, we have implemented changes to and continue to refine our pricing strategies, inventory management processes and vendor engagement programs. In addition, we continuously monitor and work to change, as appropriate, certain terms, conditions and credit offered to our customers to reflect those being imposed by our vendors, to recover costs and/or to facilitate sales opportunities. We have also strived to improve our profitability through diversification of product offerings, including our presence in adjacent product categories, such as enterprise computing, data center and automatic identification/data capture and point-of-sale (DC / POS). Additionally, we continue to expand our capabilities in what we believe are faster growing and higher margin service-oriented businesses, including cloud and hybrid cloud/on-premise solutions.
Selling, General and Administrative Expenses
Another key area for our overall profitability management is the monitoring and control of our level of SG&A expenses. On an ongoing basis, we regularly look to optimize and drive efficiencies throughout our operations, which includes the use of temporary workforce to address staffing needs particularly in our warehouse operations where demand levels are more impactful on workloads. SG&A expenses also include the cost of investment in certain initiatives to accelerate growth and profitability and optimize our operations following the Imola Mergers. We continue to increase our presence in cloud which generally has higher gross margins but also requires higher automation and investment in commerce and other platforms to address its respective end markets.
Restructuring Costs
We have instituted a number of cost reduction and profit enhancement programs over the years, which in certain years included reorganization actions across various parts of our business to respond to changes in the economy and to further enhance productivity and profitability. These actions have included the rationalization and re-engineering of certain roles and processes, resulting in the reduction of headcount and consolidation of certain facilities.
106
Table of Contents
Merger-Related Costs
Merger-related costs consist of commitment fees, placement fees and other transaction costs for advisory and professional fees related to the Imola Mergers.
Foreign Currency Translation
The financial statements of our foreign subsidiaries for which the functional currency is the local currency are translated into U.S. dollars using (i) the exchange rate at each balance sheet date for assets and liabilities and (ii) an average exchange rate for each period for statement of income items. Translation adjustments are recorded in accumulated other comprehensive income, a component of stockholders equity. The functional currency of a small number of operations within our EMEA, Asia-Pacific and Latin America regions is the U.S. dollar; accordingly, the monetary assets and liabilities of these subsidiaries are remeasured into U.S. dollars at the exchange rate in effect at the applicable balance sheet date. Revenues, expenses, gains or losses are remeasured at the average exchange rate for the period and nonmonetary assets and liabilities are remeasured at historical rates. The resultant remeasurement gains and losses of these operations, as well as gains and losses from foreign currency transactions are included in the consolidated statements of income of Ingram Micro.
Working Capital and Debt
The IT products distribution business is working capital intensive. Our business requires significant levels of working capital, primarily trade accounts receivable and inventory, which is partially financed by vendor trade accounts payable. For our working capital needs, we rely heavily on trade credit from vendors, and also on trade accounts receivable financing programs and proceeds from debt facilities. We maintain a strong focus on management of working capital in order to maximize returns on investment, cash provided by operations and our debt and cash levels. However, our debt and/or cash levels may fluctuate significantly on a day-to-day basis due to the timing of customer receipts, inventory, stocking levels and periodic payments to vendors. A higher concentration of payments received from customers toward the end of each month, combined with the timing of payments we make to our vendors, typically yields lower debt balances and higher cash balances at our quarter-ends than is the case throughout the quarter or year. Our future debt requirements may increase and/or our cash levels may decrease to support growth in our overall level of business, changes in our required working capital profile or to fund acquisitions or other investments in the business.
Results of Operations
We do not allocate cash-based compensation expense (see Note 11, Employee Awards, to our audited consolidated financial statements and Note 3, Employee Awards, to our unaudited condensed consolidated financial statements), certain Corporate costs, including merger-related costs to our operating segments and the gain from the CLS Sale; therefore, we are reporting these amounts separately. The following tables set forth our net sales by reportable segment and the percentage of total net sales represented thereby, as well as income from operations and income from operations margin by reportable segment for each of the periods indicated.
107
Table of Contents
The following tables set forth our historical results of operations for the periods indicated below:
Annual and Interim Results of Operations
| Predecessor | Successor | Combined | Successor | |||||||||||||||||||||||||||||
| Predecessor 2021 Period |
Successor 2021 Period |
Unaudited Pro Forma Combined 2021 Period |
Fiscal Year 2022 |
Fiscal Year 2023 |
Unaudited 2023 Interim Period |
Unaudited 2024 Interim Period |
||||||||||||||||||||||||||
| (Amounts in thousands) | Period from January 3, 2021 to July 2, 2021 |
Period from July 3, 2021 to January 1, 2022 |
Fiscal Year Ended January 1, 2022 |
Year Ended December 31, 2022 |
Year Ended December 30, 2023 |
Twenty-six Weeks Ended July 1, 2023 |
Twenty-six Weeks Ended June 29, 2024 |
|||||||||||||||||||||||||
| Consolidated Statement of Income Data: |
||||||||||||||||||||||||||||||||
| Net sales |
$ | 26,406,869 | $ | 28,048,703 | $ | 54,455,572 | $ | 50,824,490 | $ | 48,040,364 | $ | 23,095,490 | $ | 22,876,373 | ||||||||||||||||||
| Cost of sales |
24,419,489 | 25,925,610 | 50,345,099 | 47,131,098 | 44,493,227 | 21,381,857 | 21,213,005 | |||||||||||||||||||||||||
|
|
|
|
|
|
|
|
|
|
|
|
|
|
|
|||||||||||||||||||
| Gross profit |
1,987,380 | 2,123,093 | 4,110,473 | 3,693,392 | 3,547,137 | 1,713,633 | 1,663,368 | |||||||||||||||||||||||||
|
|
|
|
|
|
|
|
|
|
|
|
|
|
|
|||||||||||||||||||
| Operating expenses (income): |
||||||||||||||||||||||||||||||||
| Selling, general and administrative |
1,459,364 | 1,684,170 | 3,203,846 | 2,716,234 | 2,583,993 | 1,312,794 | 1,289,594 | |||||||||||||||||||||||||
| Merger-related costs |
2,314 | 114,332 | 116,646 | 1,910 | | | | |||||||||||||||||||||||||
| Restructuring costs |
202 | 831 | 1,033 | 10,138 | 18,797 | (171 | ) | 22,525 | ||||||||||||||||||||||||
| Gain on CLS Sale |
| | | (2,283,820 | ) | | | | ||||||||||||||||||||||||
|
|
|
|
|
|
|
|
|
|
|
|
|
|
|
|||||||||||||||||||
| Total operating expenses |
1,461,880 | 1,799,333 | 3,321,525 | 444,462 | 2,602,790 | 1,312,623 | 1,312,119 | |||||||||||||||||||||||||
|
|
|
|
|
|
|
|
|
|
|
|
|
|
|
|||||||||||||||||||
| Income from operations |
525,500 | 323,760 | 788,948 | 3,248,930 | 944,347 | 401,010 | 351,249 | |||||||||||||||||||||||||
|
|
|
|
|
|
|
|
|
|
|
|
|
|
|
|||||||||||||||||||
| Other (income) expense: |
||||||||||||||||||||||||||||||||
| Interest income |
(11,744 | ) | (6,306 | ) | (18,050 | ) | (22,911 | ) | (34,977 | ) | (16,381 | ) | (20,365 | ) | ||||||||||||||||||
| Interest expense |
44,281 | 183,208 | 312,642 | 320,230 | 380,191 | 186,430 | 171,536 | |||||||||||||||||||||||||
| Net foreign currency exchange loss |
1,419 | 17,473 | 18,892 | 69,597 | 42,070 | 29,103 | 19,263 | |||||||||||||||||||||||||
| Other (income) expense |
(13,410 | ) | 12,628 | (782 | ) | 67,473 | 34,562 | 12,497 | 20,971 | |||||||||||||||||||||||
|
|
|
|
|
|
|
|
|
|
|
|
|
|
|
|||||||||||||||||||
| Total other (income) expense |
20,546 | 207,003 | 312,702 | 434,389 | 421,846 | 211,649 | 191,405 | |||||||||||||||||||||||||
|
|
|
|
|
|
|
|
|
|
|
|
|
|
|
|||||||||||||||||||
| Income before income taxes |
504,954 | 116,757 | 476,246 | 2,814,541 | 522,501 | 189,361 | 159,844 | |||||||||||||||||||||||||
| Provision for income taxes |
126,479 | 20,023 | 110,136 | 420,052 | 169,789 | 59,956 | 55,707 | |||||||||||||||||||||||||
|
|
|
|
|
|
|
|
|
|
|
|
|
|
|
|||||||||||||||||||
| Net income |
$ | 378,475 | $ | 96,734 | $ | 366,110 | $ | 2,394,489 | $ | 352,712 | $ | 129,405 | $ | 104,137 | ||||||||||||||||||
|
|
|
|
|
|
|
|
|
|
|
|
|
|
|
|||||||||||||||||||
Results of Operations for the Unaudited 2023 Interim Period (Successor) and Unaudited 2024 Interim Period (Successor) (Amounts in thousands):
| Successor | ||||||||||||||||||||||||
|
Unaudited 2023 Interim Period |
Unaudited 2024 Interim Period |
Change Increase (Decrease) |
||||||||||||||||||||||
|
Twenty-Six Weeks Ended July 1, 2023 |
Twenty-Six Weeks Ended June 29, 2024 |
Amount | Percentage | |||||||||||||||||||||
| Net sales by reportable segment |
||||||||||||||||||||||||
| North America |
$ | 9,111,039 | 39 | % | $ | 8,420,643 | 37 | % | $ | (690,396 | ) | (7.6 | )% | |||||||||||
| EMEA |
6,881,232 | 30 | 6,724,163 | 29 | (157,069 | ) | (2.3 | ) | ||||||||||||||||
| Asia-Pacific |
5,337,174 | 23 | 6,007,137 | 26 | 669,963 | 12.6 | ||||||||||||||||||
| Latin America |
1,766,045 | 8 | 1,724,430 | 8 | (41,615 | ) | (2.4 | ) | ||||||||||||||||
|
|
|
|
|
|
|
|
|
|
|
|||||||||||||||
| Total |
$ | 23,095,490 | 100 | % | $ | 22,876,373 | 100 | % | $ | (219,117 | ) | (0.9 | )% | |||||||||||
|
|
|
|
|
|
|
|
|
|
|
|||||||||||||||
108
Table of Contents
| Successor | ||||||||||||||||||||||||
|
Unaudited 2023 Interim Period |
Unaudited 2024 Interim Period |
Change Increase (Decrease) |
||||||||||||||||||||||
|
Twenty-Six Weeks Ended July 1, 2023 |
Twenty-Six Weeks Ended June 29, 2024 |
Amount | Percentage | |||||||||||||||||||||
| Income from operations and operating margin |
Income from Operations |
Income from Operations Margin |
Income from Operations |
Income from Operations Margin |
Income from Operations |
Income from Operations Margin |
||||||||||||||||||
| North America |
$ | 146,323 | 1.61 | % | $ | 123,644 | 1.47 | % | $ | (22,679 | ) | (0.14 | )% | |||||||||||
| EMEA |
138,157 | 2.01 | 101,646 | 1.51 | (36,511 | ) | (0.50 | ) | ||||||||||||||||
| Asia-Pacific |
114,819 | 2.15 | 111,827 | 1.86 | (2,992 | ) | (0.29 | ) | ||||||||||||||||
| Latin America |
39,376 | 2.23 | 47,716 | 2.77 | 8,340 | 0.54 | ||||||||||||||||||
| Corporate |
(18,327 | ) | | (21,339 | ) | | (3,012 | ) | | |||||||||||||||
| Cash-based compensation expense |
(19,338 | ) | | (12,245 | ) | | 7,093 | | ||||||||||||||||
|
|
|
|
|
|
|
|||||||||||||||||||
| Total |
$ | 401,010 | 1.74 | % | $ | 351,249 | 1.54 | % | $ | (49,761 | ) | (0.20 | )% | |||||||||||
|
|
|
|
|
|
|
|||||||||||||||||||
| Successor | ||||||||
|
Unaudited 2023 Interim Period |
Unaudited 2024 Interim Period |
|||||||
|
Twenty-Six Weeks Ended July 1, 2023 |
Twenty-Six Weeks Ended June 29, 2024 |
|||||||
| Net sales |
100.00 | % | 100.00 | % | ||||
| Cost of sales |
92.58 | 92.73 | ||||||
|
|
|
|
|
|||||
| Gross profit |
7.42 | 7.27 | ||||||
| Operating expenses: |
||||||||
| Selling, general and administrative |
5.68 | 5.64 | ||||||
| Restructuring costs |
| 0.10 | ||||||
|
|
|
|
|
|||||
| Income from operations |
1.74 | 1.54 | ||||||
| Total other (income) expense |
0.92 | 0.84 | ||||||
|
|
|
|
|
|||||
| Income before income taxes |
0.82 | 0.70 | ||||||
| Provision for income taxes |
0.26 | 0.24 | ||||||
|
|
|
|
|
|||||
| Net income |
0.56 | % | 0.46 | % | ||||
|
|
|
|
|
|||||
Consolidated net sales were $22,876,373 for the Unaudited 2024 Interim Period (Successor) compared to $23,095,490 for the Unaudited 2023 Interim Period (Successor). The 0.9% decrease in our consolidated net sales for the Unaudited 2024 Interim Period (Successor) compared to the Unaudited 2023 Interim Period (Successor), was primarily a result of lower net sales in our North America, EMEA and Latin America regions, partially offset by growth in our Asia-Pacific region. The Unaudited 2024 Interim Period (Successor) saw lower volume compared to the Unaudited 2023 Interim Period (Successor), particularly in advanced solutions offerings resulting from the fulfillment of significant product backlogs that benefited net sales in the Unaudited 2023 Interim Period (Successor). Advanced solutions offerings declined by 7% globally and net sales of Other services declined by 2% globally. These declines were partially offset by growth of 3% globally in net sales of client and endpoint solutions, as well as growth of 30% in net sales of our cloud-based solutions. The translation impact of foreign currencies relative to the U.S. dollar negatively impacted the comparison of our global net sales year-over-year by approximately 0.3%.
The $690,396, or 7.6%, decrease in our North American net sales for the Unaudited 2024 Interim Period (Successor) compared to the Unaudited 2023 Interim Period (Successor), was primarily driven by a decline of 14% in net sales of advanced solutions offerings attributed to declines in networking solutions in the United States and Canada, which includes a challenging prior year comparison due to heavy backlog fulfillment in the prior year as noted above, as well as declines in net sales of DC / POS and audio visual and digital signage in the United States. Net sales of client and endpoint solutions also declined by 3% attributed to declines in mobility distribution, particularly in smartphones in the United States. These factors were partially offset by growth of
109
Table of Contents
27% in net sales of cloud-based solutions, as well as growth of 3% in net sales of Other services in the Unaudited 2024 Interim Period (Successor) compared to the Unaudited 2023 Interim Period (Successor).
The $157,069, or 2.3%, decrease in EMEA net sales for the Unaudited 2024 Interim Period (Successor) compared to the Unaudited 2023 Interim Period (Successor) was primarily driven by a 9% decline in net sales of advanced solutions offerings due to declines in networking in Germany and the United Kingdom. Specialty offerings also declined in the region, attributed to DC / POS declines in Germany and the United Kingdom. Additionally, net sales of Other services declined by 6% in the Unaudited 2024 Interim Period (Successor) compared to the Unaudited 2023 Interim Period (Successor). These results were partially offset by growth of 2% in net sales of client and endpoint solutions in the Unaudited 2024 Interim Period (Successor) compared to the Unaudited 2023 Interim Period (Successor), driven by growth in mobility distribution, particularly smartphones in the United Kingdom, as well as notebooks in the Netherlands, Sweden and the United Kingdom. Additionally, net sales of cloud-based solutions increased by 21% year-over-year in the region. The translation impact of foreign currencies relative to the U.S. dollar had a positive impact of approximately 1% on the year-over-year comparison of the regions net sales. On a constant currency basis, net sales for advanced solutions offerings declined by 10%, Other services declined by 8% while client and endpoint solutions increased by 2% and cloud-based solutions increased by 20%.
The $669,963, or 12.6%, increase in Asia-Pacific net sales for the Unaudited 2024 Interim Period (Successor) compared to the Unaudited 2023 Interim Period (Successor) was primarily driven by double-digit net sales growth in client and endpoint solutions, advanced solutions offerings and cloud-based solutions. Net sales of client and endpoint solutions increased 11% in the Unaudited 2024 Interim Period (Successor) compared to the Unaudited 2023 Interim Period (Successor), primarily as a result of growth in mobility distribution, particularly smartphones in China and India. Net sales of advanced solutions offerings increased by 16%, which was driven by growth in server net sales in India and Singapore, as well as growth in infrastructure software net sales in Hong Kong. Additionally, net sales of cloud-based solutions increased by 26% year-over-year, led by growth in Australia. These results were slightly offset by a 32% decline in net sales of Other services. The translation impact of foreign currencies relative to the U.S. dollar had a negative impact of approximately 2% on the year-over-year comparison of the regions net sales. On a constant currency basis, net sales for client and endpoint solutions increased by 14%, advanced solutions offerings increased by 18%, cloud-based solutions increased by 29%, while Other services declined by 30%.
The $41,615, or 2.4%, decrease in Latin American net sales for the Unaudited 2024 Interim Period (Successor) compared to the Unaudited 2023 Interim Period (Successor) was primarily driven by a 2% decrease in net sales of client and endpoint solutions, which was driven by declines in mobility distribution, particularly smartphones in Miami Export and Mexico. Additionally, net sales of advanced solutions offerings declined by 4% year-over-year in the region as a result of declines in networking in Brazil and Mexico. These results were partially offset by growth of 73% in net sales of cloud-based solutions, driven by strong results in Brazil. The translation impact of foreign currencies relative to the U.S. dollar had a positive impact of approximately 1% on the year-over-year comparison of the regions net sales. On a constant currency basis, net sales for client and endpoint solutions declined by 3%, advanced solutions offerings declined by 7%, while cloud-based solutions increased by 72%.
Gross profit was $1,663,368 for the Unaudited 2024 Interim Period (Successor), compared to $1,713,633 for the Unaudited 2023 Interim Period (Successor). Gross margin decreased by 15 basis points in the Unaudited 2024 Interim Period (Successor) compared to the Unaudited 2023 Interim Period (Successor). The decrease in gross profit dollars was primarily attributable to the previously described declines in our net sales. The 15 basis point decrease in gross margin was driven primarily by a shift in sales mix away from our higher-margin advanced solutions offerings to lower-margin client and endpoint solutions in North America and EMEA, as well as an overall shift in net sales mix towards our lower gross margin, but lower cost-to-serve, Asia Pacific region during the Unaudited 2024 Interim Period (Successor) compared to the Unaudited 2023 Interim Period (Successor). These factors were partially offset by the translation impact of foreign currencies relative to the U.S. dollar, which had a positive impact of 2 basis points on the year-over-year comparison of gross margin.
110
Table of Contents
Total SG&A expenses decreased $23,029, and decreased by 4 basis points of net sales in the Unaudited 2024 Interim Period (Successor) compared to the Unaudited 2023 Interim Period (Successor). The decrease in SG&A dollars is driven by decreases in compensation and headcount expenses of $12,772, driven by the efforts taken under our global restructuring plan further described below. Additionally, professional and outside service costs decreased $8,936, bad debt expense decreased $7,530 and shipping and supply costs decreased $2,253. These decreases were partially offset by an increase in software-related costs of $3,009. Additionally, the prior year period includes a one-time benefit of $5,261 related to a legal settlement. The translation impact of foreign currencies relative to the U.S. dollar had a negative impact of 1 basis point on the year-over-year comparison of SG&A as a percentage of net sales.
During the Unaudited 2024 Interim Period (Successor), we recorded restructuring costs of $22,525, or 0.1% of net sales. Such costs represented further efforts taken under our global restructuring plan originally announced in July 2023, and for which many actions were taken in the third quarter of the prior year. The charges in the current year included organizational and staffing changes as well as headcount reductions during the first quarter of 2024. This global restructuring plan is expected to deliver annual incremental savings in the range of $90 million and $100 million, for which full run rate savings will be achieved in the third quarter of 2024, but is not inclusive of other efforts to manage headcount costs through normal attrition and management of discretionary operating expenses.
Income from operations was $351,249, or 1.54%, of net sales in the Unaudited 2024 Interim Period (Successor), compared to $401,010, or 1.74% of net sales, in the Unaudited 2023 Interim Period (Successor). The 20 basis point year-over-year decrease in income from operations margin was primarily due to $22,525, or 10 basis points as a percentage of net sales, of restructuring costs, as well as the decrease in gross margin described above. This was partially offset by the decrease in SG&A expenses as a percentage of net sales described above. The translation impact of foreign currencies relative to the U.S. dollar had no impact on the year-over-year comparison of our consolidated income from operations margin.
Our North American income from operations margin decreased 14 basis points in the Unaudited 2024 Interim Period (Successor) compared to the Unaudited 2023 Interim Period (Successor) primarily due to SG&A expenses as a percentage of the lower net sales base in the Unaudited 2024 Interim Period (Successor) as described above. Most notably, compensation and headcount expenses increased by 16 basis points of net sales, restructuring costs increased by 9 basis points due to the global program noted above and software-related costs increased by 6 basis points. This was slightly offset by a reduction in professional and outside service costs of 7 basis points, as well as an increase in gross margin of 5 basis points in the region, driven by a higher mix of cloud-based solutions net sales in the Unaudited 2024 Interim Period (Successor) compared to the Unaudited 2023 Interim Period (Successor).
Our EMEA income from operations margin decreased 50 basis points in the Unaudited 2024 Interim Period (Successor) compared to the Unaudited 2023 Interim Period (Successor), primarily due to an increase in SG&A expenses as a percentage of the lower net sales in the region as described above. Most notably, restructuring costs increased by 17 basis points of net sales, compensation and headcount expenses increased by 12 basis points, rental and occupancy costs increased by 2 basis points and other miscellaneous expenses increased by 2 basis points. Additionally, the regions gross margin declined 15 basis points primarily as a result of a shift in sales mix away from our higher-margin advanced solutions offerings to lower-margin client and endpoint solutions during the Unaudited 2024 Interim Period (Successor) compared to the Unaudited 2023 Interim Period (Successor). The EMEA region also benefited from strong margin performance and vendor programs on product categories for which there was significant backlog fulfillment occurring in the prior year, as supply constraints eased. The translation impact of foreign currencies relative to the U.S. dollar had a positive impact of 1 basis point on the year-over-year comparison of the regions income from operations margin.
Our Asia-Pacific income from operations margin decreased 14 basis points in the Unaudited 2024 Interim Period (Successor) compared to the Unaudited 2023 Interim Period (Successor), primarily as a result of lower gross margin achievement for client and endpoint solutions as well as advanced solutions net sales, a part of which is driven by geographic mix of sales growth within the region falling more predominantly in lower margin and lower cost-to-serve territories. These factors contributed to a 44 basis point negative impact on income from operations
111
Table of Contents
margin. This was partially offset by favorable SG&A expenses as a percentage of net sales; most notably, compensation and headcount expenses decreased by 24 basis points of net sales and bad debt expense decreased by 4 basis points of net sales. The translation impact of foreign currencies relative to the U.S. dollar had no impact on the year-over-year comparison of the regions income from operations margin.
Our Latin American income from operations margin increased 54 basis points in the Unaudited 2024 Interim Period (Successor) compared to the Unaudited 2023 Interim Period (Successor), primarily as a result of higher gross margin achievement across most product categories, which contributed to a positive impact to income from operations of 93 basis points of net sales. This was partially offset by an increase in SG&A expenses as a percentage of the lower net sales in the current year. Compensation and headcount expenses increased by 49 basis points, other miscellaneous expenses increased by 8 basis points and rental and occupancy costs increased by 6 basis points. Additionally, the prior year period also included a one- time benefit of 12 basis points related to a legal settlement. These increases in SG&A were slightly offset by a decrease in bad debt expense of 41 basis points as the previous period was impacted by aging receivable balances related to a single project. The translation impact of foreign currencies relative to the U.S. dollar had a negative impact of 5 basis points on the year-over- year comparison of the regions income from operations margin.
In the Unaudited 2024 Interim Period (Successor), Corporate included $12,500 of advisory fees paid to Platinum Advisors and $4,924 related to investments in certain initiatives to accelerate our growth and profitability and optimize our operations. In the Unaudited 2023 Interim Period (Successor), Corporate costs consisted primarily of $12,500 of advisory fees paid to Platinum Advisors and $3,450 related to investments in certain initiatives to accelerate growth and profitability and optimize our operations.
Cash-based compensation expense decreased by $7,093 in the Unaudited 2024 Interim Period (Successor) compared to the Unaudited 2023 Interim Period (Successor) primarily due to over-achievement of performance targets in the Unaudited 2023 Interim Period (Successor).
Total other (income) expense consists primarily of interest income, interest expense, foreign currency exchange gains and losses, and other non-operating gains and losses. We incurred total other (income) expense of $191,405 in the Unaudited 2024 Interim Period (Successor) compared to $211,649 in the Unaudited 2023 Interim Period (Successor). The decrease is largely driven by lower interest expense of $14,894 primarily as a result of lower average debt outstanding in the current year period, due in particular to $705,000 in voluntary principal payments on our Term Loan Credit Facility made since June 2023, including a recent $150,000 payment in June 2024. The decrease was also driven by a decrease of $9,840 in net foreign currency exchange loss. Additionally, we recorded a gain of $2,536 related to an equity investment in the Unaudited 2024 Interim Period (Successor) compared to a loss of $3,672 in the Unaudited 2023 Interim Period (Successor). These factors were partially offset by an increase of $7,865 in trade accounts receivable factoring fees in the Unaudited 2024 Interim Period (Successor) compared to Unaudited 2023 Interim Period (Successor).
We recorded an income tax provision of $55,707, or an effective tax rate of 34.9%, in the Unaudited 2024 Interim Period (Successor), compared to $59,956, or an effective tax rate of 31.7%, in the Unaudited 2023 Interim Period (Successor). The tax provision for the Unaudited 2024 Interim Period (Successor) included $5,926 of tax expense, or 3.7 percentage points of the effective tax rate, which is associated with withholding tax expense from our business operations in the Latin America region, primarily from our Miami Export business. In addition, the tax provision for the Unaudited 2024 Interim Period (Successor) included $1,945 of tax expense, or 1.2% of the effective tax rate, due to foreign exchange losses generated by a foreign subsidiary that is currently under valuation allowance. The tax provision for the Unaudited 2024 Interim Period (Successor) also included $1,678 of tax expense, or 1.0% of the effective tax rate, due to a reduction in estimated U.S. foreign tax credit utilization in 2024. The tax provision for the Unaudited 2023 Interim Period (Successor) included $3,686 of tax expense, or 1.9 percentage points of the effective tax rate, which is associated with withholding tax expense from our business operations in the Latin America region, primarily from our Miami Export business. The tax provision for the Unaudited 2023 Interim Period (Successor) also included $2,180 of tax expense, or 1.2% of the effective tax rate, due to a reduction in estimated U.S. foreign tax credit utilization in 2023.
112
Table of Contents
Results of Operations for the Fiscal Year 2022 (Successor) and Fiscal Year 2023 (Successor) (Amounts in thousands):
| Successor | ||||||||||||||||||||||||
| Fiscal Year 2022 | Fiscal Year 2023 | Change - Increase (Decrease) |
||||||||||||||||||||||
|
Year Ended December 31, 2022 |
Year Ended December 30, 2023 |
Amount | Percentage | |||||||||||||||||||||
| Net sales by reportable segment |
||||||||||||||||||||||||
| North America |
$ | 20,908,493 | 41 | % | $ | 18,195,652 | 38 | % | $ | (2,712,841 | ) | (13.0 | )% | |||||||||||
| EMEA |
15,052,242 | 30 | 14,481,069 | 30 | (571,173 | ) | (3.8 | ) | ||||||||||||||||
| Asia-Pacific |
11,184,575 | 22 | 11,573,489 | 24 | 388,914 | 3.5 | ||||||||||||||||||
| Latin America |
3,679,180 | 7 | 3,790,154 | 8 | 110,974 | 3.0 | ||||||||||||||||||
|
|
|
|
|
|
|
|
|
|
|
|||||||||||||||
| Total |
$ | 50,824,490 | 100 | % | $ | 48,040,364 | 100 | % | $ | (2,784,126 | ) | (5.5 | )% | |||||||||||
|
|
|
|
|
|
|
|
|
|
|
|||||||||||||||
| Successor | ||||||||||||||||||||||||
| Fiscal Year 2022 | Fiscal Year 2023 | |||||||||||||||||||||||
|
Year Ended December 31, 2022 |
Year Ended December 30, 2023 |
Change - Increase (Decrease) |
||||||||||||||||||||||
| Income from operations and operating |
Income from Operations |
Operating Margin |
Income from Operations |
Operating Margin |
Income from Operations |
Operating Margin |
||||||||||||||||||
| North America |
$ | 414,128 | 1.98 | % | $ | 350,850 | 1.93 | % | $ | (63,278 | ) | (0.05 | )% | |||||||||||
| EMEA |
314,823 | 2.09 | 317,199 | 2.19 | 2,376 | 0.10 | ||||||||||||||||||
| Asia-Pacific |
230,494 | 2.06 | 247,143 | 2.14 | 16,649 | 0.08 | ||||||||||||||||||
| Latin America |
113,473 | 3.08 | 93,515 | 2.47 | (19,958 | ) | (0.61 | ) | ||||||||||||||||
| Gain on CLS Sale |
2,283,820 | | | | (2,283,820 | ) | | |||||||||||||||||
| Corporate |
(72,390 | ) | | (33,320 | ) | | 39,070 | | ||||||||||||||||
| Cash-based compensation expense |
(35,418 | ) | | (31,040 | ) | | 4,378 | | ||||||||||||||||
|
|
|
|
|
|
|
|||||||||||||||||||
| Total |
$ | 3,248,930 | 6.39 | % | $ | 944,347 | 1.97 | % | $ | (2,304,583 | ) | (4.42 | )% | |||||||||||
|
|
|
|
|
|
|
|||||||||||||||||||
| Successor | Successor | |||||||
| Fiscal Year 2022 | Fiscal Year 2023 | |||||||
|
Year Ended 2022 December 31, 2022 |
Year Ended 2023 December 30, 2023 |
|||||||
| Net sales |
100.00 | % | 100.00 | % | ||||
| Cost of sales |
92.73 | 92.62 | ||||||
|
|
|
|
|
|||||
| Gross profit |
7.27 | 7.38 | ||||||
| Operating expenses: |
||||||||
| Selling, general and administrative |
5.34 | 5.38 | ||||||
| Merger-related costs |
0.00 | | ||||||
| Restructuring costs |
0.02 | 0.04 | ||||||
| Gain on CLS Sale |
(4.49 | ) | | |||||
|
|
|
|
|
|||||
| Income from operations |
6.39 | 1.97 | ||||||
| Total other (income) expense |
0.85 | 0.88 | ||||||
|
|
|
|
|
|||||
| Income before income taxes |
5.54 | 1.09 | ||||||
| Provision for income taxes |
0.83 | 0.35 | ||||||
|
|
|
|
|
|||||
| Net income |
4.71 | % | 0.73 | % | ||||
|
|
|
|
|
|||||
113
Table of Contents
Consolidated net sales were $48,040,364 for Fiscal Year 2023 (Successor) compared to $50,824,490 for Fiscal Year 2022 (Successor). The 5.5% decrease in our consolidated net sales for Fiscal Year 2023 (Successor) compared to Fiscal Year 2022 (Successor), includes $399,200, or 0.8%, driven by the CLS Sale, the majority of which closed on April 4, 2022. The remaining 4.7% decrease was the result of lower net sales in our North America and EMEA regions, partially offset by growth in our Asia-Pacific and Latin America regions. Fiscal Year 2023 (Successor) saw softer demand, particularly in client and endpoint solutions, compared to a relatively more robust consumer environment during Fiscal Year 2022 (Successor), partially offset by stronger sales in advanced solutions and cloud during the more recent year. In Fiscal Year 2023 (Successor), all regions were impacted by softer demand for client and endpoint solutions, resulting in a 9% decline in consolidated net sales. Our Other services net sales declined by 46% globally as a result of the CLS Sale noted above. These declines were partially offset by growth of 3% in our advanced solutions offerings, as well as growth of 18% in our cloud-based solutions. The translation impact of foreign currencies relative to the U.S. dollar negatively impacted the comparison of our global net sales year-over-year by approximately 0.2%.
The $2,712,841, or 13.0%, decrease in our North American net sales for Fiscal Year 2023 (Successor) compared to Fiscal Year 2022 (Successor), of which $171,111, or 0.9%, relates to the CLS Sale, was primarily driven by a decline of 19% in net sales of client and endpoint solutions, attributed primarily to declines in notebooks, desktops and consumer electronic sales in the United States. Other services net sales were down 56% as a result of the CLS Sale as well as lower market demand. Additionally, advanced solutions net sales were down 1% for Fiscal Year 2023 (Successor) compared to Fiscal Year 2022 (Successor) due to declines in server offerings, as well as specialty offerings of audio visual and digital signage and unified communications categories in the United States. These factors were partially offset by growth of 7% in net sales of cloud-based solutions.
The $571,173, or 3.8%, decrease in EMEA net sales for Fiscal Year 2023 (Successor) compared to Fiscal Year 2022 (Successor) includes a year-over-year reduction in net sales of $199,983, or 1.4%, driven by the CLS Sale. Client and endpoint solutions net sales declined by 8% primarily due to declines in notebooks in Germany, the United Kingdom and Sweden, declines in peripherals in the United Kingdom, France, Germany and Italy, as well as declines in consumer electronics in Spain and Germany. Other services net sales were down 28% as a result of the CLS Sale. This was partially offset by net sales growth of 6% in advanced solutions, driven by networking, primarily in France, the United Kingdom and the Netherlands, and growth of 38% in cloud-based solutions net sales. The translation impact of foreign currencies relative to the U.S. dollar had a positive impact of approximately 2% on the regions net sales. On a constant currency basis, client and endpoint solutions net sales declined by 10%, and Other services net sales declined by 29%, while advanced solutions net sales increased by 4% and cloud-based solutions increased by 35%.
The $388,914, or 3.5%, increase in Asia-Pacific net sales for Fiscal Year 2023 (Successor) compared to Fiscal Year 2022 (Successor) includes a year-over-year reduction in net sales of $15,389, or 0.1%, driven by the CLS Sale. Client and endpoint solutions net sales increased by 3% due to growth in mobility distribution, particularly in smartphones in China and India. Advanced solutions net sales grew by 6%, driven by networking, primarily in India and China, as well as infrastructure software in Hong Kong. Cloud-based solutions net sales were also 40% higher, driven primarily by growth in Australia. These results were partially offset by a decline of 75% in Other services net sales, as a result of the CLS Sale. The translation impact of foreign currencies relative to the U.S. dollar had a negative impact of approximately 4% on the regions net sales. On a constant currency basis, client and endpoint solutions net sales increased by 9%, advanced solutions net sales increased by 10%, cloud-based solutions net sales increased by 45%, while Other services net sales declined by 74%.
The $110,974, or 3.0%, increase in Latin American net sales for Fiscal Year 2023 (Successor) compared to Fiscal Year 2022 (Successor) includes the translation impact of foreign currencies relative to the U.S. dollar, which had a positive impact on the regions net sales growth of approximately 5%. Advanced solutions net sales for the region increased by 18%, led primarily by Brazil across numerous categories of products, networking in Mexico, Chile and Peru, as well as cyber security offerings in Miami Export. Cloud-based solutions also grew by
114
Table of Contents
43%, attributed primarily to growth in Brazil and Mexico. This growth was partially offset by a decrease of 2% in client and endpoint solutions net sales, primarily driven by declines in Miami Export, Brazil, Chile and Peru. Additionally, Other services declined by 97% as a result of the CLS Sale, which resulted in a year-over-year reduction in net sales of $12,717, or 0.3%. On a constant currency basis, client and endpoint solutions net sales declined by 6% and Other services net sales declined by 97%, while advanced solutions and cloud-based solutions net sales grew by 13% and 34%, respectively.
Gross profit was $3,547,137 for Fiscal Year 2023 (Successor), compared to $3,693,392 for Fiscal Year 2022 (Successor). Gross margin increased by 11 basis points in Fiscal Year 2023 (Successor) compared to Fiscal Year 2022 (Successor). The decrease in gross profit dollars was primarily attributable to the previously described declines in our net sales. Gross margins benefited from a 15 basis point reduction in inventory reserves in Fiscal Year 2023 (Successor) compared to Fiscal Year 2022 (Successor). The translation impact of foreign currencies relative to the U.S. dollar had a positive impact of 3 basis points on the year-over-year comparison of gross margin. The remaining decline in gross margins is generally attributable to competitive pricing factors as well as geographic mix (higher sales growth in Asia Pacific and Latin American regions, where gross margins and costs to serve are both generally lower than other markets).
Total SG&A expenses decreased $132,241, or 4.9%, in Fiscal Year 2023 (Successor) compared to Fiscal Year 2022 (Successor). The decrease in SG&A dollars includes a decrease in compensation and headcount expenses of $200,707 driven by cost actions taken during the year as further discussed below. The year-over-year change is further driven by a decrease in shipping and supply costs of $21,191, a decrease in depreciation expense of $8,927 and a decrease in rental and occupancy costs of $6,562, which were primarily the result of the CLS Sale. These declines were partially offset by an increase in bad debt expense of $20,094, an increase in professional and outside service costs of $14,487 and an increase in software-related costs of $12,079. Additionally, in Fiscal Year 2023 (Successor), there were less costs allocated out of SG&A and into gross margin, primarily as a result of the CLS Sale, or were not capitalizable into applicable projects compared to Fiscal Year 2022 (Successor), which had a negative impact of $93,717 on SG&A. The translation impact of foreign currencies relative to the U.S. dollar had a negative impact of 2 basis points on the year-over-year comparison of SG&A as a percentage of net sales.
Restructuring costs were $18,797 in Fiscal Year 2023 (Successor) compared to $10,138 in Fiscal Year 2022 (Successor). Restructuring costs in Fiscal Year 2023 (Successor) represented organizational and staffing changes, including a headcount reduction, primarily in our North American operations. This restructuring plan, implemented in July 2023, is expected to deliver annual incremental savings in the range of $50 million and $60 million with some savings beginning in the third quarter and continuing into the fourth quarter of 2023, and full-year run rate savings to be realized in 2024. Restructuring costs in Fiscal Year 2022 (Successor) were primarily related to the discontinuation of our cloud-support operations in Russia. See Note 9, Restructuring Costs, to our audited consolidated financial statements and Note 8, Restructuring Costs, to our unaudited condensed consolidated financial statements.
Income from operations was $944,347, or 1.97%, of net sales in Fiscal Year 2023 (Successor), compared to $3,248,930, or 6.39%, of net sales, in Fiscal Year 2022 (Successor). The 4.42% year-over-year decrease was primarily due to the $2,283,820, or 4.49%, of net sales, gain that was recorded in conjunction with the CLS Sale in the prior year. This was partially offset by the increase in gross margin described above. The translation impact of foreign currencies relative to the U.S. dollar had a positive impact of 1 basis point on the year-over-year comparison of our consolidated income from operations margin.
Our North American income from operations margin decreased 5 basis points in Fiscal Year 2023 (Successor) compared to Fiscal Year 2022 (Successor) primarily due to an increase in SG&A expenses as a percentage of net sales in the region; most notably, an increase of 16 basis points of net sales in professional and outside service costs. Compensation and headcount expenses as a percentage of net sales increased by 10 basis points due to merit increases on existing headcount, partially offset by the positive impact of headcount reduction
115
Table of Contents
actions, although these impacts were not fully realized until late in the year. Other miscellaneous expenses also increased by 8 basis points primarily due to stranded costs resulting from the termination of certain services under the TSA agreement with CMA CGM Group. These were partially offset by lower bad debt expense of 6 basis points as well as lower shipping and supply costs of 4 basis points. Additionally, the region experienced higher gross margin on favorable product mix, as well as a reduction in inventory reserves. These factors had a combined positive impact of 13 basis points of net sales.
Our EMEA income from operations margin increased 10 basis points in Fiscal Year 2023 (Successor) compared to Fiscal Year 2022 (Successor). This increase was primarily attributable to a higher mix of our higher margin advanced solutions net sales for the region, as well as a reduction in inventory reserves. These factors had a combined favorable impact of 32 basis points of net sales. These favorable impacts were slightly offset by an increase in various SG&A expenses of 21 basis points. The translation impact of foreign currencies relative to the U.S. dollar had a positive impact of 1 basis point on the year-over-year comparison of the regions income from operations margin.
Our Asia-Pacific income from operations margin increased 8 basis points in Fiscal Year 2023 (Successor) compared to Fiscal Year 2022 (Successor), primarily as a result of a decrease in SG&A expenses in the region; most notably, compensation and headcount expenses decreased by 16 basis points, intangible asset amortization decreased by 3 basis points and legal expenses decreased by 1 basis point, partially offset by an increase in bad debt expense of 11 basis points. The region also experienced higher gross margin on favorable product mix, as well as a reduction in inventory reserves. These factors had a combined positive impact of 2 basis points of net sales. The translation impact of foreign currencies relative to the U.S. dollar had a negative impact of 1 basis point on the year-over-year comparison of the regions income from operations margin.
Our Latin American income from operations margin decreased 61 basis points in Fiscal Year 2023 (Successor) compared to Fiscal Year 2022 (Successor), primarily due to an increase in SG&A expenses in the region; most notably, bad debt expense, which increased by 43 basis points of net sales related primarily to aging receivable balances related to a single project. Additionally, compensation and headcount expenses increased by 12 basis points, professional and outside service costs increased by 9 basis points, rental and occupancy costs increased by 7 basis points and integration and transition costs increased by 5 basis points. These factors were partially offset by the favorable impact of a shift in mix towards our higher margin advanced solutions net sales for the region, as well as a reduction in inventory reserves, which had a combined positive impact of 26 basis points of net sales. The translation impact of foreign currencies relative to the U.S. dollar had a positive impact of 3 basis points on the year-over-year comparison of the regions income from operations margin.
In Fiscal Year 2022 (Successor), we recorded a gain of $2,283,820 on the CLS Sale.
In Fiscal Year 2023 (Successor), Corporate included $25,000 of advisory fees paid to Platinum Advisors and $7,218 related to investments in certain initiatives to accelerate our growth and profitability and optimize our operations. In Fiscal Year 2022 (Successor), Corporate costs consisted primarily of $25,000 of advisory fees paid to Platinum Advisors, $21,886 related to executive transition agreements and $16,033 related to investments in certain initiatives to accelerate our growth and profitability and optimize our operations following the Imola Mergers.
Cash-based compensation expense decreased by $4,378 in Fiscal Year 2023 (Successor) compared to Fiscal Year 2022 (Successor) primarily due to the over-achievement of performance targets in the previous year.
Total other (income) expense consists primarily of interest income, interest expense, foreign currency exchange gains and losses, and other non-operating gains and losses. We incurred total other (income) expense of $421,846 in 2023 compared to $434,389 in Fiscal Year 2022 (Successor). The decrease is largely driven by lower other expense, resulting from a loss of $1,751 related to an equity investment for Fiscal Year 2023 (Successor) as compared to a loss of $25,365 for Fiscal Year 2022 (Successor). Additionally, Fiscal Year 2023
116
Table of Contents
(Successor) includes an unrealized gain of $8,617, while Fiscal Year 2022 (Successor) includes an unrealized loss of $14,347 related to our investments held in rabbi trust. Additionally, net foreign currency exchange losses decreased by $27,527 in the current year period. These factors were partially offset by higher interest expense of $59,961 primarily as a result of higher interest rates on our Term Loan Credit Facility and ABL Credit Facility partially offset by the impacts of lower average debt outstanding in the current year period, due in particular to principal payments in the current year of $560,000 on our Term Loan Credit Facility.
We recorded an income tax provision of $169,789, or an effective tax rate of 32.5%, in Fiscal Year 2023 (Successor), compared to $420,052, or an effective tax rate of 14.9%, in Fiscal Year 2022 (Successor). The tax provision for Fiscal Year 2023 (Successor) included $21,123 of withholding tax expense, or 4.0 percentage points of the effective tax rate, which is associated with our business operations in the Latin America region. In addition, the tax provision for Fiscal Year 2023 (Successor) also included $7,378 of tax expense, or 1.4 percentage points of the effective tax rate, due to a reduction in U.S. foreign tax credit utilization in Fiscal Year 2023 (Successor) as the result of an overall domestic loss for the United States tax purposes and $4,000 of withholding tax expense, or 0.8 percentage points of the effective rate, due to an expected dividend from our Chinese subsidiary, which is largely offset by $8,311 of tax benefit, or 1.6 percentage points of the effective tax rate, due to an increase in actual Fiscal Year 2022 (Successor) U.S. foreign tax credit utilization as compared to our previous estimate. The effective tax rate is also higher in Fiscal Year 2023 (Successor) due to the relative mix of pre-tax income and various tax rates in the tax jurisdictions in which we operate, including the impact of a statutory rate increase in the United Kingdom. The tax provision for Fiscal Year 2022 (Successor) included $2,283,820 of income from the CLS Sale, which had an income tax provision of $246,450, or an effective tax rate of 10.8 percentage points. The low effective tax rate on the CLS Sale was primarily due to the gain on sale of European subsidiaries being tax exempt due to the participation exemption in Europe. In addition, the tax provision for Fiscal Year 2022 (Successor) also included $8,795 of withholding tax expense, or 0.3 percentage points of the effective rate, due to a dividend from our Canadian subsidiary. Our Fiscal Year 2022 (Successor) income that was not part of the CLS Sale was taxed at a higher rate resulting in an overall effective tax rate of 14.9 percentage points.
Results of Operations for Fiscal Year 2022 (Successor) and for the Predecessor 2021 Period (Amounts in thousands):
| Predecessor | Successor | |||||||||||||||||||
| Predecessor 2021 Period |
Fiscal Year 2022 |
|||||||||||||||||||
|
Period from January 3, 2021 through July 2, 2021 |
Year Ended December 31, 2022 |
|||||||||||||||||||
| Net sales by reportable segment |
||||||||||||||||||||
| North America |
$ | 10,568,316 | 40 | % | $ | 20,908,493 | 41 | % | ||||||||||||
| EMEA |
8,538,634 | 32 | 15,052,242 | 30 | ||||||||||||||||
| Asia-Pacific |
5,519,718 | 21 | 11,184,575 | 22 | ||||||||||||||||
| Latin America |
1,780,201 | 7 | 3,679,180 | 7 | ||||||||||||||||
|
|
|
|
|
|
|
|
|
|||||||||||||
| Total |
$ | 26,406,869 | 100 | % | $ | 50,824,490 | 100 | % | ||||||||||||
|
|
|
|
|
|
|
|
|
|||||||||||||
117
Table of Contents
| Predecessor | Successor | ChangeIncrease (Decrease) |
||||||||||||||||||||||
|
Predecessor 2021 Period |
Fiscal Year 2022 |
|||||||||||||||||||||||
|
Period from January 3, 2021 through July 2, 2021 |
Year Ended December 31, 2022 |
|||||||||||||||||||||||
| Income from operations and income from |
Income from Operations |
Income from Operations Margin |
Income from Operations |
Income from Operations Margin |
Income from Operations Margin |
|||||||||||||||||||
| North America |
$ | 201,981 | 1.91 | % | $ | 414,128 | 1.98 | % | 0.07 | % | ||||||||||||||
| EMEA |
170,646 | 2.00 | 314,823 | 2.09 | 0.09 | |||||||||||||||||||
| Asia-Pacific |
114,637 | 2.08 | 230,494 | 2.06 | (0.02 | ) | ||||||||||||||||||
| Latin America |
64,770 | 3.64 | 113,473 | 3.08 | (0.56 | ) | ||||||||||||||||||
| Gain on CLS Sale |
| | 2,283,820 | | | |||||||||||||||||||
| Corporate |
894 | | (72,390 | ) | | | ||||||||||||||||||
| Cash-based compensation expense |
(27,428 | ) | | (35,418 | ) | | | |||||||||||||||||
|
|
|
|
|
|||||||||||||||||||||
| Total |
$ | 525,500 | 1.99 | % | $ | 3,248,930 | 6.39 | % | 4.40 | % | ||||||||||||||
|
|
|
|
|
|||||||||||||||||||||
| Predecessor | Successor | |||||||||||
| Predecessor 2021 Period |
Fiscal Year 2022 | |||||||||||
| Period from January 3, 2021 through July 2, 2021 |
Year Ended December 31, 2022 |
|||||||||||
| Net sales |
100.00 | % | 100.00 | % | ||||||||
| Cost of sales |
92.47 | 92.73 | ||||||||||
|
|
|
|
|
|
|
|||||||
| Gross profit |
7.53 | 7.27 | ||||||||||
| Operating expenses: |
||||||||||||
| Selling, general and administrative |
5.53 | 5.34 | ||||||||||
| Merger-related costs |
0.01 | | ||||||||||
| Restructuring costs |
0.00 | 0.02 | ||||||||||
| Gain on CLS Sale |
| (4.49 | ) | |||||||||
|
|
|
|
|
|
|
|||||||
| Income from operations |
1.99 | 6.39 | ||||||||||
| Total other (income) expense |
0.08 | 0.85 | ||||||||||
|
|
|
|
|
|
|
|||||||
| Income before income taxes |
1.91 | 5.54 | ||||||||||
| Provision for income taxes |
0.48 | 0.83 | ||||||||||
|
|
|
|
|
|
|
|||||||
| Net income |
1.43 | % | 4.71 | % | ||||||||
|
|
|
|
|
|
|
|||||||
Consolidated net sales were $50,824,490 for Fiscal Year 2022 (Successor), compared to $26,406,869 for the Predecessor 2021 Period. The translation impact of foreign currencies relative to the U.S. dollar had a negative impact on our net sales growth of approximately 4% on our consolidated net sales in Fiscal Year 2022 (Successor). Client and endpoint solutions, namely notebooks, peripherals and desktops were the largest driver of net sales at 63% of consolidated net sales in Fiscal Year 2022 (Successor). Advanced solutions offerings made up 34% of consolidated net sales in Fiscal Year 2022 (Successor), led by our networking and server offerings. Our Other services and cloud-based solutions contributed 2% and 1%, respectively, to consolidated net sales in Fiscal Year 2022 (Successor). During Fiscal Year 2022 (Successor), our advanced solutions offerings saw stronger demand while demand for client and endpoint solutions softened. In the Predecessor 2021 Period, client and endpoint solutions, namely notebooks, peripherals and desktops, were the largest driver of sales at 64% of consolidated net sales. Advanced solutions offerings comprised 28% of consolidated net sales in the Predecessor 2021 Period, as advanced solutions, particularly networking and related offerings, remained softer through much of 2021 as these areas of technology spending were slower to recover following COVID-19-related shutdowns. Our Other services, which largely consisted of the business encompassed in the CLS Sale, contributed 7% to consolidated net sales in the Predecessor 2021 Period.
118
Table of Contents
North American net sales were $20,908,493 for Fiscal Year 2022 (Successor), compared to $10,568,316 for the Predecessor 2021 Period. Client and endpoint solutions made up 56% of North American net sales in Fiscal Year 2022 (Successor), led by notebooks, desktops and consumer electronics, while our advanced solutions offerings made up 40%, led primarily by networking, and to a lesser extent, by our server, cyber security and storage offerings. Our Other services and cloud-based solutions contributed 3% and 1%, respectively, to North American net sales in Fiscal Year 2022 (Successor). In the Predecessor 2021 Period, client and endpoint solutions, namely notebooks, desktops and accessories, made up 53% of North American net sales, while advanced solutions offerings made up 32% of North American net sales. Additionally, our Other services contributed 14% to North American net sales in the Predecessor 2021 Period.
EMEA net sales were $15,052,242 for Fiscal Year 2022 (Successor), compared to $8,538,634 for the Predecessor 2021 Period. The translation impact of foreign currencies relative to the U.S. dollar had a negative impact of approximately 10% on the regions net sales growth. Client and endpoint solutions made up 63% of EMEA net sales in Fiscal Year 2022 (Successor), led by notebooks, peripherals and tablets, while our advanced solutions offerings made up 34%, led by networking, server and storage offerings. Our Other services contributed 3% to EMEA net sales in Fiscal Year 2022 (Successor). In the Predecessor 2021 Period, client and endpoint solutions, namely notebooks and peripherals, made up 67% of EMEA net sales, while advanced solutions offerings made up 26% of EMEA net sales. Additionally, our Other services, which largely consisted of the business encompassed in the CLS Sale, contributed 6%, while our cloud-based solutions contributed 1% to EMEA net sales in the Predecessor 2021 Period.
Asia-Pacific net sales were $11,184,575 for Fiscal Year 2022 (Successor), compared to $5,519,718 for the Predecessor 2021 Period. The translation impact of foreign currencies relative to the U.S. dollar had a negative impact of approximately 5% on the regions net sales growth. Client and endpoint solutions made up 72% of Asia-Pacific net sales, led by notebooks, peripherals, consumer electronics and desktops, while our advanced solutions offerings made up 28%, led by networking, data center and server offerings. Our Other services and cloud-based solutions made up less than 1% of Asia-Pacific net sales in Fiscal Year 2022 (Successor). In the Predecessor 2021 Period, client and endpoint solutions, namely notebooks, peripherals and desktops, made up 75% of Asia-Pacific net sales, while advanced solutions offerings made up 24% of Asia-Pacific net sales. Our Other services and cloud-based solutions made up the remaining 1% of Asia-Pacific net sales in the Predecessor 2021 Period.
Latin American net sales were $3,679,180 for Fiscal Year 2022 (Successor), compared to $1,780,201 for the Predecessor 2021 Period. The translation impact of foreign currencies relative to the U.S. dollar had a negative impact of approximately 2% on the regions net sales growth. Client and endpoint solutions made up 74% of Latin American net sales, led by notebooks, consumer electronics and desktops, while our advanced solutions offerings made up 25%, led by networking, and server offerings. Our Other services and cloud-based solutions made up the remaining 1% of Latin American net sales in Fiscal Year 2022 (Successor). In the Predecessor 2021 Period, client and endpoint solutions, namely notebooks, made up 77% of Latin American net sales, while advanced solutions offerings made up 21% of Latin American net sales. Our Other services and cloud-based solutions made up the remaining 2% of Latin American net sales in the Predecessor 2021 Period.
Gross profit was $3,693,392 for Fiscal Year 2022 (Successor), compared to $1,987,380 for the Predecessor 2021 Period. Gross margin decreased 26 basis points in Fiscal Year 2022 (Successor) compared to the Predecessor 2021 Period. The translation impact of foreign currencies relative to the U.S. dollar had a negative impact of 4% on gross profit growth and a negative impact of 2 basis points on gross margin. The decrease was primarily attributable to the decline in our share of higher margin fee-for-service net sales from our Other services in Fiscal Year 2022 (Successor) compared to the Predecessor 2021 Period, as a result of the CLS Sale. Additionally, client and endpoint solutions experienced softer demand and product constraints during Fiscal Year 2022 (Successor) compared to the Predecessor 2021 Period, which benefited from higher selling prices due to comparatively higher demand, particularly for work-from-home and learn-from-home technologies. This was partially offset by an increase in our share of net sales in our higher-margin advanced solutions offerings. The decrease was also partially offset by the result of a negative inventory revaluation in our U.S. Reverse Logistics and Repair business in the Predecessor 2021 Period, of $36,611, which had a negative impact of 14 basis points to gross margin in the Predecessor 2021 Period.
119
Table of Contents
Total SG&A expenses as a percentage of net sales in Fiscal Year 2022 (Successor) decreased 17 basis points compared to the Predecessor 2021 Period. The translation impact of foreign currencies relative to the U.S. dollar had a positive impact of 4% on SG&A expenses. The decrease was driven by lower compensation and headcount expenses of 79 basis points of net sales, lower rental and occupancy costs of 15 basis points, lower shipping and supply costs of 8 basis points and lower depreciation expense of 5 basis points. Each of these factors were primarily the result of the CLS Sale coupled with diligent management of discretionary expenses across the remaining business. These decreases were partially offset by decrease of 53 basis points of net sales on lower cost absorption to margin, primarily as a result of the CLS Sale. Amortization expense also increased 6 basis points due to the step-up of the fair value of intangible assets as a result of applying the acquisition method of accounting following the Imola Mergers in the Successor 2021 Period. Additionally, the Predecessor 2021 Period included the benefit of a reversal of an accrual recorded in prior years related to an ICMS tax assessment in Brazil totaling $13,642.
Income from operations margin in Fiscal Year 2022 (Successor) increased 4.40% compared to the Predecessor 2021 Period primarily due to the gain of $2,283,820, or 4.49%, that was recorded as a result of the CLS Sale, as well as a reduction in SG&A expenses, described above. These benefits were slightly offset by the decrease in gross margin explained above. Income from operations margin was negatively impacted in the Predecessor 2021 Period by an inventory revaluation in our U.S. Reverse Logistics and Repair business, most of which was in gross margin and had a negative impact of 14 basis points, as well as Imola Merger-related costs, which had a negative impact of 1 basis point. The translation impact of foreign currencies relative to the U.S. dollar had a negative impact of 11 basis points on our consolidated income from operations margin.
Our North American income from operations margin increased 7 basis points in Fiscal Year 2022 (Successor) compared to the Predecessor 2021 Period. This was driven primarily by an inventory revaluation charge in the Predecessor 2021 Period of $38,082 or 36 basis points of North America net sales in our U.S. Reverse Logistics and Repair business, most of which was in gross margin, that did not reoccur in Fiscal Year 2022 (Successor). Income from operations margin was negatively impacted by the CLS Sale in Fiscal Year 2022 (Successor), which resulted in lower revenue and margin from our Other services. The region experienced lower volume and margin on client and endpoint solutions as a result of softer demand as well as product mix during Fiscal Year 2022 (Successor) compared to the Predecessor 2021 Period, partially offset by favorable results in advanced solutions offerings. Additionally, the region was impacted by certain corporate charges of $11,337 related to the discontinuation of our Cloud operations in Russia, which had a negative impact of 5 basis points on North American income from operations margin in Fiscal Year 2022 (Successor). Despite an overall decrease in operating expenses, the region was also impacted by an increase in bad debt expense of 12 basis points, due to a customer going into receivership in late 2022.
Our EMEA income from operations margin increased 9 basis points in Fiscal Year 2022 (Successor) compared to the Predecessor 2021 Period, driven by diligent management of operating expenses and impacts of the CLS Sale, including decreased compensation and headcount expenses of 192 basis points, decreased rental and occupancy costs of 22 basis points and decreased shipping and supply costs of 11 basis points. These declines were partially offset by declines in gross margin, primarily in client and endpoint solutions, as well as the decline in our share of net sales from our Other services, as a result of the CLS Sale. The increase in EMEA income from operations margin was also slightly offset by a monetary penalty in our French operations, which had a negative impact of 14 basis points, as well as an 8 basis point increase in write-offs for excess and obsolete inventory as a result of inventory build-up during Fiscal Year 2022 (Successor) in response to supply constraints. The translation impact of foreign currencies relative to the U.S. dollar had a negative impact of 22 basis points on the regions income from operations margin.
Our Asia-Pacific income from operations margin decreased 2 basis points in Fiscal Year 2022 (Successor) compared to the Predecessor 2021 Period as a result of lower net sales volumes, most notably in client and endpoint solutions, as a result of softer demand during Fiscal Year 2022 (Successor). Income from operations margin was also negatively impacted by the CLS Sale in Fiscal Year 2022 (Successor), which resulted in lower
120
Table of Contents
revenue and margin from our Other services. The regions total share of mobility distribution sales declined during Fiscal Year 2022 (Successor) compared to the Predecessor 2021 Period. Additionally, during Fiscal Year 2022 (Successor), write-offs for excess and obsolete inventory increased by 9 basis points as a result of inventory build-up, particularly in China where significant COVID-related restrictions continued through much of 2022. These factors were partially offset by diligent management of operating expenses including bad debt expense, which decreased by 18 basis points, as well as compensation and headcount expenses, which decreased by 4 basis points. The translation impact of foreign currencies relative to the U.S. dollar had a negative impact of 15 basis points on the regions income from operations margin.
Our Latin American income from operations margin decreased 56 basis points in Fiscal Year 2022 (Successor) compared to the Predecessor 2021 Period, primarily due to lower volume and margin as a result of softer demand, primarily for client and endpoint solutions. Income from operations margin was also negatively impacted by the CLS Sale in Fiscal Year 2022 (Successor), which resulted in lower revenue and margin from our Other services. Additionally, SG&A expenses increased in the region, most notably compensation and headcount expenses increased 19 basis points, outside consulting costs increased 8 basis points, travel and entertainment increased 4 basis points and depreciation expense increased 3 basis points. Additionally, write-offs for excess and obsolete inventory increased by 33 basis points as a result of inventory build-up during Fiscal Year 2022 (Successor) in response to supply constraints. The translation impact of foreign currencies relative to the U.S. dollar had a negative impact of 24 basis points on the regions income from operations margin.
In Fiscal Year 2022 (Successor), we recorded a gain of $2,283,820 as a result of the CLS Sale.
In Fiscal Year 2022 (Successor), Corporate consisted primarily of $25,000 of advisory fees paid to Platinum Advisors, $21,886 related to executive transition agreements and $16,033 related to investments in certain initiatives to accelerate our growth and profitability and optimize our operations following the Imola Mergers. In the Predecessor 2021 Period, Corporate included the reversal of certain accruals at the close of the Imola Mergers, partially offset by merger-related costs of $2,314 incurred during the Predecessor 2021 Period which consisted of commitment fees, placement fees and other transaction costs for advisory and professional fees related to the Imola Mergers.
Cash-based compensation expense increased by $7,990 in Fiscal Year 2022 (Successor) compared to the Predecessor 2021 Period primarily due to Fiscal Year 2022 (Successor) having six additional months as compared to the Predecessor 2021 Period.
Total other (income) expense consists primarily of interest income, interest expense, foreign currency exchange gains and losses and other non-operating gains and losses. We incurred total other (income) expense of $434,389 in Fiscal Year 2022 (Successor) compared to $20,546 in the Predecessor 2021 Period. Interest expense increased by 46 basis points as a percentage of net sales, as a result of higher interest expense due to the issuance of new debt in connection with the Imola Mergers and higher interest rates, see Managements Discussion and Analysis of Financial Condition and Results of OperationsLiquidity and Capital ResourcesInterest Rate Risk. Additionally, we recorded a loss of 5 basis points as a percentage of net sales related to valuation of an equity investment in Fiscal Year 2022 (Successor) compared to a gain of 10 basis points on the same equity investment in the Predecessor 2021 Period. Further, we incurred a foreign exchange loss of 14 basis points in Fiscal Year 2022 (Successor) compared to a loss of 1 basis point in the Predecessor 2021 Period.
We recorded an income tax provision of $420,052, or an effective tax rate of 14.9%, in Fiscal Year 2022 (Successor) compared to $126,479, or an effective tax rate of 25.0%, in the Predecessor 2021 Period. Fiscal Year 2022 (Successor) included $2,283,820 of income from the CLS Sale, which had an income tax provision of $246,450, or an effective tax rate of 10.8 percentage points. The low effective tax rate on the CLS Sale was primarily due to the gain on sale of European subsidiaries being tax exempt due to the participation exemption in Europe. In addition, Fiscal Year 2022 (Successor) also included $8,795 of withholding tax expense, or 0.3 percentage points of the effective rate, due to a dividend from our Canadian subsidiary. Our Fiscal Year 2022 (Successor) income that was not part of the CLS Sale was taxed at a higher rate resulting in an overall effective
121
Table of Contents
tax rate of 14.9 percentage points. The Predecessor 2021 Period income tax provision included $9,120 of non-cash tax benefits, or 1.8 percentage points of the effective rate, related to the reversal of the full valuation allowance against Belgium deferred tax assets. The tax provision in the Predecessor 2021 Period also included other items that resulted in net tax expenses of $4,496, or 0.9 percentage points.
Results of Operations for Fiscal Year 2022 (Successor) and for the Successor 2021 Period (Amounts in thousands):
| Successor | ||||||||||||||||
| Successor 2021 Period | Fiscal Year 2022 | |||||||||||||||
| Period from July 3, 2021 through January 1, 2022 |
Year Ended December 31, 2022 |
|||||||||||||||
| Net sales by reportable segment |
||||||||||||||||
| North America |
$ | 11,572,674 | 41 | % | $ | 20,908,493 | 41 | % | ||||||||
| EMEA |
8,526,486 | 30 | 15,052,242 | 30 | ||||||||||||
| Asia-Pacific |
6,097,137 | 22 | 11,184,575 | 22 | ||||||||||||
| Latin America |
1,852,406 | 7 | 3,679,180 | 7 | ||||||||||||
|
|
|
|
|
|
|
|
|
|||||||||
| Total |
$ | 28,048,703 | 100 | % | $ | 50,824,490 | 100 | % | ||||||||
|
|
|
|
|
|
|
|
|
|||||||||
| Successor | ||||||||||||||||||||
| Successor 2021 Period | Fiscal Year 2022 | ChangeIncrease (Decrease) |
||||||||||||||||||
|
Period from July 3, 2021 through January 1, 2022 |
Year Ended December 31, 2022 |
|||||||||||||||||||
| Income from operations and operating margin by reportable segment |
Income from Operations |
Income from Operations Margin |
Income from Operations |
Income from Operations Margin |
Income from Operations Margin |
|||||||||||||||
| North America |
$ | 202,717 | 1.75 | % | $ | 414,128 | 1.98 | % | 0.23 | % | ||||||||||
| EMEA |
196,473 | 2.30 | 314,823 | 2.09 | (0.21 | ) | ||||||||||||||
| Asia-Pacific |
127,399 | 2.09 | 230,494 | 2.06 | (0.03 | ) | ||||||||||||||
| Latin America |
61,310 | 3.31 | 113,473 | 3.08 | (0.23 | ) | ||||||||||||||
| Gain on CLS Sale |
| | 2,283,820 | | | |||||||||||||||
| Corporate |
(235,563 | ) | | (72,390 | ) | | | |||||||||||||
| Cash-based compensation expense |
(28,576 | ) | | (35,418 | ) | | | |||||||||||||
|
|
|
|
|
|||||||||||||||||
| Total |
$ | 323,760 | 1.15 | % | $ | 3,248,930 | 6.39 | % | 5.24 | % | ||||||||||
|
|
|
|
|
|||||||||||||||||
122
Table of Contents
| Successor | ||||||||
| Successor 2021 Period |
Fiscal Year 2022 |
|||||||
| Period from July 3, 2021 through January 1, 2022 |
Year Ended December 31, 2022 |
|||||||
| Net sales |
100.00 | % | 100.00 | % | ||||
| Cost of sales |
92.43 | 92.73 | ||||||
|
|
|
|
|
|||||
| Gross profit |
7.57 | 7.27 | ||||||
| Operating expenses: |
||||||||
| Selling, general and administrative |
6.01 | 5.34 | ||||||
| Merger-related costs |
0.41 | | ||||||
| Restructuring costs |
0.00 | 0.02 | ||||||
| Gain on CLS Sale |
| (4.49 | ) | |||||
|
|
|
|
|
|||||
| Income from operations |
1.15 | 6.39 | ||||||
| Total other (income) expense |
0.74 | 0.85 | ||||||
|
|
|
|
|
|||||
| Income before income taxes |
0.42 | 5.54 | ||||||
| Provision for income taxes |
0.07 | 0.83 | ||||||
|
|
|
|
|
|||||
| Net income |
0.34 | % | 4.71 | % | ||||
|
|
|
|
|
|||||
Consolidated net sales were $50,824,490 for Fiscal Year 2022 (Successor), compared to $28,048,703 for the Successor 2021 Period. The translation impact of foreign currencies relative to the U.S. dollar had a negative impact on our net sales growth of approximately 4% on our consolidated net sales in Fiscal Year 2022 (Successor). Client and endpoint solutions, namely notebooks, peripherals and desktops were the largest driver of net sales at 63% of consolidated net sales in Fiscal Year 2022 (Successor). Advanced solutions offerings made up 34% of consolidated net sales in Fiscal Year 2022 (Successor), led by our networking and server offerings. Our Other services and cloud-based solutions contributed 2% and 1%, respectively, to consolidated net sales in Fiscal Year 2022 (Successor). In the Successor 2021 Period, client and endpoint solutions, namely notebooks, peripherals and desktops were the largest driver of net sales at 65% of consolidated net sales. Our advanced solutions offerings contributed 30% of our consolidated net sales, led by networking, server and storage offerings. Our Other services, which largely consisted of the business encompassed in the CLS Sale, contributed 4% to consolidated net sales, while our cloud-based solutions contributed 1% to consolidated net sales in the Successor 2021 Period.
North American net sales were $20,908,493 for Fiscal Year 2022 (Successor), compared to $11,572,674 for the Successor 2021 Period. Client and endpoint solutions made up 56% of North American net sales in Fiscal Year 2022 (Successor), led by notebooks, desktops and consumer electronics, while our advanced solutions offerings made up 40%, led primarily by networking, and to a lesser extent, by our server, cyber security and storage offerings. Our Other services and cloud-based solutions contributed 3% and 1%, respectively, to North American net sales in Fiscal Year 2022 (Successor). In the Successor 2021 Period, client and endpoint solutions, namely notebooks, desktops and consumer electronics, made up 60% of North American net sales, while advanced solutions offerings made up 34% of North American net sales, primarily driven by networking offerings. Additionally, our Other services and cloud-based solutions contributed 5% and 1%, respectively, to North American net sales in the Successor 2021 Period.
EMEA net sales were $15,052,242 for Fiscal Year 2022 (Successor), compared to $8,526,486 for the Successor 2021 Period. The translation impact of foreign currencies relative to the U.S. dollar had a negative impact of approximately 10% on the regions net sales growth. Client and endpoint solutions made up 63% of EMEA net sales in Fiscal Year 2022 (Successor), led by notebooks, peripherals and tablets, while our advanced solutions offerings made up 34%, led by networking, server and storage offerings. Our Other services contributed 3% to EMEA net sales in Fiscal Year 2022 (Successor). In the Successor 2021 Period, client and endpoint solutions, namely notebooks and peripherals, made up 65% of EMEA net sales, while advanced solutions offerings made up 28% of EMEA net sales,
123
Table of Contents
primarily driven by networking and server offerings. Additionally, our Other services, which largely consisted of the business encompassed in the CLS Sale, contributed 6%, while our cloud-based solutions contributed 1% to EMEA net sales in the Successor 2021 Period.
Asia-Pacific net sales were $11,184,575 for Fiscal Year 2022 (Successor), compared to $6,097,137 for the Successor 2021 Period. The translation impact of foreign currencies relative to the U.S. dollar had a negative impact of approximately 5% on the regions net sales growth. Client and endpoint solutions made up 72% of Asia-Pacific net sales, led by notebooks, peripherals, consumer electronics and desktops, while our advanced solutions offerings made up 28%, led by networking, data center and server offerings. Our Other services and cloud-based solutions made up less than 1% of Asia-Pacific net sales in Fiscal Year 2022 (Successor). In the Successor 2021 Period, client and endpoint solutions, namely notebooks, peripherals and consumer electronics, made up 73% of Asia-Pacific net sales, while advanced solutions offerings made up 26% of Asia-Pacific net sales. Our Other services and cloud-based solutions made up the remaining 1% of Asia-Pacific net sales in the Successor 2021 Period.
Latin American net sales were $3,679,180 for Fiscal Year 2022 (Successor), compared to $1,852,406 for the Successor 2021 Period. The translation impact of foreign currencies relative to the U.S. dollar had a negative impact of approximately 2% on the regions net sales growth. Client and endpoint solutions made up 74% of Latin American net sales, led by notebooks, consumer electronics and desktops, while our advanced solutions offerings made up 25%, led by networking and server offerings. Our Other services and cloud-based solutions made up the remaining 1% of Latin American net sales in Fiscal Year 2022 (Successor). In the Successor 2021 Period, client and endpoint solutions, namely notebooks, made up 74% of Latin American net sales, while advanced solutions offerings made up 24% of Latin American net sales, primarily driven by networking and server offerings. Our Other services and cloud-based solutions made up the remaining 2% of Latin American net sales in the Successor 2021 Period.
Gross profit was $3,693,392 for Fiscal Year 2022 (Successor), compared to $2,123,093 for the Successor 2021 Period. Gross margin decreased 30 basis points in Fiscal Year 2022 (Successor) compared to the Successor 2021 Period. The translation impact of foreign currencies relative to the U.S. dollar had a negative impact of 4% on gross profit growth and a negative impact of 2 basis points on gross margin. The decrease was primarily attributable to the decline in our share of higher margin fee-for-service net sales from our Other services in Fiscal Year 2022 (Successor) compared to the Successor 2021 Period, as a result of the CLS Sale. Additionally, client and endpoint solutions experienced softer demand and product constraints during Fiscal Year 2022 (Successor) compared to the Successor 2021 Period, which benefited from strong work-from-home and learn-from-home demand. The decrease was partially offset by the result of a negative inventory revaluation in our U.S. Reverse Logistics and Repair business in the Successor 2021 Period, of $41,322, which had a negative impact of 15 basis points to gross margin in the Successor 2021 Period.
Total SG&A expenses as a percentage of net sales in Fiscal Year 2022 (Successor) decreased 65 basis points compared to the Successor 2021 Period. The translation impact of foreign currencies relative to the U.S. dollar had a positive impact of 4% on SG&A expenses. The decrease was driven by lower compensation and headcount expenses of 70 basis points of net sales, lower rental and occupancy costs of 11 basis points, lower shipping and supply costs of 10 basis points and lower depreciation expense of 10 basis points. Each of these factors were primarily the result of the CLS Sale coupled with diligent management of discretionary expenses. These decreases were partially offset by a decrease of 60 basis points on lower cost absorption to margin, primarily as a result of the CLS Sale.
Income from operations margin in Fiscal Year 2022 (Successor) increased 5.24% compared to the Successor 2021 Period primarily due to the gain of $2,283,820, or 4.49%, that was recorded as a result of the CLS Sale, as well as a reduction in SG&A expenses, described above. These benefits were slightly offset by the decrease in gross margin explained above. Income from operations margin was negatively impacted in the Successor 2021 Period by Imola Merger-related costs discussed further below, which had a negative impact of 41 basis points, as
124
Table of Contents
well as an inventory revaluation in our U.S. Reverse Logistics and Repair business, most of which was in gross margin, which had a negative impact of 16 basis points. The translation impact of foreign currencies relative to the U.S. dollar had a negative impact of 11 basis points on our consolidated income from operations margin.
Our North American income from operations margin increased 23 basis points in Fiscal Year 2022 (Successor) compared to the Successor 2021 Period. This was driven primarily by an inventory revaluation charge in the Successor 2021 Period of $43,974, or 38 basis points of North America net sales in our U.S. Reverse Logistics and Repair business, most of which was in gross margin. Income from operations margin was negatively impacted by the CLS Sale in Fiscal Year 2022 (Successor), which resulted in lower revenue and margin from our Other services. Additionally, the region experienced lower volume and margin on client and endpoint solutions as a result of softer demand during Fiscal Year 2022 (Successor) compared to the Successor 2021 Period, partially offset by favorable results in advanced solutions offerings. Additionally, the region was impacted by certain corporate charges of $11,337 related to the discontinuation of our Cloud operations in Russia, which had a negative impact of 5 basis points on North American income from operations margin in Fiscal Year 2022 (Successor). Despite an overall decrease in operating expenses, the region was also impacted by an increase in bad debt expense of 10 basis points, due to a customer going into receivership in late 2022.
Our EMEA income from operations margin decreased 21 basis points in Fiscal Year 2022 (Successor) compared to the Successor 2021 Period, driven primarily by a legal fine in our French operations accounting for 14 basis points of the overall decline. Additionally, the CLS Sale, as well as continued supply constraints, primarily in our client and endpoint solutions product group, also negatively impacted income from operations margin in the region for Fiscal Year 2022 (Successor) compared to the Successor 2021 Period. Write-offs for excess and obsolete inventory increased by 12 basis points as a percentage of net sales as a result of inventory build-up during Fiscal Year 2022 (Successor), in response to supply constraints. These results were partially offset by reductions in SG&A expenses, as a result of the CLS Sale, including a decrease in compensation and headcount expenses of 211 basis points, a decrease in rental and occupancy costs of 20 basis points and a decrease in shipping and supply costs of 17 basis points. The translation impact of foreign currencies relative to the U.S. dollar had a negative impact of 22 basis points on the regions income from operations margin.
Our Asia-Pacific income from operations margin decreased 3 basis points in Fiscal Year 2022 (Successor) compared to the Successor 2021 Period, primarily due to lower volume and margin as a result of softer demand, primarily for client and endpoint solutions. Additionally, the region was impacted by the CLS Sale, which resulted in lower revenue and margin from our Other services in Fiscal Year 2022 (Successor). The regions total share of mobility distribution sales declined during Fiscal Year 2022 (Successor) compared to the Successor 2021 Period. Additionally, during Fiscal Year 2022 (Successor), write-offs for excess and obsolete inventory increased by 9 basis points as a result of inventory build-up, particularly in China where significant COVID-related restrictions continued through much of 2022. These factors were partially offset by diligent management of operating expenses including bad debt expense, which decreased by 30 basis points. The translation impact of foreign currencies relative to the U.S. dollar had a negative impact of 15 basis points on the regions income from operations margin.
Our Latin American income from operations margin decreased 23 basis points in Fiscal Year 2022 (Successor) compared to the Successor 2021 Period, primarily due to lower volume and margin as a result of softer demand, primarily for client and endpoint solutions. Additionally, the region was impacted by the CLS Sale, which resulted in lower revenue and margin from our Other services in Fiscal Year 2022 (Successor). Write-offs for excess and obsolete inventory also increased by 19 basis points as a result of inventory build-up during Fiscal Year 2022 (Successor) in response to supply constraints. This was partially offset by a decline in SG&A expenses including a 12 basis point decrease in compensation and headcount expenses. The translation impact of foreign currencies relative to the U.S. dollar had a negative impact of 24 basis points on the regions income from operations margin.
In Fiscal Year 2022 (Successor), we recorded a gain of $2,283,820 as a result of the CLS Sale.
125
Table of Contents
In Fiscal Year 2022 (Successor), Corporate consisted primarily of $25,000 of advisory fees paid to Platinum Advisors, $21,886 related to executive transition agreements and $16,033 related to investments in certain initiatives to accelerate our growth and profitability and optimize our operations following the Imola Mergers. In the Successor 2021 Period, Corporate costs consisted primarily of merger-related costs of $114,332, which included commitment fees, placement fees and other transaction costs for advisory and professional fees related to the Imola Mergers, $75,000 of expenses related to the true-up in value of contingent consideration resulting from the Imola Mergers, $15,767 of fees related to certain initiatives to accelerate our growth and profitability and optimize our operations following the acquisition by Platinum and $12,500 of advisory fees paid to Platinum Advisors. Corporate costs also included $9,400 related to an executive transition agreement.
Cash-based compensation expense increased by $6,842 in Fiscal Year 2022 (Successor) compared to the Successor 2021 Period primarily due to Fiscal Year 2022 (Successor) having six additional months as compared to the Successor 2021 Period.
Total other (income) expense consists primarily of interest income, interest expense, foreign currency exchange gains and losses and other non-operating gains and losses. We incurred total other (income) expense of $434,389 in Fiscal Year 2022 (Successor) compared to $207,003 in the Successor 2021 Period. Interest expense was lower by 2 basis points as a percentage of net sales in Fiscal Year 2022 (Successor), because the Successor 2021 Period includes one-time interest expense pertaining to the issuance of new debt in connection with the Imola Mergers. Additionally, we incurred a foreign exchange loss of 14 basis points in Fiscal Year 2022 (Successor) compared to a loss of 6 basis points in the Successor 2021 Period. Fiscal Year 2022 (Successor) also includes a loss of 5 basis points as a percentage of net sales related to valuation of an equity investment.
We recorded an income tax provision of $420,052, or an effective tax rate of 14.9%, in Fiscal Year 2022 (Successor) compared to $20,023, or an effective tax rate of 17.1%, in the Successor 2021 Period. Fiscal Year 2022 (Successor) included $2,283,820 of income from the CLS Sale, which had an income tax provision of $246,450, or an effective tax rate of 10.8 percentage points. The low effective tax rate on the CLS Sale was primarily due to the gain on sale of European subsidiaries being tax exempt due to the participation exemption in Europe. In addition, Fiscal Year 2022 (Successor) also included $8,795 of withholding tax expense, or 0.3 percentage points of the effective rate, due to a dividend from our Canadian subsidiary. Our Fiscal Year 2022 (Successor) income that was not part of the CLS Sale was taxed at a higher rate resulting in an overall effective tax rate of 14.9 percentage points. The Successor 2021 Period income tax provision included $63,519 of non-cash tax benefits, or 54.4 percentage points of the effective rate, related to the reversal of the full valuation allowance against Luxembourg deferred tax assets; and $14,115 of non-cash tax benefits, or 12.1 percentage points of the effective rate, related to establishment of net deferred tax assets for basis differences on held for sale subsidiaries. These tax benefits are partially offset by the impact of the Imola Mergers non-recurring expenses, including $18,750, or 16.1 percentage points of the effective rate, related to a non-deductible expense related to the contingent consideration provided in the Imola Mergers, and $8,428, or 7.2 percentage points of the effective rate, related to non-deductible transaction costs. In addition, there is an impact of $19,564, or 16.8 percentage points of the effective tax rate, due to additional U.S. federal non-cash tax expenses on foreign earnings associated with non-recurring transactions. The tax provision in the Successor 2021 Period also included other items that resulted in net tax expenses of $6,638, or 5.7 percentage points of the effective tax rate.
126
Table of Contents
Results of Operations for Fiscal Year 2022 (Successor) and for the Unaudited Pro Forma Combined 2021 Period (Amounts in thousands):
To facilitate comparability of Fiscal Year 2022 (Successor) to the fiscal year ended January 1, 2022, we present unaudited condensed combined pro forma financial information for key financial metrics and results of operations for the Unaudited Pro Forma Combined 2021 Period to illustrate the effects of the Imola Mergers, including the Financing Transactions, as if they had occurred on January 3, 2021. See Unaudited Pro Forma Condensed Combined Statement of Income.
| Combined | Successor | |||||||||||||||||||||||
| Unaudited Pro Forma Combined 2021 Period |
Fiscal Year 2022 | ChangeIncrease (Decrease) |
||||||||||||||||||||||
| Fiscal Year Ended January 1, 2022 |
Year Ended December 31, 2022 |
Amount | Percentage | |||||||||||||||||||||
| Net sales by reportable segment |
||||||||||||||||||||||||
| North America |
$ | 22,140,990 | 41 | % | $ | 20,908,493 | 41 | % | $ | (1,232,497 | ) | (5.6 | )% | |||||||||||
| EMEA |
17,065,120 | 31 | 15,052,242 | 30 | (2,012,878 | ) | (11.8 | ) | ||||||||||||||||
| Asia-Pacific |
11,616,855 | 21 | 11,184,575 | 22 | (432,280 | ) | (3.7 | ) | ||||||||||||||||
| Latin America |
3,632,607 | 7 | 3,679,180 | 7 | 46,573 | 1.3 | ||||||||||||||||||
|
|
|
|
|
|
|
|
|
|
|
|||||||||||||||
| Total |
$ | 54,455,572 | 100 | % | $ | 50,824,490 | 100 | % | $ | (3,631,082 | ) | (6.7 | )% | |||||||||||
|
|
|
|
|
|
|
|
|
|
|
|||||||||||||||
| Combined | Successor | |||||||||||||||||||||||
| Unaudited Pro Forma Combined 2021 Period |
Fiscal Year 2022 | |||||||||||||||||||||||
| Fiscal Year Ended January 1, 2022 |
Year Ended December 31, 2022 |
ChangeIncrease (Decrease) |
||||||||||||||||||||||
| Income from operations and operating margin by reportable segment |
Income from Operations |
Operating Margin |
Income from Operations |
Operating Margin |
Income from Operations |
Operating Margin |
||||||||||||||||||
| North America |
$ | 374,164 | 1.69 | % | $ | 414,128 | 1.98 | % | $ | 39,964 | 0.29 | % | ||||||||||||
| EMEA |
361,054 | 2.12 | 314,823 | 2.09 | (46,231 | ) | (0.03 | ) | ||||||||||||||||
| Asia-Pacific |
228,945 | 1.97 | 230,494 | 2.06 | 1,549 | 0.09 | ||||||||||||||||||
| Latin America |
127,958 | 3.52 | 113,473 | 3.08 | (14,485 | ) | (0.44 | ) | ||||||||||||||||
| Gain on CLS Sale |
| | 2,283,820 | | 2,283,820 | | ||||||||||||||||||
| Corporate |
(247,169 | ) | | (72,390 | ) | | 174,779 | | ||||||||||||||||
| Cash-based compensation expense |
(56,004 | ) | | (35,418 | ) | | 20,586 | | ||||||||||||||||
|
|
|
|
|
|
|
|||||||||||||||||||
| Total |
$ | 788,948 | 1.45 | % | $ | 3,248,930 | 6.39 | % | $ | 2,459,982 | 4.94 | % | ||||||||||||
|
|
|
|
|
|
|
|||||||||||||||||||
127
Table of Contents
| Combined | Successor | |||||||
| Unaudited Pro Forma Combined 2021 Period |
Fiscal Year 2022 |
|||||||
| Fiscal Year Ended January 1, 2022 |
Year Ended December 31, 2022 |
|||||||
| Net sales |
100.00 | % | 100.00 | % | ||||
| Cost of sales |
92.45 | 92.73 | ||||||
|
|
|
|
|
|||||
| Gross profit |
7.55 | 7.27 | ||||||
| Operating expenses: |
||||||||
| Selling, general and administrative |
5.89 | 5.34 | ||||||
| Merger-related costs |
0.21 | | ||||||
| Restructuring costs |
0.00 | 0.02 | ||||||
| Gain on CLS Sale |
| (4.49 | ) | |||||
|
|
|
|
|
|||||
| Income from operations |
1.45 | 6.39 | ||||||
| Total other (income) expense |
0.57 | 0.85 | ||||||
|
|
|
|
|
|||||
| Income before income taxes |
0.87 | 5.54 | ||||||
| Provision for income taxes |
0.20 | 0.83 | ||||||
|
|
|
|
|
|||||
| Net income |
0.67 | % | 4.71 | % | ||||
|
|
|
|
|
|||||
The 6.7% decrease in our consolidated net sales for Fiscal Year 2022 (Successor) compared to the Unaudited Pro Forma Combined 2021 Period, includes the negative impact of foreign currencies relative to the U.S. dollar of approximately 4%. The decrease was also largely driven by a decline in net sales in our EMEA region of $2,012,878 or 11.8%, due to softer demand and product constraints on client and endpoint solutions, as well as a decrease in our Other services globally due to the CLS Sale. We also saw declines in North America of $1,232,497 or 5.6%, as well as in Asia-Pacific of $432,280 or 3.7%. These results were partially offset by growth in our Latin America region of $46,573, or 1.3%. Client and endpoint solutions net sales decreased by $3,216,288, or 9%, across all regions, but most notably in EMEA, which decreased by $1,819,207, or 16%, and North America, which decreased by $761,127, or 6%. The decline reflects softer demand and product constraints in Fiscal Year 2022 (Successor) compared to the Unaudited Pro Forma Combined 2021 Period, which benefited from higher selling prices due to comparatively higher demand, particularly for work-from-home and learn-from-home technologies. Our Other services net sales decreased by $2,168,445, or 65%, in Fiscal Year 2022 (Successor) compared to the Unaudited Pro Forma Combined 2021 Period as a result of the CLS Sale. The CLS Sale primarily impacted North America, which saw Other services net sales decline by 71%, and EMEA, which saw Other services net sales decline by 56%. These declines were partially offset by growth across all regions in our advanced solutions offerings net sales of $1,715,314, or 11%, most notably in North America, which grew by 13%, and EMEA, which grew by 10%. Our cloud-based solutions grew by $38,337, or 13%, globally.
The 5.6% decrease in our North American net sales for Fiscal Year 2022 (Successor) compared to the Unaudited Pro Forma Combined 2021 Period was primarily driven by a decline of 71% in our Other services net sales mainly as a result of the CLS Sale. Client and endpoint solutions net sales decreased by 6%, most notably due to declines in components, consumer electronics and notebooks in the United States. These declines were partially offset by growth of 13% in advanced solutions offerings in the region, driven by cyber security, storage and networking offerings in the United States. The regions cloud-based solutions also experienced growth of 60% in Fiscal Year 2022 (Successor) compared to the Unaudited Pro Forma Combined 2021 Period.
The 11.8% decrease in our EMEA net sales for Fiscal Year 2022 (Successor) compared to the Unaudited Pro Forma Combined 2021 Period includes the translation impact of foreign currencies relative to the U.S. dollar, which had a negative impact on the regions net sales growth of approximately 10%. The decline in the region was driven by a decrease of 16% in client and endpoint solutions due to the negative impact of supply constraints in Fiscal Year 2022 (Successor) compared to the Unaudited Pro Forma Combined 2021 Period, which saw higher
128
Table of Contents
levels of demand. Declines were most notable in notebooks in France and Spain, components in Germany and the Netherlands, as well as tablets in Germany. Other services net sales also decreased by 56% as a result of the CLS Sale. These declines were partially offset by a 10% increase in advanced solutions offerings, particularly networking offerings in Germany and the UK, server offerings in Belgium and the Netherlands, as well as storage offerings in Belgium and Sweden. On a constant currency basis, client and endpoint solutions net sales decreased by 6%, Other services net sales decreased by 51%, advanced solutions net sales increased by 21% and cloud-based solutions net sales increased by 19%.
The 3.7% decrease in our Asia-Pacific net sales for Fiscal Year 2022 (Successor) compared to the Unaudited Pro Forma Combined 2021 Period includes the translation impact of foreign currencies relative to the U.S. dollar, which had a negative impact on the regions net sales growth of approximately 5%. Overall, the decline in the region was driven by a decrease of 7% in client and endpoint solutions, most notably related to a decline in mobility distribution, components and tablets in China, as well as components in Australia. Additionally, Other services net sales decreased by 42% as a result of the CLS Sale. These declines were partially offset by growth in advanced solutions offerings of 6%, driven by server offerings in India, cyber security in India and Singapore, as well as specialty offerings of UCC and Telephony in India. On a constant currency basis, advanced solutions net sales increased by 11%, cloud-based solutions net sales increased by 21%, client and endpoint solutions net sales decreased by 1% and Other services net sales decreased by 39%.
The 1.3% increase in Latin American net sales for Fiscal Year 2022 (Successor) compared to the Unaudited Pro Forma Combined 2021 Period includes the translation impact of foreign currencies relative to the U.S. dollar, which had a negative impact on the regions net sales growth of approximately 2%. Overall, the growth in the region was driven by an increase of 13% in advanced solutions offerings, specifically cyber security offerings in Brazil, as well as networking offerings in Brazil, Miami Export and Mexico. Additionally, cloud-based solutions net sales increased by 42%, largely due to growth in Brazil. This growth was partially offset by a decline in client and endpoint solutions of 1%, primarily attributed to notebooks in Chile and accessories in Miami Export. On a constant currency basis, advanced solutions net sales increased by 15%, cloud-based solutions net sales increased by 40%, client and endpoint solutions net sales increased by less than 1% and Other services net sales decreased by 53%.
Gross profit decreased by $417,081, or 10.1%, in Fiscal Year 2022 (Successor) compared to the Unaudited Pro Forma Combined 2021 Period and gross margin decreased 28 basis points. The translation impact of foreign currencies relative to the U.S. dollar had a negative impact of 4% on gross profit growth and a negative impact of 2 basis points on gross margin. This decrease was primarily attributable to the decline in our share of net sales from our Other services in Fiscal Year 2022 (Successor) compared to the Unaudited Pro Forma Combined 2021 Period, which is due to the lower fee-for-service net sales resulting from the CLS Sale. Additionally, client and endpoint solutions experienced softer demand and product constraints during Fiscal Year 2022 (Successor) compared to the Unaudited Pro Forma Combined 2021 Period, which benefited from higher selling prices due to comparatively higher demand, particularly for work-from-home and learn-from-home technologies. The decrease was partially offset by the result of a negative inventory revaluation in our U.S. Reverse Logistics and Repair business in the Unaudited Pro Forma Combined 2021 Period, of $77,933, which had a negative impact of 14 basis points to gross margin in the Unaudited Pro Forma Combined 2021 Period.
Total SG&A expenses, decreased $478,507, or 14.9%, in Fiscal Year 2022 (Successor) compared to the Unaudited Pro Forma Combined 2021 Period. The translation impact of foreign currencies relative to the U.S. dollar had a positive impact of 4% on SG&A expenses. The decrease in SG&A expenses was driven by lower compensation and headcount expenses of 75 basis points, lower rental and occupancy costs of 15 basis points, lower depreciation costs of 11 basis points and lower shipping and supply costs of 9 basis points. Each of these factors were primarily the result of the CLS Sale and diligent management of discretionary expenses. These decreases were partially offset by a decrease of 56 basis points on lower cost absorption to margin, primarily as a result of the CLS Sale. Additionally, the Unaudited Pro Forma Combined 2021 Period included the benefit of a reversal of an accrual recorded in prior years related to an ICMS tax assessment in Brazil totaling $13,642.
129
Table of Contents
Income from operations margin in Fiscal Year 2022 (Successor) increased 4.94% compared to the Unaudited Pro Forma Combined 2021 Period due to the gain of $2,283,820, or 4.49%, that was recorded as a result of the CLS Sale, as well as a reduction in SG&A expenses described above. Additionally, income from operations margin was negatively impacted in the Unaudited Pro Forma Combined 2021 Period by Imola Merger-related costs further discussed below, which had a negative impact of 21 basis points, as well as an inventory revaluation in our U.S. Reverse Logistics and Repair business, most of which was in gross margin, which had a negative impact of 15 basis points. The translation impact of foreign currencies relative to the U.S. dollar had a negative impact of 11 basis points on our consolidated income from operations margin.
Our North American income from operations margin increased 29 basis points in Fiscal Year 2022 (Successor) compared to the Unaudited Pro Forma Combined 2021 Period. This was primarily driven by an inventory revaluation charge in the Unaudited Pro Forma Combined 2021 Period of $82,056, or 37 basis points, of North America net sales in our U.S. Reverse Logistics and Repair business, most of which was in gross margin that did not recur in 2022. Income from operations margin was negatively impacted by the decline in our share of revenue and margin from our Other services, as a result of the CLS Sale in Fiscal Year 2022 (Successor). Additionally, lower revenue and margin from client and endpoint solutions as a result of softer demand during Fiscal Year 2022 (Successor) translated into a decline in income from operations margin. The region was also impacted by certain corporate charges of $11,337 related to the discontinuation of our Cloud operations in Russia, which had a negative impact of 5 basis points on North American income from operations margin in Fiscal Year 2022 (Successor). These factors were partially offset by lower SG&A expenses, including a decrease in compensation and headcount expenses of 27 basis points, a decrease in rental and occupancy costs of 18 basis points, a decrease in depreciation expense of 17 basis points and a decrease in shipping and supply costs of 10 basis points, primarily as a result of the CLS Sale.
Our EMEA income from operations margin decreased 3 basis points in Fiscal Year 2022 (Successor), compared to the Unaudited Pro Forma Combined 2021 Period, driven primarily by the negative impact from the decline in our share of revenue and margin from our Other services, as a result of the CLS Sale in Fiscal Year 2022 (Successor). Additionally, lower revenue and margin from client and endpoint solutions as a result of softer demand during Fiscal Year 2022 (Successor) translated into a decline in income from operations margin. Additionally, the decrease was driven by a legal fine in our French operations of 14 basis points, as well as an increase in write-offs for excess and obsolete inventory of 10 basis points. These results were partially offset by lower operating expenses, including decreased compensation and headcount expenses of 201 basis points, decreased rental and occupancy costs of 22 basis points and a decreased shipping and supply costs of 14 basis points. These factors are primarily the result of the CLS Sale. The translation impact of foreign currencies relative to the U.S. dollar had a negative impact of 22 basis points on the regions income from operations margin.
Our Asia-Pacific income from operations margin increased 9 basis points in Fiscal Year 2022 (Successor) compared to the Unaudited Pro Forma Combined 2021 Period largely due to a shift in sales mix towards our higher-margin advanced solutions offerings. Additionally, the region diligently managed SG&A expenses, including a decrease in compensation and headcount expenses of 152 basis points, a decrease in bad debt expense of 24 basis points, a decrease in rental and occupancy costs of 3 basis points, a decrease in depreciation expense of 2 basis points, as well as a decrease in amortization expense of 2 basis points. These results were partially offset by lower net sales volumes, most notably in client and endpoint solutions, as a result of softer demand during Fiscal Year 2022 (Successor), as well as higher write-offs for excess and obsolete inventory of 9 basis points due to the build-up of inventory, particularly in China where significant COVID-related restrictions continued through much of 2022. The translation impact of foreign currencies relative to the U.S. dollar had a negative impact of 15 basis points on the regions income from operations margin.
Our Latin American income from operations margin decreased 44 basis points in Fiscal Year 2022 (Successor) compared to the Unaudited Pro Forma Combined 2021 Period primarily due to lower volume and margin as a result of softer demand, primarily for client and endpoint solutions. Income from operations margin was also negatively impacted by the CLS Sale in Fiscal Year 2022 (Successor), which resulted in lower revenue
130
Table of Contents
and margin from our Other services. Additionally, write-offs for excess and obsolete inventory increased by 26 basis points as a result of inventory build-up during Fiscal Year 2022 (Successor) in response to supply constraints. The region also saw an increase in rental and occupancy costs of 5 basis points, as well as outside consulting fees of 4 basis points. The translation impact of foreign currencies relative to the U.S. dollar had a negative impact of 24 basis points on the regions income from operations margin.
In Fiscal Year 2022 (Successor), Corporate consisted primarily of $25,000 of advisory fees paid to Platinum Advisors, $21,886 related to executive transition agreements, and $16,033 related to investments in certain initiatives to accelerate our growth and profitability and optimize our operations following the Imola Mergers. In the Unaudited Pro Forma Combined 2021 Period, Corporate costs consisted primarily of merger-related costs of $116,646, which included commitment fees, placement fees and other transaction costs for advisory and professional fees related to the Imola Mergers, $75,000 of expense related to the true-up in value of the contingent consideration resulting from the Imola Mergers, $15,822 of fees related to investments in certain initiatives to accelerate our growth and profitability and optimize our operations following the acquisition by Platinum and $25,000 of advisory fees paid to Platinum Advisors. Corporate costs also included $9,400 related to an executive transition agreement.
Cash-based compensation expense decreased by $20,586 in Fiscal Year 2022 (Successor) compared to the Unaudited Pro Forma Combined 2021 Period due to fewer awards granted in Fiscal Year 2022 (Successor) compared to the Unaudited Pro Forma Combined 2021 Period.
Total other (income) expense consists primarily of interest income, interest expense, foreign currency exchange gains and losses and other non-operating gains and losses. We incurred total other (income) expense of $434,389 in Fiscal Year 2022 (Successor) compared to $312,702 in the Unaudited Pro Forma Combined 2021 Period. Interest expense was $320,230 in Fiscal Year 2022 (Successor) compared to $312,642 in the Unaudited Pro Forma Combined 2021 Period. Additionally, we incurred a foreign exchange loss of $69,597 in Fiscal Year 2022 (Successor) compared to a loss of $18,892 in the Unaudited Pro Forma Combined 2021 Period. Further, we recorded a loss of 5 basis points as a percentage of net sales related to valuation of an equity investment in Fiscal Year 2022 (Successor) compared to a gain of 5 basis points on the same equity investment in the Unaudited Pro Forma Combined 2021 Period.
We recorded an income tax provision of $420,052, or an effective tax rate of 14.9%, in Fiscal Year 2022 (Successor) compared to $110,136, or an effective tax rate of 23.1%, in the Unaudited Pro Forma Combined 2021 Period. Fiscal Year 2022 (Successor) included $2,283,820 of income from the CLS Sale, which had an income tax provision of $246,450, or an effective tax rate of 10.8 percentage points. The low effective tax rate on the CLS Sale was primarily due to the gain on sale of European subsidiaries being tax exempt due to the participation exemption in Europe. In addition, Fiscal Year 2022 (Successor) also included $8,795 of withholding tax expense, or 0.3 percentage points of the effective rate, due to a dividend from our Canadian subsidiary. Our Fiscal Year 2022 (Successor) income that was not part of the CLS Sale was taxed at a higher rate resulting in an overall effective tax rate of 14.9 percentage points. The income tax provision for the Unaudited Pro Forma Combined 2021 Period included $63,519 and $9,120 of non-cash tax benefits, or 13.3 percentage points and 1.9 percentage points of the effective rate, related to the reversal of the full valuation allowance against Luxembourg and Belgium deferred tax assets, respectively; and $14,115 of non-cash tax benefits, or 3.0 percentage points of the effective rate, related to establishment of net deferred tax assets for basis differences on held for sale subsidiaries. The tax benefits are partially offset by the impact of the Imola Mergers non-recurring expenses, including $18,750, or 3.9 percentage points of the effective rate, related to a non-deductible expense related to the contingent consideration provided in the Imola Mergers and $8,428, or 1.8 percentage points of the effective rate, related to non-deductible transaction costs. In addition, there is an impact of $19,564, or 4.1 percentage points of the effective tax rate, due to additional U.S. federal non-cash tax expenses on foreign earnings associated with non-recurring transactions. The tax provision for the Unaudited Pro Forma Combined 2021 Period also included other items that resulted in net tax expenses of $11,134, or 2.3 percentage points of the effective tax rate.
131
Table of Contents
Non-GAAP Financial Measures
We believe that, in addition to our results determined in accordance with GAAP, EBITDA and Adjusted EBITDA, Adjusted Income from Operations, Adjusted Income from Operations Margin, Adjusted Free Cash Flow, Non-GAAP Net Income and Adjusted Return on Invested Capital are useful in evaluating our business and the underlying trends that are affecting our performance. The non-GAAP measures noted above are primary indicators that our management uses internally to conduct and measure its business and evaluate the performance of its consolidated operations. Our management believes these non-GAAP financial measures are useful as they provide meaningful comparisons to prior periods and an alternate view of the impact of acquired businesses. These non-GAAP financial measures are used in addition to and in conjunction with results presented in accordance with GAAP. These non-GAAP financial measures reflect an additional way of viewing aspects of our operations that, when viewed with our GAAP results and the accompanying reconciliations to corresponding GAAP financial measures, provide a more complete understanding of factors and trends affecting our business. A material limitation associated with these non-GAAP measures as compared to the GAAP measures is that they may not be comparable to other companies with similarly titled items that present related measures differently. The non-GAAP measures should be considered as a supplement to, and not as a substitute for or superior to, the corresponding measures calculated in accordance with GAAP. See Managements Discussion and Analysis of Financial Condition and Results of OperationsNon-GAAP Financial Measures and Summary Historical and Unaudited Pro Forma Condensed Combined Financial and Other Data for explanations of how we calculate these measures and for reconciliation to the most directly comparable financial measure stated in accordance with GAAP.
EBITDA and Adjusted EBITDA
We regularly monitor EBITDA and Adjusted EBITDA internally to conduct and measure our business and evaluate the performance of our consolidated operations. Management believes that in addition to our results determined in accordance with GAAP, EBITDA and Adjusted EBITDA are useful in evaluating our business and the underlying trends that are affecting our performance because they are key measures used by our management, Platinum and board of directors to evaluate our operating performance, generate future operating plans and make strategic decisions regarding the allocation of capital. In particular, the exclusion of certain expenses in calculating EBITDA and Adjusted EBITDA facilitate operating performance comparisons on a period-to-period basis and excludes items that we do not consider to be indicative of our core operating performance.
EBITDA is calculated as net income before net interest expense, income taxes, depreciation and amortization expenses. We define Adjusted EBITDA as EBITDA adjusted to give effect to (i) restructuring costs incurred primarily related to employee termination benefits in connection with actions to align our cost structure in certain markets, (ii) net realized and unrealized foreign currency exchange gains and losses, including net gains and losses on derivative instruments not receiving hedge accounting treatment, (iii) costs of integration, transition and operational improvement initiatives primarily related to professional, consulting, integration and implementation costs associated with the Imola Mergers, as well as consulting, retention and transition costs associated with our organizational effectiveness programs charged to SG&A expenses, (iv) annual advisory fee paid to Platinum Advisors under the Advisory Agreement (which will be terminated upon the consummation of this offering), (v) cash-based compensation expense associated with our cash-based long-term incentive program for certain employees in lieu of equity-based compensation, and which we expect to revert back to an equity-based program in the future under the 2024 Plan, see Executive CompensationCompensation Discussion and Analysis and (vi) certain other items as defined in our Credit Agreements.
EBITDA and Adjusted EBITDA are non-GAAP financial measures and are not intended to replace financial performance measures determined in accordance with GAAP, such as income from operations and net income. Rather, we present EBITDA and Adjusted EBITDA as supplemental measures of our performance. As non-GAAP financial measures, our computation of EBITDA and Adjusted EBITDA may vary from similarly termed non-GAAP financial measures used by other companies, making comparisons with other companies on the basis of these measures impracticable.
132
Table of Contents
EBITDA and Adjusted EBITDA are used to facilitate a comparison of the ordinary, ongoing and customary course of our operations on a consistent basis from period to period and provides an additional understanding of factors and trends affecting our business. Such measures do not necessarily indicate whether cash flow will be sufficient or available to meet our cash requirements and may not be indicative of our historical operating results, nor are such measures meant to be predictive of our future results. EBITDA and Adjusted EBITDA have limitations as analytical tools, and you should not consider either measure in isolation or as a substitute for analysis of our results as reported under GAAP. Some of these limitations are:
| | they do not reflect our cash expenditures or future requirements for capital expenditures or contractual commitments; |
| | they do not reflect changes in, or cash requirements for, our working capital needs; |
| | they do not reflect the significant interest expense, or the cash requirements necessary, to service interest or principal payments on our debts; |
| | although depreciation and amortization are non-cash charges, the assets being depreciated and amortized will often need to be replaced in the future and EBITDA and Adjusted EBITDA do not reflect any cash requirements that would be required for such replacements; and |
| | some of the exceptional items that we eliminate in calculating EBITDA and Adjusted EBITDA reflect cash payments that were made, or will in the future be made. |
The following table reconciles net income to EBITDA and Adjusted EBITDA for each of the periods indicated:
| Predecessor | Successor | |||||||||||||||||||||||||||
| Predecessor 2021 Period |
Successor 2021 Period |
Fiscal Year 2022 |
Fiscal Year 2023 |
Unaudited 2023 Interim Period |
Unaudited 2024 Interim Period |
|||||||||||||||||||||||
| (Amounts in thousands) |
Period from January 3, 2021 to July 2, 2021 |
Period from July 3, 2021 to January 1, 2022 |
Year Ended December 31, 2022 |
Year Ended December 30, 2023 |
Twenty-six Weeks Ended July 1, 2023 |
Twenty-six Weeks Ended June 29, 2024 |
||||||||||||||||||||||
| Net income |
$ | 378,475 | $ | 96,734 | $ | 2,394,489 | $ | 352,712 | $ | 129,405 | $ | 104,137 | ||||||||||||||||
| Interest income |
(11,744 | ) | (6,306 | ) | (22,911 | ) | (34,977 | ) | (16,381 | ) | (20,365 | ) | ||||||||||||||||
| Interest expense |
44,281 | 183,208 | 320,230 | 380,191 | 186,430 | 171,536 | ||||||||||||||||||||||
| Provision for income taxes |
126,479 | 20,023 | 420,052 | 169,789 | 59,956 | 55,707 | ||||||||||||||||||||||
| Depreciation and amortization |
99,542 | 137,484 | 197,111 | 184,148 | 94,238 | 92,461 | ||||||||||||||||||||||
|
|
|
|
|
|
|
|
|
|
|
|
|
|||||||||||||||||
| EBITDA |
$ | 637,033 | $ | 431,143 | $ | 3,308,971 | $ | 1,051,863 | $ | 453,648 | $ | 403,476 | ||||||||||||||||
|
|
|
|
|
|
|
|
|
|
|
|
|
|||||||||||||||||
| Restructuring costs |
202 | 831 | 10,138 | 18,797 | (171 | ) | 22,525 | |||||||||||||||||||||
| Net foreign currency exchange loss |
1,419 | 17,473 | 69,597 | 42,070 | 29,103 | 19,263 | ||||||||||||||||||||||
| Integration, transition and operational improvement costs (1) |
(7,817 | ) | 242,400 | (2,163,975 | ) | 127,261 | 64,024 | 65,523 | ||||||||||||||||||||
| Advisory fee |
| 12,500 | 25,000 | 25,000 | 12,500 | 12,500 | ||||||||||||||||||||||
| Cash-based compensation expense |
27,428 | 28,576 | 35,418 | 31,040 | 19,338 | 12,245 | ||||||||||||||||||||||
| Other |
(10,495 | ) | 13,355 | 64,250 | 57,061 | 25,289 | 33,467 | |||||||||||||||||||||
|
|
|
|
|
|
|
|
|
|
|
|
|
|||||||||||||||||
| Adjusted EBITDA |
$ | 647,770 | $ | 746,278 | $ | 1,349,399 | $ | 1,353,092 | $ | 603,731 | $ | 568,999 | ||||||||||||||||
|
|
|
|
|
|
|
|
|
|
|
|
|
|||||||||||||||||
| (1) | Includes the gain on CLS Sale. |
133
Table of Contents
Non-GAAP Net Income
We define Non-GAAP Net Income as Net Income adjusted to give effect to (i) amortization of intangibles, (ii) restructuring costs incurred primarily related to employee termination benefits in connection with actions to align our cost structure in certain markets, (iii) net realized and unrealized foreign currency exchange gains and losses including net gains and losses on derivative instruments not receiving hedge accounting treatment, (iv) costs of integration, transition, and operational improvement initiatives primarily related to professional, consulting, integration and implementation costs associated with the Imola Mergers, as well as consulting, retention and transition costs associated with our organizational effectiveness programs charged to selling, general and administrative expenses, (v) annual advisory fee paid to Platinum Advisors under the Advisory Agreement (which will be terminated upon the consummation of this offering), (vi) cash-based compensation expense associated with our cash-based long-term incentive program for certain employees in lieu of equity-based compensation, and which we expect to revert back to an equity-based program in the future under the 2024 Plan, see Executive CompensationCompensation Discussion and Analysis, (vii) certain other items as defined in our Credit Agreements, (viii) the GAAP tax provisions for and/or valuation allowances on items (i), (ii), (iii), (iv), (v), (vi) and (vii), and (ix) the GAAP tax provisions for and/or valuation allowances on large non-recurring or discrete items. This metric differs from Adjusted Net Income, which is a component of Adjusted ROIC as shown above.
In a manner consistent with EBITDA and Adjusted EBITDA discussed above, we regularly monitor Non-GAAP Net Income internally to conduct and measure our business and evaluate the performance of our consolidated operations. Management believes that in addition to our results determined in accordance with GAAP, Non-GAAP Net Income is useful in evaluating our business and the underlying trends that are affecting our performance because it applies a tax-effected profitability metric that is useful in evaluating our business and the underlying trends that are affecting our performance, and Non-GAAP Net Income is a key measure used by our management, Platinum and our board of directors to evaluate our financial performance, generate future financial plans and make strategic decisions regarding the allocation of capital. Furthermore, the exclusion of certain items in reconciling from Net Income to Non-GAAP Net Income helps to facilitate operating performance comparisons on a period-to-period basis because it excludes certain items that we do not consider to be indicative of our core financial performance.
Non-GAAP Net Income is a non-GAAP financial measure and is not intended to replace financial performance measures determined in accordance with GAAP, such as net income. Rather, we present Non-GAAP Net Income as a supplemental measure of our performance. As a non-GAAP financial measure, our computation of Non-GAAP Net Income may vary from similarly termed non-GAAP financial measures used by other companies, making comparisons with other companies on the basis of the measure impracticable.
134
Table of Contents
The following table reconciles net income to Non-GAAP Net Income for each of the periods indicated:
| Predecessor | Successor | |||||||||||||||||||||||||||
| Predecessor 2021 Period |
Successor 2021 Period |
Fiscal Year 2022 |
Fiscal Year 2023 |
Unaudited 2023 Interim Period |
Unaudited 2024 Interim Period |
|||||||||||||||||||||||
| (Amounts in thousands) |
Period from January 3, 2021 to July 2, 2021 |
Period from July 3, 2021 to January 1, 2022 |
Year Ended December 31, 2022 |
Year Ended December 30, 2023 |
Twenty-six Weeks Ended July 1, 2023 |
Twenty-six Weeks Ended June 29, 2024 |
||||||||||||||||||||||
| Net income |
$ | 378,475 | $ | 96,734 | $ | 2,394,489 | $ | 352,712 | $ | 129,405 | $ | 104,137 | ||||||||||||||||
| Pre-tax adjustments: |
||||||||||||||||||||||||||||
| Amortization of intangibles |
31,799 | 50,462 | 91,039 | 87,003 | 43,523 | 43,494 | ||||||||||||||||||||||
| Restructuring costs |
202 | 831 | 10,138 | 18,797 | (171 | ) | 22,525 | |||||||||||||||||||||
| Net foreign currency exchange (gain) loss |
1,419 | 17,473 | 69,597 | 42,070 | 29,103 | 19,263 | ||||||||||||||||||||||
| Integration, transition and operational improvement costs (a) |
(7,817 | ) | 242,400 | (2,163,975 | ) | 127,261 | 64,024 | 65,523 | ||||||||||||||||||||
| Advisory fee |
| 12,500 | 25,000 | 25,000 | 12,500 | 12,500 | ||||||||||||||||||||||
| Cash-based compensation expense |
27,428 | 28,576 | 35,418 | 31,040 | 19,338 | 12,245 | ||||||||||||||||||||||
| Other items |
(14,874 | ) | 11,016 | 53,634 | 47,629 | 19,576 | 27,830 | |||||||||||||||||||||
| Tax Adjustments: |
||||||||||||||||||||||||||||
| Tax impact of pre-tax adjustments excluding gain on CLS Sale (b) |
(9,804 | ) | (58,772 | ) | (88,772 | ) | (95,539 | ) | (48,881 | ) | (50,724 | ) | ||||||||||||||||
| Tax impact of Luxembourg valuation allowance reversal (c) |
| (63,519 | ) | | | | | |||||||||||||||||||||
| Tax impact of gain on CLS Sale (d) |
| (11,115 | ) | 246,450 | | | | |||||||||||||||||||||
| Other miscellaneous tax adjustments (e) |
(6,316 | ) | (4,585 | ) | 5,728 | 2,145 | 188 | (1,166 | ) | |||||||||||||||||||
|
|
|
|
|
|
|
|
|
|
|
|
|
|||||||||||||||||
| Non-GAAP Net Income |
$ | 400,512 | $ | 322,001 | $ | 678,746 | $ | 638,118 | $ | 268,605 | $ | 255,627 | ||||||||||||||||
|
|
|
|
|
|
|
|
|
|
|
|
|
|||||||||||||||||
| (a) | Includes the gain on CLS Sale. |
| (b) | Tax impact of pre-tax adjustments (excluding tax on the gain on CLS Sale, which is presented separately in item (d) below) reflects the current and deferred income taxes associated with the above pre-tax adjustments in arriving at Non-GAAP Net Income. |
| (c) | In the Successor 2021 Period, we concluded that NOLs related to our Luxembourg treasury operations, would be more likely than not realizable, which resulted in a valuation allowance release that generated a non-cash income tax benefit of $63,519. We excluded the material change in our valuation allowance to provide a more meaningful evaluation of Non-GAAP Net Income. |
| (d) | In the Successor 2021 Period, we excluded certain tax adjustments included within our provision for income taxes under GAAP for temporary and permanent differences in stock basis and pre-transaction intercompany sales related to the CLS Sale to provide a more meaningful evaluation of our Non-GAAP Net Income. In Fiscal Year 2022 (Successor), we recorded $246,450 tax expense related to the gain on CLS sale. |
| (e) | Other miscellaneous tax adjustments represent non-recurring adjustments resulting from valuation allowance adjustments of ($11,478), $4,257, and ($2,608) in the Predecessor 2021 Period, Fiscal Year 2022 (Successor) and Fiscal Year 2023 (Successor); adjustments of uncertain tax liabilities of $1,484, |
135
Table of Contents
| ($2,759), ($5,710) and ($2,299) in the Predecessor 2021 Period, the Successor 2021 Period, Fiscal Year 2022 (Successor) and the Unaudited 2024 Interim Period (Successor); $8,795 of withholding tax expense due to a dividend from our Canadian subsidiary in Fiscal Year 2022 (Successor); and other minor non-recurring items. |
Adjusted Income from Operations and Adjusted Income from Operations Margin
We regularly monitor Adjusted Income from Operations internally to conduct and measure our business and evaluate the performance of our consolidated operations. We define Adjusted Income from Operations for a particular period as income from operations plus (i) amortization of intangibles, (ii) restructuring costs incurred primarily related to employee termination benefits in connection with actions to align our cost structure in certain markets, (iii) integration and transition costs and (iv) advisory fee paid to Platinum Advisors under the Advisory Agreement (which will be terminated upon the consummation of this offering). Adjusted Income from Operations Margin is calculated as Adjusted Income from Operations, as defined above, divided by net sales. Adjusted Income from Operations and Adjusted Income from Operations Margin have limitations as analytical tools, and you should not consider either measure in isolation or as a substitute for analysis of our results as reported under GAAP. Adjusted Income from Operations is a key measure used by our management and board of directors to understand and evaluate our operating performance and trends by removing the impact of non-operational factors.
| Predecessor | Successor | |||||||||||||||||||||||||||
| Predecessor 2021 Period |
Successor 2021 Period |
Fiscal Year 2022 |
Fiscal Year 2023 |
Unaudited 2023 Interim Period |
Unaudited 2024 Interim Period |
|||||||||||||||||||||||
| (Amounts in thousands) |
Period from January 3, 2021 to July 2, 2021 |
Period from July 3, 2021 to January 1, 2022 |
Year Ended December 31, 2022 |
Year Ended December 30, 2023 |
Twenty-six Weeks Ended July 1, 2023 |
Twenty-six Weeks Ended June 29, 2024 |
||||||||||||||||||||||
| Income from operations |
$ | 525,500 | $ | 323,760 | $ | 3,248,930 | $ | 944,347 | $ | 401,010 | $ | 351,249 | ||||||||||||||||
| Amortization of intangibles |
31,799 | 50,462 | 91,039 | 87,003 | 43,523 | 43,494 | ||||||||||||||||||||||
| Restructuring costs |
202 | 831 | 10,138 | 18,797 | (171 | ) | 22,525 | |||||||||||||||||||||
| Integration and transition costs (1) |
(7,817 | ) | 226,353 | (2,212,975 | ) | 28,414 | 8,387 | 10,707 | ||||||||||||||||||||
| Advisory fee |
| 12,500 | 25,000 | 25,000 | 12,500 | 12,500 | ||||||||||||||||||||||
|
|
|
|
|
|
|
|
|
|
|
|
|
|||||||||||||||||
| Adjusted Income from Operations |
$ | 549,684 | $ | 613,906 | $ | 1,162,132 | $ | 1,103,561 | $ | 465,249 | $ | 440,475 | ||||||||||||||||
|
|
|
|
|
|
|
|
|
|
|
|
|
|||||||||||||||||
| Net sales |
26,406,869 | 28,048,703 | 50,824,490 | 48,040,364 | 23,095,490 | 22,876,373 | ||||||||||||||||||||||
|
|
|
|
|
|
|
|
|
|
|
|
|
|||||||||||||||||
| Income from operations margin |
1.99 | % | 1.15 | % | 6.39 | % | 1.97 | % | 1.74 | % | 1.54 | % | ||||||||||||||||
|
|
|
|
|
|
|
|
|
|
|
|
|
|||||||||||||||||
| Adjusted Income from Operations Margin |
2.08 | % | 2.19 | % | 2.29 | % | 2.30 | % | 2.01 | % | 1.93 | % | ||||||||||||||||
|
|
|
|
|
|
|
|
|
|
|
|
|
|||||||||||||||||
| (1) | Includes the gain on CLS Sale. |
136
Table of Contents
Return on Invested Capital
To provide investors with additional information regarding our financial results, we have disclosed in the table below and elsewhere in this prospectus Return on Invested Capital.
| Predecessor | Successor | |||||||||||||||||||||||||||
| Predecessor 2021 Period |
Successor 2021 Period |
Fiscal Year 2022 |
Fiscal Year 2023 |
Unaudited 2023 Interim Period |
Unaudited 2024 Interim Period |
|||||||||||||||||||||||
| (Amounts in thousands) |
Period from January 3, 2021 through July 2, 2021 |
Period from July 3, 2021 through January 1, 2022 |
Year Ended December 31, 2022 |
Year Ended December 30, 2023 |
Twenty-six Weeks Ended July 1, 2023 |
Twenty-six Weeks Ended June 29, 2024 |
||||||||||||||||||||||
| Net income |
$ | 378,475 | $ | 96,734 | $ | 2,394,489 | $ | 352,712 | $ | 129,405 | $ | 104,137 | ||||||||||||||||
| Stockholders equity |
5,161,145 | 2,693,429 | 3,058,068 | 3,506,289 | 3,251,367 | 3,463,705 | ||||||||||||||||||||||
| Long-term debt |
7,687 | 4,640,888 | 4,174,027 | 3,657,889 | 3,673,590 | 3,423,377 | ||||||||||||||||||||||
| Short-term debt and current maturities of long-term debt |
149,234 | 179,332 | 200,327 | 265,719 | 216,423 | 206,153 | ||||||||||||||||||||||
| Cash and cash equivalents (1) |
(1,553,079 | ) | (1,251,608 | ) | (1,320,137 | ) | (948,490 | ) | (1,132,792 | ) | (928,762 | ) | ||||||||||||||||
|
|
|
|
|
|
|
|
|
|
|
|
|
|||||||||||||||||
| Invested capital |
3,764,987 | 6,262,041 | 6,112,285 | 6,481,407 | 6,008,588 | 6,164,473 | ||||||||||||||||||||||
|
|
|
|
|
|
|
|
|
|
|
|
|
|||||||||||||||||
| Return on invested capital (2) (3) |
20.1 | % | 3.1 | % | 39.2 | % | 5.4 | % | 4.3 | % | 3.4 | % | ||||||||||||||||
|
|
|
|
|
|
|
|
|
|
|
|
|
|||||||||||||||||
| Period in weeks for non-52 week periods |
26 | 26 | 52 | 52 | 26 | 26 | ||||||||||||||||||||||
| Number of weeks |
52 | 52 | 52 | 52 | 52 | 52 | ||||||||||||||||||||||
| (1) | Cash and cash equivalents for the Successor 2021 Period includes $23,729 of cash held for sale. |
| (2) | Return on Invested Capital is defined as net income divided by the invested capital for the period. Invested capital is equal to stockholders equity plus long-term debt plus short-term debt and the current maturities of long-term debt less cash and cash equivalents at the end of each period. |
| (3) | Calculation for Fiscal Year 2022 (Successor) includes a gain of $2,283,820 as a result of the CLS Sale. |
Adjusted Return on Invested Capital
We regularly monitor Adjusted Return on Invested Capital internally to conduct and measure our business and evaluate the performance of our consolidated operations. Adjusted Return on Invested Capital is defined as Adjusted Net Income divided by the invested capital for the period. Adjusted Net Income for a particular period is defined as net income plus (i) other income/expense, (ii) amortization of intangibles, (iii) restructuring costs incurred primarily related to employee termination benefits in connection with actions to align our cost structure in certain markets, (iv) integration and transition costs, (v) the advisory fee paid to Platinum Advisors under the Advisory Agreement (which will be terminated upon the consummation of this offering), plus (vi) the GAAP tax provisions for and/or valuation allowances on items (i), (ii), (iii), (iv) and (v) plus (vii) the GAAP tax provisions for and/or valuation allowances on large non-recurring or discrete items. Invested capital is equity plus debt less cash and cash equivalents at the end of each period. Adjusted Return on Invested Capital provides a measure of the efficiency with which the Company invests its capital in the business. Adjusted Return on Invested Capital incorporates elements of both profit generation and the capital invested in the business and provides a meaningful gauge of the level of overall value generation when compared to the weighted average cost of capital. This methodology provides a clearer picture to investors of the ongoing business irrespective of temporary volatility
137
Table of Contents
that may result from non-recurring business activities including tax impacts thereon. Adjusted Return on Invested Capital has limitations as an analytical tool, and you should not consider it in isolation or as a substitute for analysis of our results as reported under GAAP.
| Predecessor | Successor | |||||||||||||||||||||||||||
| Predecessor 2021 Period |
Successor 2021 Period |
Fiscal Year 2022 |
Fiscal Year 2023 |
Unaudited 2023 Interim Period |
Unaudited 2024 Interim Period |
|||||||||||||||||||||||
| (Amounts in thousands) | Period from January 3, 2021 to July 2, 2021 |
Period from July 3, 2021 to January 1, 2022 |
Year Ended December 31, 2022 |
Year Ended December 30, 2023 |
Twenty-six Weeks Ended July 1, 2023 |
Twenty-six Weeks Ended June 29, 2024 |
||||||||||||||||||||||
| Net income |
$ | 378,475 | $ | 96,734 | $ | 2,394,489 | $ | 352,712 | $ | 129,405 | $ | 104,137 | ||||||||||||||||
| Pre-tax adjustments: |
||||||||||||||||||||||||||||
| Other (income) expense |
20,546 | 207,003 | 434,389 | 421,846 | 211,649 | 191,405 | ||||||||||||||||||||||
| Amortization of intangibles |
31,799 | 50,462 | 91,039 | 87,003 | 43,523 | 43,494 | ||||||||||||||||||||||
| Restructuring costs |
202 | 831 | 10,138 | 18,797 | (171 | ) | 22,525 | |||||||||||||||||||||
| Integration and transition costs |
(7,817 | ) | 226,353 | 70,845 | 28,414 | 8,387 | 10,707 | |||||||||||||||||||||
| Advisory fee |
| 12,500 | 25,000 | 25,000 | 12,500 | 12,500 | ||||||||||||||||||||||
| Gain on CLS Sale |
| | (2,283,820 | ) | | | | |||||||||||||||||||||
| Tax adjustments: |
||||||||||||||||||||||||||||
| Tax impact of pre-tax adjustments excluding gain on CLS Sale (a) |
(10,123 | ) | (63,373 | ) | (125,486 | ) | (124,331 | ) | (60,837 | ) | (62,056 | ) | ||||||||||||||||
| Tax impact of Luxembourg valuation allowance reversal (b) |
| (63,519 | ) | | | | | |||||||||||||||||||||
| Tax impact of gain on CLS Sale (c) |
| (11,115 | ) | 246,450 | | | | |||||||||||||||||||||
| Other discrete items (d) |
(6,316 | ) | (1,585 | ) | (3,067 | ) | (3,841 | ) | (172 | ) | (1,166 | ) | ||||||||||||||||
|
|
|
|
|
|
|
|
|
|
|
|
|
|||||||||||||||||
| Adjusted Net Income |
$ | 406,766 | $ | 454,291 | $ | 859,977 | $ | 805,600 | $ | 344,284 | $ | 321,546 | ||||||||||||||||
| Stockholders equity |
5,161,145 | 2,693,429 | 3,058,068 | 3,506,289 | 3,251,367 | 3,463,705 | ||||||||||||||||||||||
| Long-term debt |
7,687 | 4,640,888 | 4,174,027 | 3,657,889 | 3,673,590 | 3,423,377 | ||||||||||||||||||||||
| Short-term debt and current maturities of long-term debt |
149,234 | 179,332 | 200,327 | 265,719 | 216,423 | 206,153 | ||||||||||||||||||||||
| Cash and cash equivalents (e) |
(1,553,079 | ) | (1,251,608 | ) | (1,320,137 | ) | (948,490 | ) | (1,132,792 | ) | (928,762 | ) | ||||||||||||||||
|
|
|
|
|
|
|
|
|
|
|
|
|
|||||||||||||||||
| Invested capital |
3,764,987 | 6,262,041 | 6,112,285 | 6,481,407 | 6,008,588 | 6,164,473 | ||||||||||||||||||||||
| Number of Days |
181 | 183 | 364 | 364 | 182 | 182 | ||||||||||||||||||||||
|
|
|
|
|
|
|
|
|
|
|
|
|
|||||||||||||||||
| Adjusted Return on Invested Capital |
21.7 | % | 14.4 | % | 14.1 | % | 12.4 | % | 11.5 | % | 10.4 | % | ||||||||||||||||
|
|
|
|
|
|
|
|
|
|
|
|
|
|||||||||||||||||
| (a) | Tax impact of pre-tax adjustments (excluding tax on the gain on CLS Sale, which is presented separately in item (c) below) reflects the current and deferred income taxes associated with the above pre-tax adjustments in arriving at Adjusted Net Income. |
| (b) | In the Successor 2021 Period, we concluded that NOLs related to our Luxembourg treasury operations, would be more likely than not realizable, which resulted in a valuation allowance release that generated a non-cash income tax benefit of $63,519. We excluded the material change in our valuation allowance to provide a more meaningful evaluation of current income from operations. |
| (c) | In the Successor 2021 Period, we excluded certain tax adjustments included within our provision for income taxes under GAAP for temporary and permanent differences in stock basis and pre-transaction intercompany sales related to the CLS Sale to provide a more meaningful evaluation of our operating performance. In Fiscal Year 2022 (Successor), we recorded $246,450 tax expense related to the gain on CLS Sale. |
138
Table of Contents
| (d) | Other discrete items represent non-recurring adjustments resulting from valuation allowance adjustments of ($11,478), $4,257 and ($2,608) in the Predecessor 2021 Period, Fiscal Year 2022 (Successor) and Fiscal Year 2023 (Successor); adjustments of uncertain tax liabilities of $1,484, ($2,759), ($5,710) and ($2,299) in the Predecessor 2021 Period, Successor 2021 Period, Fiscal Year 2022 (Successor) and the Unaudited 2024 Interim Period (Successor); and other minor non-recurring items. |
| (e) | Cash and cash equivalents for the Successor 2021 Period includes $23,729 of cash held for sale. |
Adjusted Free Cash Flow
We regularly monitor Adjusted Free Cash Flow internally to conduct and measure our business and evaluate the performance of our consolidated operations and the generation of cash to fund financing and investing needs outside of capital expenditures. Adjusted Free Cash Flow means net income adjusted to give effect to (i) depreciation and amortization, (ii) other non-cash items and changes to non-working capital assets/liabilities, (iii) changes in working capital, (iv) proceeds from the deferred purchase price of factored receivables and (v) capital expenditures. Adjusted Free Cash Flow has limitations as an analytical tool, and you should not consider it in isolation or as a substitute for analysis of our results as reported under GAAP.
The following table reconciles net income to Adjusted Free Cash Flow:
| Predecessor | Successor | |||||||||||||||||||||||||||
| Predecessor 2021 Period |
|
Successor 2021 Period |
Fiscal Year 2022 |
Fiscal Year 2023 |
Unaudited 2023 Interim Period |
Unaudited 2024 Interim Period |
||||||||||||||||||||||
| (Amounts in thousands) | Period from January 3, 2021 to July 2, 2021 |
|
Period from July 3, 2021 to January 1, 2022 |
Year Ended December 31, 2022 |
Year Ended December 30, 2023 |
Twenty-six Weeks Ended July 1, 2023 |
Twenty-six Weeks Ended June 29, 2024 |
|||||||||||||||||||||
| Net income |
$ | 378,475 | $ | 96,734 | $ | 2,394,489 | $ | 352,712 | $ | 129,405 | $ | 104,137 | ||||||||||||||||
| Depreciation and amortization |
99,542 | 137,484 | 197,111 | 184,148 | 94,238 | 92,461 | ||||||||||||||||||||||
| Other non-cash items and changes to non-working capital assets/liabilities |
(286,637 | ) | 182,343 | (2,512,074 | ) | (177,842 | ) | (216,229 | ) | (167,279 | ) | |||||||||||||||||
| Changes in working capital |
(805,444 | ) | (184,798 | ) | (440,635 | ) | (300,194 | ) | 308,358 | 271,599 | ||||||||||||||||||
|
|
|
|
|
|
|
|
|
|
|
|
|
|||||||||||||||||
| Cash (used in) provided by operating activities |
(614,064 | ) | 231,763 | (361,109 | ) | 58,824 | 315,772 | 300,918 | ||||||||||||||||||||
| Capital expenditures |
(63,160 | ) | (86,584 | ) | (135,785 | ) | (201,535 | ) | (104,207 | ) | (68,688 | ) | ||||||||||||||||
| Proceeds from deferred purchase price of factored receivables |
50,429 | 60,304 | 145,003 | 162,622 | 76,418 | 128,515 | ||||||||||||||||||||||
|
|
|
|
|
|
|
|
|
|
|
|
|
|||||||||||||||||
| Adjusted Free Cash Flow |
$ | (626,795 | ) | $ | 205,483 | $ | (351,891 | ) | $ | 19,911 | $ | 287,983 | $ | 360,745 | ||||||||||||||
|
|
|
|
|
|
|
|
|
|
|
|
|
|||||||||||||||||
Liquidity and Capital Resources
Cash Flows
Our cash and cash equivalents totaled $1,227,879, $1,320,137, $948,490 and $928,762 at January 1, 2022, December 31, 2022, December 30, 2023 and June 29, 2024, respectively. We finance our working capital needs and investments in the business largely through net income before noncash items, available cash, trade and supplier credit and various financing facilities. As a distributor, our business requires significant investment in working capital, particularly trade accounts receivable and inventory, which is partially financed by vendor trade accounts payable. As a general rule, when sales volumes are increasing, our net investment in working capital dollars typically increases, which generally results in decreased cash flow generated from operating activities. Conversely, when sales volume decreases, our net investment in working capital decreases, which generally results in increases in cash flows generated from operating activities. Working capital dollars are calculated at any point in time by adding the trade accounts receivable and inventory less the trade accounts payable balance at
139
Table of Contents
that point in time. Our working capital dollars were $4,288,280 at January 1, 2022 (which includes applicable assets and liabilities held for sale), $4,294,200 at December 31, 2022, $4,417,984 at December 30, 2023 and $3,938,597 at June 29, 2024.
| Predecessor | Successor | |||||||||||||||||||||||
| Period from January 3, 2021 through July 2, 2021 |
Period from July 3, 2021 through January 1, 2022 |
Fiscal Year Ended 2022 |
Fiscal Year Ended 2023 |
Unaudited 2023 Interim Period |
Unaudited 2024 Interim Period |
|||||||||||||||||||
| Cash (used in) provided by: |
||||||||||||||||||||||||
| Operating activities |
$ | (614,064 | ) | $ | 231,763 | $ | (361,109 | ) | $ | 58,824 | $ | 315,772 | $ | 300,918 | ||||||||||
| Investing activities |
$ | (30,723 | ) | $ | (7,722,239 | ) | $ | 3,028,768 | $ | (17,714 | ) | $ | (28,852 | ) | $ | 47,067 | ||||||||
| Financing activities |
$ | 798,388 | $ | 7,257,854 | $ | (2,465,313 | ) | $ | (477,940 | ) | $ | (535,335 | ) | $ | (310,663 | ) | ||||||||
Operating activities used net cash of $614,064 during the Predecessor 2021 Period, provided net cash of $231,763 during the Successor 2021 Period, used net cash of $361,109 during Fiscal Year 2022 (Successor) and provided net cash of $58,824 during Fiscal Year 2023 (Successor). Operating activities provided net cash of $300,918 and $315,772 during the Unaudited 2024 Interim Period (Successor) and the Unaudited 2023 Interim Period (Successor), respectively. The net cash used from operations in the Predecessor 2021 Period primarily reflects the unfavorable impact of changes in working capital as we invested in working capital during that period to meet escalating demand levels, and lower net income, due to the fact that the Predecessor 2021 Period does not represent a full year of activity. The lower net cash provided during the Unaudited 2024 Interim Period (Successor), despite overall positive cash flow from net working capital reductions in the Unaudited 2024 Interim Period (Successor), particularly as a result of more favorable payment terms with our vendors and collection efforts on our receivables, was primarily driven by the prior year period benefiting from a significant reduction in inventory as we worked through significant product backlogs and supply constraints through the first three quarters of 2023.
The lower net cash provided from operations in the Successor 2021 Period primarily reflects the impact of changes in working capital as we continued to invest to support business growth, offset by the net income generated in the period despite the negative impact of merger-related costs incurred during the period. The net cash used in operations in Fiscal Year 2022 (Successor) compared to the Predecessor 2021 Period primarily reflects the more favorable changes in working capital, driven primarily by higher investments in working capital in the Predecessor 2021 Period as well as favorable extension of payments to vendors in Fiscal Year 2022 (Successor). The net cash used in operations in Fiscal Year 2022 (Successor) compared to net cash provided by the Successor 2021 Period primarily reflects unfavorable changes in working capital driven by higher accounts payable in the Successor 2021 Period due to favorable extension of payments, partially offset by higher accounts receivable and higher inventory levels in the Successor 2021 Period due to higher sales volume in the earlier period and higher inventory levels due to supply constraints experienced through much of 2022. In Fiscal Year 2022 (Successor), we invested net cash of $440,636 in working capital, which was likewise supporting areas of growth in the business, most notably in networking, servers and storage globally and our North America business as a whole, where several significant new customer wins required investment in working capital to support the first few quarters of ramp up. The net cash provided by operations in Fiscal Year 2023 (Successor) compared to net cash used in operating activities in Fiscal Year 2022 (Successor) was primarily driven by lower investment in working capital, particularly inventory as supply constraints that drove higher inventory investment through much of Fiscal Year 2022 (Successor) largely normalized over the course of the most recent year. This factor was partially offset by reductions in accounts payable as our vendors reduced temporary payment extensions related to the same normalization of supply constraints.
Investing activities used net cash of $30,723, $7,722,239, provided net cash of $3,028,768 and used net cash of $17,714 during the Predecessor 2021 Period, the Successor 2021 Period, Fiscal Year 2022 (Successor) and Fiscal Year 2023 (Successor), respectively. Investing activities provided net cash of $47,067 and used net cash of $28,852 during the Unaudited 2024 Interim Period (Successor) and the Unaudited 2023 Interim Period (Successor), respectively. The cash used in investing activities during the Predecessor 2021 Period was primarily
140
Table of Contents
driven by our capital expenditures of $63,160 and acquisitions of $14,625. This use of cash was partially offset by proceeds from deferred purchase price of factored receivables of $50,429. The cash used in investing activities during the Successor 2021 Period was primarily driven by cash consideration used in the Imola Mergers to acquire the shareholder capital of Ingram Micro of $8,044,012 and capital expenditures of $86,584, partially offset by cash received in the Imola Mergers of $351,632 and proceeds from deferred purchase price of factored receivables of $60,304. The net cash provided by investing activities during Fiscal Year 2022 (Successor) was driven by proceeds from the CLS Sale, net of cash sold of $2,977,825 and proceeds from deferred purchase price of factored receivables of $145,003, partially offset by capital expenditures of $135,785. The net cash used during Fiscal Year 2023 (Successor) was driven by capital expenditures of $201,535, partially offset by proceeds from deferred purchase price of factored receivables of $162,622 and proceeds from the CLS sale of $23,977. The net cash provided during the Unaudited 2024 Interim Period (Successor) was primarily driven by proceeds from the deferred purchase price of factored receivables of $128,515 and proceeds from notes receivable of $21,597, partially offset by capital expenditures of $68,688 and issuance of notes receivable of $43,374. The net cash used during the Unaudited 2023 Interim Period (Successor) was primarily driven by capital expenditures of $104,207, partially offset by proceeds from the deferred purchase price of factored receivables of $76,418.
Financing activities provided net cash of $798,388 and $7,257,854 during the Predecessor 2021 Period and the Successor 2021 Period, respectively, and used net cash of $2,465,313 and $477,940 during Fiscal Year 2022 (Successor) and Fiscal Year 2023 (Successor), respectively. Financing activities used net cash of $310,663 and $535,335 during the Unaudited 2024 Interim Period (Successor) and the Unaudited 2023 Interim Period (Successor), respectively. The net cash provided during the Predecessor 2021 Period is primarily driven by net proceeds of our revolving and other credit facilities of $1,016,844 and gross proceeds from other debt of $24,097, partially offset by dividend payments to our previous shareholders of $215,182 and gross repayments of other debt of $10,748. The net cash provided during the Successor 2021 Period primarily reflects net proceeds from debt issued in the Imola Mergers of $5,550,086, the capital contribution by Platinum of $2,638,000, gross proceeds from other debt of $45,987, and issuance of Class B shares of $20,000, and partially offset net repayments of our revolving and other credit facilities of $961,568 and gross repayments of other debt of $20,166. The net cash used in financing activities in Fiscal Year 2022 (Successor) primarily reflects dividends paid to shareholders of $1,753,697, following the CLS Sale, the repayment of our ABL Term Loan of $496,250, the payment of contingent consideration related to the Imola Mergers of $250,000, and gross repayments of other debt of $94,300, partially offset by net proceeds from our revolving and other credit facilities of $89,285 and gross proceeds from other debt of $50,116. The net cash used during Fiscal Year 2023 (Successor) was primarily driven by repayments on our term loan totaling $560,000 and gross repayments of other debt of $92,417, partially offset by gross proceeds of other debt of $72,351 and net proceeds from revolving and other credit facilities of $131,467. The net cash used during the Unaudited 2024 Interim Period (Successor) was primarily driven by the voluntary repayment of $150,000 on our Term Loan Credit Facility, net repayments of revolving and other credit facilities of $136,918, gross repayments of other debt of $49,833 the change in unremitted cash collections from servicing factored receivables of $8,630 and dividends paid to shareholders of $6,174, partially offset by gross proceeds from other debt of $41,826. The net cash used during the Unaudited 2023 Interim Period (Successor) primarily reflects voluntary repayments of $510,000 on our Term Loan Credit Facility, the change in unremitted cash collections from servicing factored receivables of $10,623, gross repayments of other debt of $17,927 and net repayments of our revolving and other credit facilities of $12,844, partially offset by gross proceeds from other debt of $17,078. For a further discussion of our dividend and of our debt, please see Note 16, Stockholders Equity, and Note 7, Debt, respectively, to our audited consolidated financial statements and Note 7, Debt, to our unaudited condensed consolidated financial statements.
Set forth below are the components of our working capital cycle, in days, as of July 2, 2021 (Predecessor), January 1, 2022 (Successor), December 31, 2022 (Successor), December 30, 2023 (Successor), July 1, 2023 (Successor) and June 29, 2024 (Successor). Working capital days are calculated by adding the days sales outstanding (DSO) and days inventory outstanding (DIO), less days payable outstanding (DPO). DSO is calculated by dividing the average of the beginning trade accounts receivable and the ending trade accounts
141
Table of Contents
receivable for the quarter by average net sales per day recognized during the quarter. DIO is calculated by dividing the average of the beginning inventory and ending inventory for the quarter by average cost of sales per day recognized during the quarter. DPO is calculated by dividing the average of the beginning trade accounts payable and the ending trade accounts payable for the quarter by average cost of sales per day recognized during the quarter. Working capital dollars are calculated at any point in time by adding the trade accounts receivable and inventory less the trade accounts payable balance at that point in time.
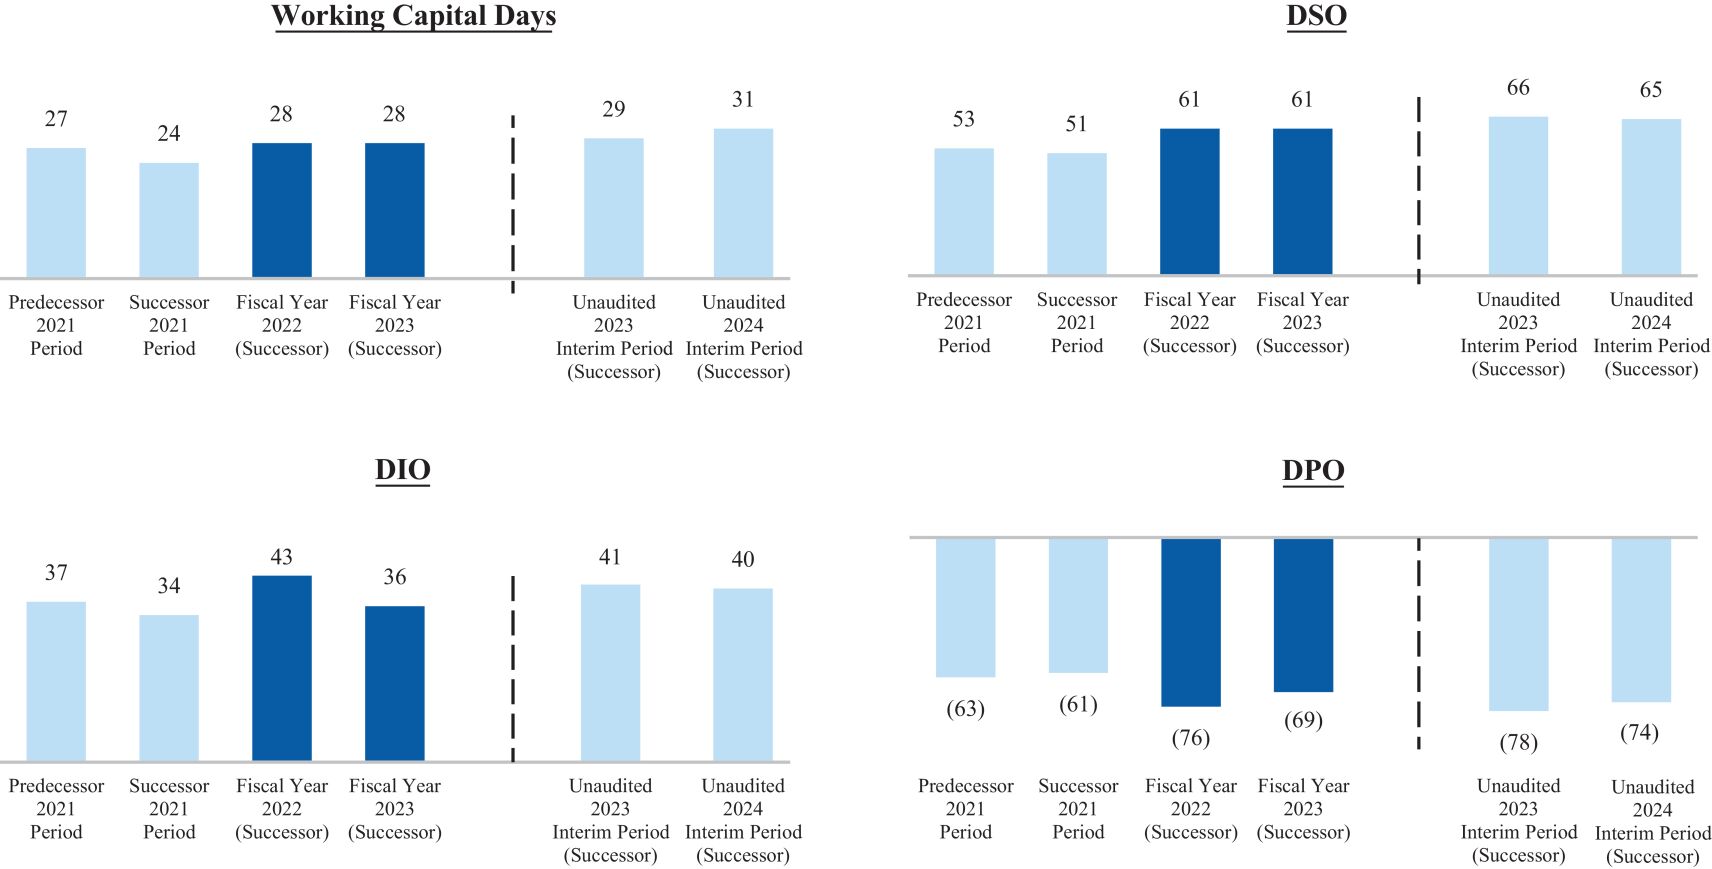
Capital Resources
We have a range of financing facilities which are diversified by type, maturity and geographic region with various financial institutions worldwide with a total capacity of approximately $8,044,921, of which $3,602,745 was outstanding at June 29, 2024. These facilities have staggered maturities through 2029. Our cash and cash equivalents totaled $1,227,879, $1,320,137, $948,490 and $928,762 at January 1, 2022, December 31, 2022, December 30, 2023 and June 29, 2024, respectively, of which $668,456, $795,198, $874,890 and $615,241, respectively, resided in operations outside of the United States. Cash and cash equivalents located in China were approximately 20% and 10% of our total cash and cash equivalents at December 30, 2023 and June 29, 2024, respectively, along with lesser amounts in Luxembourg, India, Mexico, Brazil, Australia, United Arab Emirates and Malaysia. Cash held by foreign subsidiaries, including China, can generally be used to finance local operations and cannot, under the current legal and regulatory environment, be transferred to finance other foreign subsidiaries operations. Additionally, our ability to repatriate these funds to the United States in an economical manner may be limited. Our cash balances are deposited and/or invested with various financial institutions globally that we endeavor to monitor regularly for credit quality. However, we are exposed to risk of loss on funds deposited with the various financial institutions and money market mutual funds and we may experience significant disruptions in our liquidity needs if one or more of these financial institutions were to suffer bankruptcy or similar restructuring. As of January 1, 2022, December 31, 2022, December 30, 2023 and June 29, 2024, we had book overdrafts of $435,451, $443,687, $409,420 and $501,574, respectively, representing checks issued on disbursement bank accounts but not yet paid by such banks. These amounts are classified as accounts payable in our consolidated balance sheets and are typically paid by the banks in a relatively short period of time.
We believe that our existing sources of liquidity provide sufficient resources to meet our capital requirements, including the potential need to post cash collateral for identified contingencies (see Note 10, Commitments and Contingencies, to our audited consolidated financial statements and Note 10, Commitments and Contingencies, to our unaudited condensed consolidated financial statements for further discussion of identified contingencies), for at least the next twelve months. We currently anticipate that the cash used for debt repayments will primarily come
142
Table of Contents
from our domestic cash, cash generated from on-going U.S. operating activities and from borrowings. Nevertheless, depending on capital and credit market conditions, we may from time to time seek to increase or decrease our available capital resources through changes in our debt or other financing facilities. Finally, since the capital and credit markets can be volatile, we may be limited in our ability to replace maturing credit facilities and other indebtedness in a timely manner on terms acceptable to us, or at all, or to access committed capacities due to the inability of our finance partners to meet their commitments to us.
Our current portfolio of utilized committed debt is almost evenly distributed between fixed and floating interest rate facilities. Our ABL Revolving Credit Facility, Term Loan Credit Facility and a revolving trade accounts receivable-backed financing program in Europe reprice periodically, and we plan to service any increase in interest expense with cash provided by operations. The Term Loan Credit Facility and the financing program in Europe are the only committed variable rate facilities with outstanding borrowings at June 29, 2024. We do not have any expectation at this time to draw down on any of our other sources of liquidity, outside of normal operations. We continue to monitor our cash flows and manage our operations with the purpose of optimizing our leverage and value. To mitigate our exposure to interest rate risk, during the first quarter of 2023, we entered into certain agreements to establish a 5.5% upper limit on the LIBOR interest rate applicable to a substantial portion of our borrowings under the Term Loan Credit Facility further discussed below. Due to the cessation of the LIBOR interest rate on June 30, 2023, we amended the interest rate cap agreements during the second quarter of 2023 to establish a 5.317% upper limit on the SOFR interest rate in order to align with the conversion to a SOFR-based rate for the underlying Term Loan Credit Facility as further discussed herein. During the second quarter of 2023, the Term Loan Credit Facility and the ABL Revolving Credit Facility were amended pursuant to their transition provisions to replace LIBOR-based benchmark rates with SOFR-based benchmark rates. During the third quarter of 2023, the interest rate cap agreements transitioned from LIBOR to SOFR as the interest reference rate. For additional information on our financing program in Europe, please see Managements Discussion and Analysis of Financial Condition and Results of OperationsLiquidity and Capital ResourcesPredecessor Debt below.
The following is a detailed discussion of our various financing facilities. For additional information, see also, Description of Material Indebtedness.
Predecessor Debt
In December 2014, we issued through a public offering $500,000 of 4.95% senior unsecured notes due 2024 (2024 Notes), resulting in cash proceeds of $494,995, net of discount and issuance costs of $1,755 and $3,250, respectively. Interest on the notes was payable semiannually on June 15 and December 15. In December 2016, pursuant to the coupon step-up provisions, the interest rate increased 0.50% to 5.45%.
In August 2012, we issued through a public offering $300,000 of 5.00% senior unsecured notes due 2022 (2022 Notes), resulting in cash proceeds of approximately $296,256, net of discount and issuance costs of $1,794 and $1,950, respectively. Interest on the notes was payable semiannually in arrears on February 10 and August 10.
In connection with the Imola Mergers, on July 2, 2021, we provided irrevocable notice to early redeem our 2024 Notes and our 2022 Notes. As the notes were deemed to be legally extinguished, we were required to pay a breakage fee of $94,851 which was included as part of the purchase price consideration, and wrote off deferred financing costs and unamortized discount of $2,641 to interest expense for the Predecessor 2021 Period.
On July 2, 2021, also in connection with the Imola Mergers, we terminated the following revolving trade accounts receivable-backed financing program in North America and Asia-Pacific:
i) A North-America program which provided for up to $1,100,000 in borrowing capacity, originally maturing in September 2022. The interest rate of this program was dependent on designated commercial paper rates (or, in certain circumstances, an alternate rate) plus a predetermined margin.
ii) An Asia-Pacific program which provided for a maximum borrowing capacity of up to 225,000 Australian dollars, originally maturing in June 2022.
143
Table of Contents
We have a revolving trade accounts receivable-backed financing program in Europe which provided for a borrowing capacity of up to 300,000, or approximately $321,480 at June 29, 2024 exchange rates, originally maturing in September 2023. In the fourth quarter of 2022, the financing program in Europe was further modified providing for a borrowing capacity of up to 375,000, or approximately $401,850 at June 29, 2024 exchange rates. This program, which matures in October 2026, requires certain commitment fees, and borrowings under this program incur financing costs based on the local short-term bank indicator rate for the currency in which the drawing is made plus a predetermined margin. At December 30, 2023 and June 29, 2024, we had borrowings of $331,920 and $240,329, respectively, under the financing program in Europe. The weighted average interest rate on the outstanding borrowings under this facility, as amended, was 4.4% and 5.1% per annum at December 30, 2023 and June 29, 2024, respectively.
We had a $1,350,000 revolving unsecured credit facility from a syndicate of multinational banks, originally maturing in October 2023, that was terminated as part of the Imola Mergers. The interest rate on this facility was based on LIBOR, plus a predetermined margin that was based on our debt ratings and leverage ratio.
As a result of terminating our revolving trade accounts receivable-based financing programs in North America and Asia-Pacific, and our $1,350,000 revolving unsecured credit facility, we wrote off, in total, $3,122 of unamortized deferred financing costs in the Predecessor 2021 Period.
On October 13, 2020, we secured a $200,000 uncommitted line of credit with a term of five years. Applicable interest rates are determined at the time of borrowing using the banks money market rate. In the second quarter of 2022, we expanded the capacity of this facility to $300,000. As of December 30, 2023 and June 29, 2024, there were no borrowings outstanding.
Successor Debt
As a result of the Imola Mergers, we entered into the following financing transactions.
On April 22, 2021, in anticipation of the acquisition of Ingram Micro by Platinum, Escrow Issuer, offered $2,000,000 Senior Secured Notes due May 2029. Prior to the acquisition, the 2029 Notes were the sole obligation of the Escrow Issuer. Upon consummation of the acquisition on July 2, 2021, the proceeds from the notes were used, in part, to finance the acquisition and repay existing indebtedness. The notes bear interest at a rate of 4.75% per annum, which is payable semi-annually on May 15 and November 15 of each year, beginning on November 15, 2021. On July 2, 2021, we recognized $1,945,205, net of debt issuance costs of $54,795 associated with the 2029 Notes.
On July 2, 2021, we entered into the Term Loan Credit Facility for $2,000,000, the proceeds of which were also used to, among other things, finance a portion of the Imola Mergers and repay certain of our existing indebtedness. We recognized $1,920,761 net of debt issuance costs and discount of $59,239 and $20,000, respectively, related to this facility. The Term Loan Credit Facility will mature on September 19, 2031 and amortizes in equal quarterly installments aggregating to 1.00% per annum. In June 2023, we voluntarily repaid $500,000 on our Term Loan Credit Facility over and above the normal quarterly installments. On September 27, 2023, we refinanced our Term Loan Credit Facility, reducing the interest rate spread over SOFR by 50 basis points. As a result, borrowings under the Term Loan Credit Facility were subject to interest at a rate per annum equal to, at our option, either (1) the base rate (which is the highest of (a) the then-current federal funds rate set by the Federal Reserve Bank of New York, plus 0.50%, (b) the prime rate on such day and (c) the one-month SOFR rate published on such date plus 1.11%) plus a margin of 2.0% or (2) SOFR (subject to a 0.50% floor) plus the applicable margin, which may range from 3.11% to 3.43%, based on interest period. We also amended the aforementioned interest rate cap agreements to reflect the updated notional amount of the Term Loan Credit Facility, with the 5.317% upper limit on the SOFR interest rate remaining unchanged under the amended interest rate cap agreements. In connection with the refinancing, we repaid an incremental $50,000 on our Term Loan Credit Facility and in June 2024, we voluntarily repaid an incremental $150,000 of the principal balance of our Term Loan Credit Facility. As of
144
Table of Contents
December 30, 2023 and June 29, 2024, $1,362,487 and $1,216,789, respectively, remained outstanding under the Term Loan Credit Facility. In connection with the 2024 Refinancing, on September 20, 2024, we repaid an incremental $100 million of the principal balance of our Term Loan Credit Facility. Following such repayment, as of September 20, 2024, $1,160 million was outstanding under the Term Loan Credit Facility. Concurrently with such repayment, on September 20, 2024, we refinanced our Term Loan Credit Facility, reducing the interest rate spread over SOFR by 25 basis points and eliminating the credit-spread adjustment. Borrowings under the Term Loan Credit Facility bear interest at a rate per annum equal to, at our option, either (1) the base rate (which is the highest of (a) the then-current federal funds rate set by the Federal Reserve Bank of New York, plus 0.50%, (b) the prime rate on such day and (c) the one-month SOFR rate published on such date plus 1.00%) plus a margin of 1.75% or (2) SOFR (subject to a 0.50% floor) plus a margin of 2.75%. Additionally, in connection with such refinancing, we extended the maturity date of the Term Loan (as defined in the Term Loan Credit Agreement) to September 19, 2031.
On July 2, 2021, we entered into new ABL Credit Facilities providing for senior secured asset-based, multi-currency revolving loans and letter of credit availability in an aggregate amount of up to $3,500,000 (the ABL Revolving Credit Facility), which is subject to borrowing base capacity and a senior secured asset-based term loan facility of $500,000 (the ABL Term Loan Facility and, together with the ABL Revolving Credit Facility, the ABL Credit Facilities). Prior to the voluntary prepayment in full discussed below, the ABL Term Loan Facility would have matured in July 2026. The ABL Revolving Credit Facility matures on September 20, 2029. The ABL Term Loan Facility amortizes in equal quarterly installments aggregating to 1.00% per annum. We may borrow under the ABL Revolving Credit Facility only up to our available borrowing base capacity. Borrowings under the ABL Revolving Credit Facility bear interest at a rate per annum equal to, at our option, either (1) the base rate plus a margin ranging (based on the availability under the ABL Revolving Credit Facility) from 0.25% to 0.75% or (2) SOFR (subject to a 0% floor) plus a margin ranging (based on the availability under the ABL Revolving Credit Facility) from 1.25% to 1.75%. Borrowings under the ABL Term Loan Facility bear interest at a rate per annum equal to, at our option, either (1) the base rate plus a margin of 2.50% or (2) SOFR (subject to a 0% floor) plus a margin of 3.50%. We capitalized $84,350 of debt issuance costs on July 2, 2021. As of December 30, 2023 and June 29, 2024, we had borrowings of $30,000 and $0, respectively, under our ABL Revolving Credit Facility and as of January 1, 2022 there were $486,146 of borrowings outstanding under our ABL Term Loan Facility. On April 4, 2022, we repaid in full the outstanding borrowings on our ABL Term Loan Facility of $496,250, including $10,724 of unamortized debt issuance costs which was recognized to interest expense in Fiscal Year 2022 (Successor), and following such prepayment, there were no borrowings outstanding under our ABL Term Loan Facility.
At December 30, 2023 and June 29, 2024, our actual aggregate capacity under our ABL Revolving Credit Facility and other receivable-backed programs was approximately $3,914,900 and $3,901,850, respectively, of which $361,920 was used as of December 30, 2023 and $240,329 was used as of June 29, 2024. On September 20, 2024, we borrowed $100 million under our ABL Revolving Credit Facility to repay outstanding term loans as part of the 2024 Refinancing. Even if we do not borrow or choose not to borrow to the full available capacity of certain programs, most of our trade accounts receivable-backed financing programs are subject to certain restrictions outlined in our ABL Credit Facilities. These restrictions generally prohibit us from assigning or transferring the underlying eligible receivables as collateral for other financing programs, unless the underlying eligible receivables are sold in conjunction with a dedicated, non-recourse facility.
We also have additional lines of credit, short-term overdraft facilities and other credit facilities with various financial institutions worldwide, which provide for borrowing capacity aggregating to $1,331,813 at December 30, 2023 and $960,023 at June 29, 2024. Most of these arrangements are on an uncommitted basis and are reviewed periodically for renewal. At January 1, 2022, December 31, 2022, December 30, 2023 and June 29, 2024, respectively, we had $114,021, $111,224, $217,463 and $179,368 outstanding under these facilities. The weighted average interest rate on the outstanding borrowings under these facilities, which may fluctuate depending on geographic mix, was 4.4%, 7.9%, 7.9% and 9.8% per annum at January 1, 2022, December 31, 2022, December 30, 2023 and June 29, 2024, respectively. At January 1, 2022, December 31, 2022,
145
Table of Contents
December 30, 2023 and June 29, 2024, letters of credit totaling $171,335, $165,735, $108,690 and $155,072, respectively, were issued to various customs agencies and landlords to support our subsidiaries. The issuance of these letters of credit reduces our available capacity under the corresponding agreements by the same amount.
Covenant Compliance
We are subject to certain customary affirmative covenants, including reporting and cash management requirements, and certain customary negative covenants that limit our and our subsidiaries ability to incur additional indebtedness or liens, to dispose of assets, to make certain fundamental changes, to enter into restrictive agreements, to make certain investments, loans, advances, guarantees and acquisitions, to prepay certain indebtedness, to pay dividends or other distributions in respect of our and our subsidiaries equity interests and to engage in transactions with affiliates. At December 30, 2023 and June 29, 2024, we were in compliance with all covenants or other requirements in all of our Credit Facilities and under the 2029 Notes Indenture. See Description of Material Indebtedness.
Trade Accounts Receivable Factoring Programs
We have several uncommitted factoring programs under which trade accounts receivable of several customers may be sold, without recourse, to financial institutions. Available capacity under these programs is dependent on the level of our trade accounts receivable eligible to be sold into these programs and the financial institutions willingness to purchase such receivables. At January 1, 2022, December 31, 2022, December 30, 2023 and June 29, 2024, we had a total of $527,936, $698,903, $738,714 and $741,244, respectively, of trade accounts receivable sold to and held by the financial institutions under these programs.
Contractual Obligations and Off-Balance Sheet Arrangements
We have guarantees to third parties that provide financing to a limited number of our customers. Net sales under these arrangements accounted for less than one percent of our consolidated net sales for each of the periods presented. The guarantees require us to reimburse the third party for defaults by these customers up to an aggregate of $5,256. The fair value of these guarantees has been recognized as cost of sales on the consolidated statements of income to these customers and is included in accrued expenses and other on the consolidated balance sheets.
In connection with the acquisition of businesses in recent years, we entered into acquisition agreements which include provisions to make additional contingent consideration payments. As of December 30, 2023 and June 29, 2024, the accrual for potential contingent consideration payments under these agreements is $4,391 and $3,132, respectively.
For a further discussion on our debt and operating lease commitments as of December 30, 2023 and as of June 29, 2024, see Note 7, Debt, and Note 6, Leases, respectively, to our audited consolidated financial statements and Note 7, Debt, to our unaudited condensed consolidated financial statements.
New Accounting Standards
See Note 2, Significant Accounting Policies, to our audited consolidated financial statements for the discussion of new accounting standards.
Critical Accounting Estimates
Our audited consolidated financial statements are prepared in accordance with accounting principles generally accepted in the United States. The preparation of financial statements in conformity with U.S. GAAP requires us to make estimates and assumptions that affect the reported amounts of assets and liabilities,
146
Table of Contents
disclosure of contingent assets and liabilities at the financial statement date and reported amounts of revenue and expenses during the reporting period. We review our estimates and assumptions on an on-going basis. Significant estimates primarily relate to the realizable value of accounts receivable, vendor programs, inventory, goodwill, intangible and other long-lived assets, income taxes and contingencies and litigation. Actual results could differ from these estimates.
We believe the following critical accounting policies involve the more significant judgments and estimates used in the preparation of our audited consolidated financial statements:
Revenue Recognition
Revenue Streams
In our distribution services model, we buy, hold title to and sell technology products and provide services to resellers, referred to subsequently as our customer, while also providing resellers with multi-vendor solutions, integration services, electronic commerce tools, marketing, financing, training and enablement, technical support and inventory management. In both Technology Solutions, which consists of Client and Endpoint Solutions and Advanced Solutions, and Cloud, we generally sell products and services to our customers (resellers) based on purchase orders instead of long-term contracts. Our agreements are generally not subject to minimum purchase requirements. Our customers place purchase orders with us for each transaction. Generally, our customers may cancel, delay or modify their purchase orders. In order to set up an account to trade with us, our customers generally have to accept our standard terms and conditions of sale which, together with the purchase order, form a binding contract on each individual order to which the purchase order applies. Our pricing varies greatly and depends on many factors including costs, competitive pressure, availability of inventory, seasonality and vendor promotional programs, among others. We may offer early payment discounts or volume incentive rebates to our customers. The customer contracts relating to our Other services generally provide for an initial term of three to five years, subject to extension by the mutual agreement of the parties, allow for termination for convenience by either party generally after the second year and the pricing is fixed by discrete type of service and typically varies depending on the volume of the relevant services. We do not believe any contract related to our Other services has a material impact on our business or financial condition. Products are delivered via shipment from our facilities, drop-shipment directly from the vendor or by electronic delivery of keys for software products.
We recognize revenue when the control of products is transferred to our customers, which generally happens at the point of shipment or point of delivery. We account for shipping and handling activities that occur after the customer has obtained control of a good as fulfillment activities rather than a promised service. Accordingly, we accrue all fulfillment costs related to the shipping and handling of goods at the time of shipment. Additionally, we exclude the amount of certain taxes collected concurrent with revenue-producing activities from revenue.
Any supplemental distribution services we provide are typically recognized over time as the services are performed. Service contracts may be based on a fixed price or on a fixed unit-price per transaction or other objective measure of output. Additionally, we offer services related to our supply chain management and CloudBlue platform. Our fee-based commerce and supply chain services are billed and recognized on a per-item service fee arrangement at the point when the service is provided. Our CloudBlue platform generates revenue through licensing the right to use the intellectual property (on-premise license), which is recognized at a point in time, providing the right to access (platform as a service), which is recognized over time across the term of the contract, or through our cloud marketplace, which is recognized in the amount of the net fee associated with serving as an agent when the services are provided. Service revenues represented less than 10% of total net sales for the Unaudited 2024 Interim Period (Successor), Fiscal Year 2023 (Successor), Fiscal Year 2022 (Successor), the Successor 2021 Period and the Predecessor 2021 Period. Related contract liabilities were not material for the periods presented. In our distribution services model, we buy, hold title to and sell technology products and provide services to resellers, referred to subsequently as our customer, while also providing resellers with multi-vendor solutions, integration services, electronic commerce tools, marketing, financing, training and enablement,
147
Table of Contents
technical support and inventory management. Products are delivered via shipment from our facilities, drop-shipment directly from the vendor or by electronic delivery of keys for software products. We recognize revenue when the control of products is transferred to our customers, which generally happens at the point of shipment or point of delivery.
Agency Services
We have contracts with certain customers where our performance obligation is to arrange for the products or services to be provided by another party. In these arrangements, as we assume an agency relationship in the transaction, revenue is recognized in the amount of the net fee associated with serving as an agent when the services are completed. These arrangements primarily relate to certain fulfillment contracts, as well as sales of certain software products, and extended vendor services, such as vendor warranties.
Variable Consideration
We, under specific conditions, permit our customers to return or exchange products. The provision for estimated sales returns is recorded concurrently with the recognition of revenue. A liability is recorded within accrued expenses and other on the consolidated balance sheets for estimated product returns based upon historical experience and an asset is recorded within Inventory on the consolidated balance sheets for the amount expected to be recorded for inventory upon product return.
We also provide volume discounts, early payment discounts and other discounts to certain customers which are considered variable consideration. A provision for such discounts is recorded as a reduction of revenue at the time of sale based on an evaluation of the contract terms and historical experience.
Inventory
Our inventory consists of finished goods purchased from various vendors for resale. We value our inventory at the lower of its cost or net realizable value, cost being determined on a moving average cost basis, which approximates the first-in, first out method. We write down our inventory for estimated excess or obsolescence equal to the difference between the cost of inventory and the net realizable value based upon an aging analysis of the inventory on hand, specifically known inventory-related risks (such as technological obsolescence and the nature of vendor terms surrounding price protection and product returns), foreign currency fluctuations for foreign-sourced products and assumptions about future demand. Market conditions or changes in terms and conditions by our vendors that are less favorable than those projected by management may require additional inventory write-downs, which could have an adverse effect on our consolidated financial results. Inventory is determined from the price we pay vendors, including freight and duties; we do not include labor, overhead or other general or administrative costs in our inventory.
Business Combinations
We allocate the fair value of purchase consideration to the assets acquired and liabilities assumed in the acquiree based on their fair values on the acquisition date. Any excess consideration over the fair value of assets acquired and liabilities assumed is recognized as goodwill. We engage the assistance of valuation specialists in concluding on fair value measurements in connection with determining fair values of assets acquired and liabilities assumed in a business combination. When determining the fair values of assets acquired and liabilities assumed we are required to make significant estimates and assumptions, especially with respect to intangible assets. Critical estimates in valuing intangible assets include, but are not limited to, expected future cash flows, which includes consideration of future revenue growth rates and margins, attrition rates, royalty rates and discount rates. Fair value estimates are based on the assumptions we believe a market participant would use in pricing the asset or liability. Amounts recorded in a business combination may change during the measurement period, which is a period not to exceed one year from the date of acquisition, as additional information about conditions existing at the acquisition date becomes available.
148
Table of Contents
Long-Lived and Intangible Assets
We assess potential impairments to our long-lived and intangible assets when events or changes in circumstances indicate that the carrying amount may not be fully recoverable. If required, an impairment loss is recognized as the difference between the carrying value and the fair value of the assets.
Goodwill
Goodwill represents the excess of the purchase price over the fair value of the identifiable net assets acquired in an acquisition and is reviewed annually for potential impairment, or when circumstances warrant. Goodwill is required to be tested for impairment at least annually or sooner whenever events or changes in circumstances indicate that goodwill may be impaired. Goodwill impairment tests require judgment, including the identification of reporting units, assignment of assets and liabilities to reporting units, assignment of goodwill to reporting units and determination of the fair value of each reporting unit. We perform our annual goodwill impairment assessment during our fiscal fourth quarter. We have the option of first assessing qualitative factors to determine whether it is more likely than not that the fair value of a reporting unit is less than its carrying value. Such review includes an evaluation of whether events and circumstances have occurred that may indicate a potential change in recoverability of goodwill, including the impacts of a deterioration in general economic conditions, an increased competitive environment, a change in management, key personnel, strategy, vendors or customers, negative or declining cash flows, or a decline in actual or planned revenue or earnings compared with actual and projected results of relevant prior periods.
If, based on a review of qualitative factors, it is more likely than not that the fair value of a reporting unit is less than its carrying value, we perform a quantitative analysis by comparing the fair value of a reporting unit with its carrying amount. If the carrying value exceeds the fair value, we measure the amount of impairment loss, if any, by comparing the fair value of the reporting unit goodwill to its carrying amount.
We performed a qualitative analysis in the Predecessor 2021 Period and the Successor 2021 Period utilizing several qualitative factors to assess for any potential impairment indicators. Such review indicated that we had no impairment indicators present as it was more likely than not that the fair value of the reporting units was greater than their carrying value. In Fiscal Year 2022 (Successor), and in Fiscal Year 2023 (Successor) for our North America and EMEA regions, we performed a quantitative analysis of goodwill. In determining the fair value of our reporting units, we assessed general economic conditions, industry and market considerations, the impact of recent events to financial performance and other relevant events. Based on the valuations prepared, it was determined that the estimated fair values of our reporting units were greater than their carrying values and no impairment of goodwill was identified in either period. In Fiscal Year 2023 (Successor) we performed a qualitative analysis of goodwill for our Asia-Pacific and Latin America regions. No goodwill impairment was recorded during the Predecessor 2021 Period, the Successor 2021 Period, Fiscal Year 2022 (Successor) and Fiscal Year 2023 (Successor) based on the result of the procedures performed.
Income Taxes
We estimate income taxes in each of the taxing jurisdictions in which we operate. This process involves estimating our actual current tax expense together with assessing the future tax impact of any differences resulting from the different treatment of certain items, such as the timing for recognizing revenues and expenses for tax versus financial reporting purposes. These differences may result in deferred tax assets and liabilities, which are included in our consolidated balance sheets. We are required to assess the likelihood that our deferred tax assets, which include net operating loss carryforwards, tax credits and temporary differences that are expected to be deductible in future years, will be recoverable from future taxable income. In making that assessment, we consider the nature of the deferred tax assets and related statutory limits on utilization, recent operating results, future market growth, forecasted earnings, future taxable income, the mix of earnings in the jurisdictions in which we operate and prudent and feasible tax planning strategies. If, based upon available evidence, recovery of the full amount of the deferred tax assets is not likely, we provide a valuation allowance on any amount not likely to be realized.
149
Table of Contents
Our effective tax rate includes the impact of not providing taxes on undistributed foreign earnings considered indefinitely reinvested. Material changes in our estimates of cash, working capital and long-term investment requirements in the various jurisdictions in which we do business could impact our effective tax rate if we no longer consider our foreign earnings to be indefinitely reinvested.
The provision for tax liabilities and recognition of tax benefits involves evaluations and judgments of uncertainties in the interpretation of complex tax regulations by various taxing authorities. In situations involving uncertain tax positions related to income tax matters, we do not recognize benefits unless their sustainability is deemed more likely than not. As additional information becomes available, or these uncertainties are resolved with the taxing authorities, revisions to these liabilities or benefits may be required, resulting in additional provision for or benefit from income taxes reflected in our consolidated statements of income.
The Organization for Economic Co-operation and Development (OECD) has a framework to implement a global minimum corporate tax of 15% for companies with global revenues and profits above certain thresholds (referred to as Pillar 2), with certain aspects of Pillar 2 effective January 1, 2024 and other aspects effective January 1, 2025. While it is uncertain whether the United States will enact legislation to adopt Pillar 2, certain countries in which we operate have adopted legislation, and other countries are in the process of introducing legislation, to implement Pillar 2. We do not expect Pillar 2 to have a material impact on our effective tax rate or our consolidated results of operations, financial position, or cash flows.
Contingencies
We accrue for contingent obligations, including estimated legal costs, when the obligation is probable and the amount is reasonably estimable. As facts concerning contingencies become known, we reassess our position and make appropriate adjustments to the financial statements. Estimates that are particularly sensitive to future changes include those related to tax, legal and other regulatory matters such as imports and exports, the imposition of international governmental controls, changes in the interpretation and enforcement of international laws (in particular related to items such as duty and taxation) and the impact of local economic conditions and practices, which are all subject to change as events evolve and as additional information becomes available during the administrative and litigation process.
Quantitative and Qualitative Disclosures About Market Risk
Foreign Currency Exchange Risk
We are exposed to the impact of foreign currency fluctuations and interest rate changes due to our international sales and global funding. In the normal course of business, we employ established policies and procedures to manage our exposure to fluctuations in the value of foreign currencies using a variety of financial instruments. It is our policy to utilize financial instruments to reduce risks where internal netting cannot be effectively employed and not to enter into foreign currency or interest rate transactions for speculative purposes.
Our foreign currency risk management objective is to protect our earnings and cash flows resulting from sales, purchases and other transactions from the adverse impact of exchange rate movements. Foreign exchange risk is managed by using forward contracts to offset exchange risk associated with receivables and payables. We generally maintain hedge coverage between minimum and maximum percentages. During 2023, hedged transactions were denominated in U.S. dollars, Canadian dollars, euros, British pounds, Danish krone, Hungarian forint, Israeli shekel, Norwegian kroner, Swedish krona, Swiss francs, Polish zloty, South African rand, Australian dollars, Japanese yen, New Zealand dollars, Singapore dollars, Bulgarian lev, Czech koruna, Hong Kong dollars, Romanian leu, Brazilian real, Colombian pesos, Chilean pesos, Indian rupee, Chinese yuan, Turkish lira, Moroccan dirham, Thai baht, Malaysian ringgit and Indonesian rupiah.
We monitor our foreign exchange risk using a Value-at-Risk, or VaR, model. The VaR model determines the maximum potential loss in the fair value of our forward contracts and those assets and liabilities denominated
150
Table of Contents
in foreign currencies that the forward contracts are intended to hedge assuming a one-day holding period. The VaR model estimates were made assuming normal market conditions and a 95% confidence level. The estimated maximum potential one-day loss in fair value, calculated using the VaR model would be $375, $1,275, $1,799 and $527 as of January 1, 2022, December 31, 2022, December 30, 2023 and June 29, 2024, respectively.
Interest Rate Risk
We are exposed to changes in interest rates on a portion of our long-term debt, which is subject to changes in major interest rate benchmarks, used to maintain liquidity and finance working capital, capital expenditures and business expansion. For additional information, see Managements Discussion and Analysis of Financial Condition and Results of OperationsLiquidity and Capital ResourcesCapital Resources. If interest rates, however, were to increase or decrease by 1%, and our borrowing amounts stayed constant on our Term Loan Credit Facility and our ABL Credit Facilities at the levels of such borrowing amounts as of June 29, 2024, our annual interest income would be $1,150 due to our interest rate cap more than offsetting the additional interest expense, and our interest expense would decrease by $12,600, respectively. Assuming that our ABL Revolving Credit Facility was fully drawn as of June 29, 2024, each one-eighth percentage point change in interest rates would result in a change of approximately $5,950 in annual interest expense on the indebtedness under our Term Loan Credit Facility and our ABL Credit Facilities. Rising interest rates do not materially impact the Companys balance sheet items relating to inventory, accounts payable or accrued expense balances.
Our management objective is to finance our business at interest rates that are competitive in the marketplace while moderating our exposure to volatility in interest costs. To achieve our objectives, we may utilize both variable- and fixed-rate debt with a portion of our variable interest rate exposure from time to time mitigated through interest rate swaps or other derivative instruments. To mitigate the Companys exposure to interest rate risk arising from the Companys long-term debt, the Company entered into certain agreements during the first quarter of 2023 to establish a 5.5% upper limit on the LIBOR interest rate applicable to a substantial portion of the borrowings under the Term Loan Credit Facility. Due to the cessation of the LIBOR interest rate on June 30, 2023, we amended the interest rate cap agreements to establish a 5.317% upper limit on the SOFR interest rate. These interest rate cap agreements transitioned from LIBOR to SOFR as the interest reference rate during the third quarter of 2023. The Company has funded, and to the extent applicable expects to continue to fund, increases in the Companys interest expense resulting from rising interest rates through cash flows from operations.
151
Table of Contents
Overview
Ingram Micro is a leading solutions provider by revenue for the global IT ecosystem helping power the worlds leading technology brands. With our vast infrastructure and focus on client and endpoint solutions, advanced solutions offerings and cloud-based solutions, we enable our business partners to scale and operate more efficiently in the markets they serve. We are at the center of the technology ecosystem and deliver customized solutions to our vendor, reseller and retailer partners, enabling them to provide excellent business outcomes to the companies and consumers they serve. Through our global reach and broad portfolio of products, professional services offerings and software, cloud and digital solutions, we remove complexity and maximize the value of the technology products our partners make, sell or use, providing the world more ways to realize the promise of technology. In the face of significant economic uncertainty and volatility in commercial markets globally, our business remains well-positioned to benefit from technology megatrends, including cloud migration, enhanced security, IoT, hybrid work and 5G.
As one of the worlds largest technology distributors by revenue and/or by global footprint, we have positioned Ingram Micro as an integral link in the global technology value chain, providing technology solutions and services from more than 1,500 vendor partners to a broad array of customers. With operations in 57 countries and 134 logistics and service centers worldwide, we serve as a solutions aggregator that we believe based on our experience in the industry enables us, together with our vendor partners, to reach nearly 90% of the global population with technology. We operate across four geographic segments: North America, EMEA, Asia-Pacific and Latin America. In all these geographic segments, we provide a full spectrum of hardware and software, cloud services and logistics expertise through three main lines of business: Technology Solutions, Cloud and Other. Technology Solutions includes distribution of a vast array of client and endpoint solutions and advanced solutions offerings and related services. Our cloud marketplace, which in certain jurisdictions has already been integrated into one unified Ingram Micro Xvantage, connects partners with what we believe to be the worlds largest cloud ecosystem, enabling them to generate demand more efficiently and providing third-party cloud-based services and subscription offerings through a digital platform for the consumption of cloud solutions in an ever-increasing cloud-centric world. We support more than 200 cloud solutions and manage over 36 million seats through our cloud marketplace. Our CloudBlue platform also provides services to many of the worlds telecommunications companies, as well as to managed service providers, technology distributors and value-added resellers, and manages over 52 million seats. Other provides environmentally focused IT asset disposition solutions, reverse logistics and repair offerings and, prior to the CLS Sale discussed herein, e-commerce and other forward and reverse logistics services.
OEMs and software providers rely on us to simplify global sales channels, gain operational efficiencies and address complex technology deployments, including through our Ingram Micro Xvantage digital platform. Our highly diversified base of more than 161,000 customers includes value-added resellers, system integrators, telecommunications companies and managed service providers. We provide our customers with broad product availability, technical expertise and a full suite of professional services to simplify their deployment and maximize their use of technology, including data-driven business and market insights, pre-sales engineering, post-sales integration, technical support and financing solutions. We manage more than 850 million units of technology products across more than 220,000 unique SKUs every year and handle, on average, in excess of 12,000 technical engineering calls monthly. Xvantage continues to develop with close to two dozen patents pending, 29 million new lines of code, over a hundred internally developed AI models and over 20 proprietary engines powering and supporting the platforms functionality, enabling Xvantage to offer its users instant pricing, billing automation, marketing capabilities, hardware and cloud subscriptions, the ability to configure, quote and track each order, and various other insights and recommendations personalized to the user.
More than a decade ago, we embarked on a journey from being a traditional IT products distributor to creating an integrated marketplace for customized solutions. Since then, even in the midst of the recent global softening in demand for certain of our traditional offerings, including our client and endpoint solutions, we have invested more
152
Table of Contents
than $2 billion in technical resources, intellectual property, digital processes and systems, advanced solutions, specialty markets and professional services. From its inception, this organic evolution, aided by a number of key acquisitions, has focused on creating a one-stop-shop experience for our thousands of customers to seamlessly procure and manage a comprehensive suite of technology solutions and services. The XaaS market has now been a rapidly expanding market and a key growth driver for several years, leading to our accelerated development of highly integrated solutions, services and marketplaces. First launched in 2010, our cloud marketplace has been a transformative part of our journey, enabling leading software vendors to connect with thousands of customers, who in turn support millions of end users, in what we believe to be the worlds largest cloud ecosystem. Today, our cloud marketplace hosts more than 200 cloud solutions, aggregates 29 marketplaces and manages over 36 million seats, for more than 33,000 customers. Building on our successful cloud marketplace, our proprietary CloudBlue digital commerce platform, and other acquired and organically developed intellectual property, in 2022 we launched Ingram Micro Xvantage, our fully automated, self-learning and innovative digital platform, which is now live in key countries around the globe. Built on the foundation of several patent-pending innovations, Xvantage uses AI and/or ML technologies for a wide variety of applications, including the following:
| | generating personalized recommendations and insights for customers and associates, based in part on such users roles, preferences, and historical activity; |
| | processing vendor catalogs, submitted in those vendors preferred formats, to extract the relevant data and data types to be incorporated into and displayed to customers and associates within our platform, with minimal human input required; |
| | converting customer orders submitted in non-standard formats, including unstructured emails, into machine-readable formats that substantially reduce the involvement of human sales associates; and |
| | managing cloud and XaaS monthly and annual recurring subscription services, including simplifying and personalizing users renewal and upgrade options. |
The engines that drive Xvantage use our proprietary data mesh, which incorporates years of actual transaction data combined with external market data licensed from certain third parties regarding market trends and expectations. Ingrams use of such data is consistent with the relevant licensing agreements with these third parties. We train the algorithms within our AI-powered engines using primarily our own internally developed logic, models and tools. While we use several third-party tools and capabilities to store data and train our models and algorithms, as part of our broader subscription with Google Cloud Platform, which hosts Xvantage, the AI tools and capabilities we leverage (including Gemini, Vertex AI, AlloyDB and BigQuery) are not critical to processing actual transactions and are instead focused on enhancing user experience. In general, our use of Google Cloud Platform and its associated tools is subject to a Google Cloud Master Agreement (together with all addendums and schedules thereto, the Google Cloud Terms). Under the Google Cloud Terms, Google LLC (Google) grants us the right to use and access the Google Cloud Platform services. The Google Cloud Terms also provide that both parties retain rights to their respective intellectual property. We retain all rights to the software and applications we develop and host on the Google Cloud Platform as well as to the data necessary for the purpose of training our AI tools. Google owns all rights, title and interest in its technology, which includes tools, code, algorithms, and other materials developed in connection with any implementation services provided by Google that have general application to Googles other customers. In connection with any implementation of the Google Cloud Platform, to the extent that Google creates any deliverables for us as part of the implementation and to the extent any Google pre-existing technology is incorporated into such deliverables, Google grants us a limited, worldwide, non-exclusive, perpetual, non-transferable license to use such deliverables (and the pre-existing technology therein) for our internal purposes.
153
Table of Contents
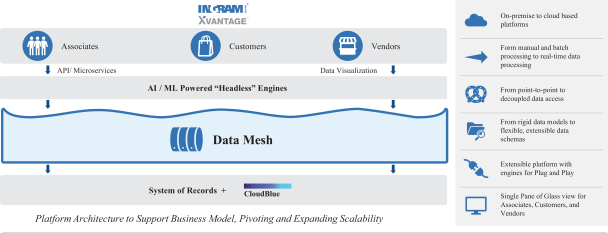
We believe that our customers will increasingly experience a single pane of glass through which we offer a full menu of IT devices, software solutions, cloud-based subscriptions, and technology services across hundreds of vendors and brands as we migrate our cloud marketplace and other marketplaces to Ingram Micro Xvantage and continuously integrate additional capabilities to the platform. Through Ingram Micro Xvantage, many tasks that previously took hours or even days, such as order status updates, price quotes and vendor catalog management activities, can now be accomplished by the platform in a few minutes, driving significant efficiency gains for our vendors, customers and associates. We believe that we offer our third-party partners the industrys first comprehensive and streamlined distribution experience in a single integrated digital platform. Using the insights gained from hundreds of millions of transactions over the past decade, Ingram Micro Xvantage is a significant milestone in our evolution benefiting from many years of investment and IT distribution experience. As our dynamic business model continues to evolve and we continue our transition to becoming more of a platform company, we will be better able to adapt to customer demands in the constantly shifting IT landscape.
Our focus on successful business outcomes for our partners and their clients, together with the investments described above, have enabled us to deliver solid financial results and expand our advanced solutions and cloud businesses even in the midst of the recent global softening in demand for certain of our traditional offerings, including our client and endpoint solutions.
Advanced Solutions generated net sales of $7,329 million for the Predecessor 2021 Period, $8,309 million for the Successor 2021 Period, $17,354 million for Fiscal Year 2022 (Successor), $17,883.3 million for Fiscal Year 2023 (Successor) and $8,164.9 million for the Unaudited 2024 Interim Period (Successor). Cloud generated net sales of $125.9 million for the Predecessor 2021 Period, $161.7 million for the Successor 2021 Period, $326.0 million for Fiscal Year 2022 (Successor), $383.3 million for Fiscal Year 2023 (Successor) and $226.1 million for the Unaudited 2024 Interim Period (Successor).
Additionally, we provide ITAD and Reverse Logistics and Repairs services to securely dispose of used IT assets. These services are used by large resellers, retailers and OEMs to advance environmental sustainability through responsibly collecting and beneficially repurposing e-waste through remanufacturing, recycling, refurbishing and reselling technology devices. These services also include secure data destruction, the extraction of valuable metals, asset recovery and management solutions for organizations, including the worlds largest telecommunications providers. We enable a circular economy by giving our customers options to achieve their sustainability goals and consumers more access to quality, affordable smartphones, computers and other technology devices.
Since 2012, we have invested more than $2 billion in technical resources, intellectual property, digital processes and systems, advanced solutions, specialty markets and professional services to further expand the solutions available for our partners. We have proven we can deliver value to our partners and successfully scale
154
Table of Contents
these investments. During this same time period, our notable acquisitions included Brightpoint, Inc., Aptec, Softcom, CloudBlue Technologies, Anovo, Odin, Grupo ACAO, NetxUSA, Ensim, The Phoenix Group, Cloud Harmonics, Abbakan and Ictivity. We have completed over 40 acquisitions. Over $600 million of our investments have been to acquire and develop the intellectual property to enhance our growing cloud businesses, our CloudBlue digital commerce platform and other digital capabilities.
For the Predecessor 2021 Period, the Successor 2021 Period, the Unaudited Pro Forma 2021 Combined Period, Fiscal Year 2022 (Successor), Fiscal Year 2023 (Successor) and the Unaudited 2024 Interim Period (Successor), we generated net sales of $26,406.9 million, $28,048.7 million, $54,455.6 million, $50,824.5 million, $48,040.4 million and $22,876.4 million, respectively, and net income of $378.5 million, $96.7 million, $366.1 million, $2,394.5 million, $352.7 million and $104.1 million, respectively. In addition, during such periods we generated Adjusted EBITDA of $647.8 million for the Predecessor 2021 Period, $746.3 million for the Successor 2021 Period, $1,384.2 million for the Unaudited Pro Forma 2021 Combined Period, $1,349.4 million for Fiscal Year 2022 (Successor), $1,353.1 million for Fiscal Year 2023 (Successor) and $569.0 million for the Unaudited 2024 Interim Period (Successor). See Managements Discussion and Analysis of Financial Condition and Results of OperationsNon-GAAP Financial Measures. As of June 29, 2024, we had approximately 24,150 full-time associates.
Industry Background
We believe that technological innovationas a primary catalyst of growth, differentiation and efficiency gains across industries and applicationswill continue to drive long-term expansion in the global IT market, even as certain technologies and sectors experience declines in demand from time to time. As the world becomes increasingly digital, connected and automated, companies and consumers will need to invest in the latest technology and security around these solutions to effectively interact with key stakeholders, grow their business and drive operational efficiencies.
We believe our industry will benefit from a number of key trends:
| | Continued cloud growth and shift to a subscription-and consumption-based economy. Enterprises and individuals continue to increase their adoption of XaaS solutions, and the shift to cloud alternatives is driving continued infrastructure buildout globally. Modern business models embrace dynamic relationships between suppliers and real-time customer demands. The technology implementations that have traditionally been the domain of IT departments and Chief Information Officers are now mission critical for all facets of business as they move toward business models driven by subscriptions. The ability to bill, provision, launch, price, recognize revenue and manage subscriptions is becoming increasingly essential to successful business outcomes and continued growth. |
| | Need for enhanced security. The information security market has been impacted by an increase in the number and the complexity of threats and targeted attacks over the past several years. These threats impact infrastructure, networks and end-point devices, and are exacerbated by increasing proliferation of more connected devices than ever before. Such attacks affect data spanning from enterprises to personal technology. Given the impact that attacks have had on organizations across the world, security will remain a top priority for senior management teams and boards of directors, driving continued spend on security in the future. According to IDC, global security spend is expected to grow to $329 billion in 2027, an 11.4% CAGR from 2023. |
| | Exponential increase in the number of connected devices and the complexity of technology solutions. According to IDC, there will be approximately 46 billion connected IoT devices by 2025, generating approximately 67 zettabytes of data. Every part of the enterprise, from manufacturing facilities, to warehouses, to headquarters and other office environments, has devices that are connected to the internet. The corporate perimeter has expanded further throughout the COVID-19 pandemic, as work-from-home and hybrid models have increased. In our personal lives, consumer devices are also increasingly connected. As the lines between devices, software, and services become increasingly blurred due to ubiquitous connectivity and the rise of sophisticated edge computing and distributed |
155
Table of Contents
| networks, among other drivers, the ability to deliver integrated solutions is critical to capture market opportunities. The number of worldwide NPU-equipped AI PC shipments is expected to grow to 167 million shipments by 2027, a 58.4% CAGR from 2023. We expect these market dynamics to increase demand for devices with faster processing, reduced latency, enhanced security and better overall performance, which are all factors that also speed refresh and upgrade cycles across multiple forms of technology. |
| | The rise of artificial intelligence. We believe AI will benefit our industry in two primary ways. First, for those distributors who are able to successfully execute the necessary shift to a digital platform, we expect AI to remove friction in the ordering process, improving and personalizing the customer experience by leveraging predictive models to generate insights and recommendations, and to power real-time dynamic pricing engines, accelerating the sales cycle and bolstering productivity. Second, AI will increasingly drive a shift in the design and application of all types of technology, which is expected to drive accelerated demand for PCs, datacenter equipment, AI-enabled software, and many other applications. |
| | Rollout of broadband and 5G networks will continue to drive technology growth. High-speed mobile networks are the backbone of the modern technology ecosystem and necessary to each of the aforementioned trends. We believe companies and consumers in both emerging and mature markets will need to continue investment in IT hardware, software, and services to capitalize on the expanding set of opportunities enabled by universal connectivity. |
Distributors provide technology vendors a highly attractive variable cost channel to customers, including consultative sales and engineering support, as well as trade credit, financing, marketing and logistics services. Vendors leverage distributors capabilities to aggregate demand and provide extensive market reach and coverage across different geographies, while simplifying supply chain and go-to-market complexity. Distributors provide customers, including resellers and end-users, with critical product information and availability, aggregate multi-vendor technical expertise and service offerings, train and enable new certified sellers and authorized partners, extend financial solutions and trade credit and provide efficient supply chain logistics and technical support globally. As a result of these strategic benefits, we believe the opportunity for growth in the technology distribution industry will continue to exceed that of the global technology market as both hardware and software OEMs increasingly rely on distributors to support their go-to-market strategies.
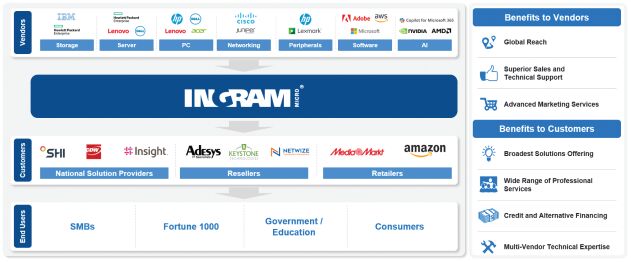
As technology solutions have become more complex, reliance on distributors to provide product, marketing, technical and financial support has increased. Increasingly, distributors play a central integrating role in the technology ecosystema distributor is no longer merely a link in the chain between vendors and resellers within
156
Table of Contents
the traditional two-tier distribution model, but today acts as the connective tissue among hardware and software vendors, service providers, resellers, integrators, marketplaces, and end customers. Companies are increasingly seeking perspectives on the most efficient ways to design, procure and optimize their technical infrastructures, and customers increasingly demand high-quality service and support including advanced technical, training, support and financing services. These strategic engagements are bringing the technology value chain closer to the end customer and will increasingly require a comprehensive platform to serve customer needs.
Additionally, environmental concerns and regulatory requirements for the disposal of IT products and data security regulations, such as GDPR, create challenges for companies in managing the safe disposal of IT products, limiting the risk of data loss and reducing or eliminating subsequent financial losses. In addition to the environmental considerations, improperly deleting data and disposing of hardware can result in costly management of data and potential exposures if data is not managed properly and securely.
Our Market Opportunity
Numerous trends continue to reshape the way organizations go to market, driving increasingly complex supply chains in industries ranging from enterprise hardware and software to mobility and retail. Despite recent fluctuations in businesses and consumers purchasing behaviors, particularly for discrete products, demand remains strong for end-to-end technology solutions, cloud-centric business applications and subscription management services. Additionally, there is an increasing need to simplify and automate the delivery of complicated virtual, physical and hybrid solutions and replace what currently are complex, fragmented, people-dependent processes and systems used to consume technology. As a key partner to OEMs, software providers and businesses, our objective is to:
| 1. | Provide the industrys most efficient and reliable route to market, with comprehensive capabilities to enhance the value of the solutions we deliver to drive successful business outcomes; |
| 2. | Enable and increase our partners success, breadth and reach as the market evolves to additional cloud-centric and digital solutions, driven by our proprietary digital platform, Ingram Micro Xvantage, and the marketplaces and engines that are increasingly being integrated into it; |
| 3. | Digitize the supply and value chains and influence the way technology is acquired and demand is generated for technology solutions and services to enable our partners to transact via a fully digital platform to make business decisions, build demand and develop new offerings based on intelligent data insights; and |
| 4. | Sustainably support the circular economy and lifecycle of technology by helping organizations quickly cycle through IT assets in a secure and environmentally friendly manner, providing IT asset disposition and reverse logistics and repair offerings to reduce e-waste. |
157
Table of Contents
Global Annual IT Spending in $Trillion (2007 2023)
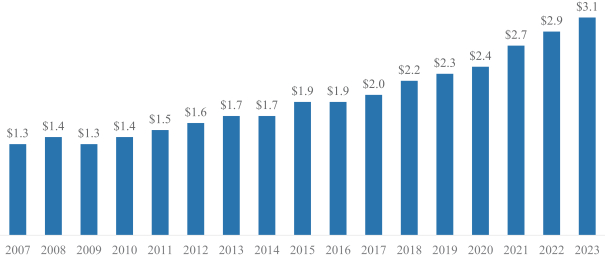
Source: IDC Black Book Live Edition, January 2024
The global IT industry has grown consistently through macroeconomic cycles. Historically, market growth has been predominantly driven by increased enterprise spending on datacenter products, software solutions and public infrastructure investment. Additionally, enterprise digital transformation initiatives and the increasing adoption of automation technologies have supported increased demand for software and server capacity. According to IDC, global IT spending has increased in 15 of the last 16 years on a constant annual dollar basis, illustrating the resilience of the IT industry through market cycles. We believe the proportion of the IT market sold through distribution has increased significantly over the last decade.
158
Table of Contents
Global Annual IT Spending in $Trillion
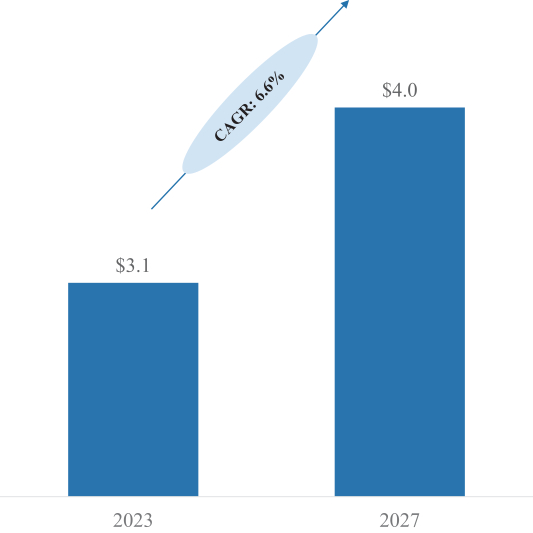
Source: IDCs Worldwide ICT Spending Guide: Enterprise and SMB by Industry (2024 V1), February 2024
According to IDC, global IT spend across hardware, software and IT services was $3.1 trillion (excluding infrastructure-as-a-service) in 2023 and is expected to grow to $4.0 trillion in 2027, a 6.6% CAGR. We expect distribution to remain the principal route to market for most technology OEMs. As technology becomes more complex, drawing off of multiple vendors and providers, and continues to be consumed on premises, virtually and in hybrid manners, we believe the importance of distribution will continue even as more technology becomes cloud-based. We continue to offer a significant value proposition for both vendors and customers by bringing these diverse and numerous technologies together in one source.
Today, a number of key technology categories such as cybersecurity, data center, sustainability and cloud are driving strong growth in technology spend. According to IDC, global security spend is expected to grow to $329 billion in 2027, an 11.4% CAGR from 2023. As IT spend continues to increase, we expect demand for IT asset disposition and reverse logistics and repair services to also increase. According to Technavio, the total addressable market for IT asset disposition is expected to reach $31.6 billion in 2027, up from $20.6 billion in 2023, a 11.3% CAGR. According to Statista, the total addressable market for reverse logistics and repair services
159
Table of Contents
in 2027 is expected to reach $861 billion, up from $700 billion in 2023, a 5.3% CAGR. We believe our differentiated capabilities enable us to continue to develop a leadership position in this large and growing market.
Cloud adoption is accelerating, with public/dedicated cloud as a service spend expected to reach $1.4 trillion by 2027, up from $693 billion in 2023, a 19.6% CAGR, according to IDC. Cloud marketplaces have become increasingly important to software, hardware and infrastructure vendors go-to-market strategy, providing a unique value proposition to vendors including market reach, reduced complexity for customers and the ability to bundle services and broader solutions from multiple sources. According to IDC, the global digital transformation market, including hardware, software and IT and business services, is estimated to grow from $2.2 trillion in 2023 to $3.9 trillion in 2027, a 15.9% four-year CAGR. We believe our broad product offering, extensive vendor ecosystem and diversified customer base, combined with our highly scalable automated platform, position us to capture a greater share in a rapidly growing market. As more software licenses currently sold directly to end users move to a cloud as a service model, we expect our Serviceable Addressable Market in cloud offerings to grow. Based on our experience in the industry, we believe the strength of our Ingram Micro Cloud Marketplace and CloudBlue platform allows us to capture cloud opportunities that may not be available to our competitors.
Key Benefits of Our Business Model
Our technology and cloud solutions business model is purpose-built for todays technology landscape and the technology ecosystem of the future. We serve as an integral link in the global technology value chain, driving sales, reach and profitability for technology vendors, value-added resellers, mobile network operators, service and solution providers and other customers. We have a strong presence in each of the four regions in which we operate: North America, EMEA, Asia-Pacific and Latin America. Across each of these markets, our partners trust us to deliver a full spectrum of hardware, software, cloud, managed and professional and other services.
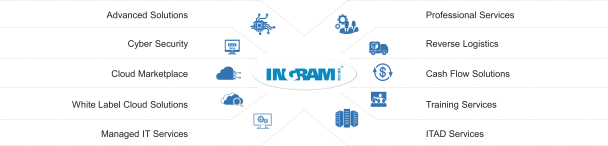
Our business model provides the following key benefits:
| | Strong Market Access through Global Network of Partners and Customers. We are one of the global leaders in technology and cloud distribution with leading market share around the globe. We have more than 1,500 vendor partners. Furthermore, we have a highly diversified base of more than 161,000 customers serving the SMB market, which consists of millions of businesses, and more than 33,000 cloud marketplace customers, covering millions of end users and over 36 million seats. With operations on six continents, we enable technology vendors to reach diverse markets, end-users and geographic reliably and efficiently, while providing customers with access to the highest quality technology vendors worldwide. We believe based on our experience in the industry that our geographic reach and presence are superior to that of our competitors. |
| | Ingram Micro Xvantage Designed for the Evolution of XaaS. Initially introduced to the market in late 2022, our Ingram Micro Xvantage digital platform, including the AI and ML capabilities that are foundational to the platforms functionality, has already been launched in the United States, Germany, Canada, the United Kingdom, Mexico, Colombia, Austria, France, Italy, Belgium, the Netherlands, Spain, India and Australia. We expect to continue launching in additional geographies, providing a singular experience for our customers and partners to procure and consume technology. As we migrate our cloud marketplace into Ingram Micro Xvantage in more and more geographies, and as we integrate |
160
Table of Contents
| additional engines into the digital platform, we believe that our interactions and transactions will become increasingly seamless for customers and vendors, and will enable them to drive further growth with significant efficiencies. We expect the investment and commitment we continue to make in Ingram Micro Xvantage will further strengthen our existing relationships, attract new partners and customers and influence end user technology preferences. Over the years, we have assembled a business intelligence team of data scientists who today use a unique data mesh infrastructure with AI and ML through our Ingram Micro Xvantage platform to build predictive digital insights and product recommendations to support our go-to-market and technical support teams in better serving our customers. |
| | Efficient Go-To-Market Channel through Demand Aggregation. We serve as a central, unified platform for our vendors to aggregate demand from large and highly fragmented markets, providing vendors with a highly attractive and efficient channel to market and a valuable extension of their sales forces. As some vendors adjust their cost structure and trim their workforces, we believe more business has shifted, and will continue to shift, to distribution channels. The SMB market sector, for example, includes a greater share of long-tail customers who are often more difficult for vendors to access efficiently and profitably given they have lower buying power than large customers who can consolidate orders. |
| | Broad Solutions Offering to Meet Evolving Customer Demand. The average Ingram Micro solution is composed of six different technologies, demonstrating the complexity in the way products and services are consumed in todays marketplace. Our long-standing, entrenched relationships with the largest global technology vendors allow us to provide customers with access to a deep portfolio of hundreds of thousands of technology and cloud products from vendors around the world. This, combined with our Ingram Micro Cloud Marketplace, connects partners with what we believe to be the worlds largest cloud ecosystem, enabling them to generate and satisfy demand more efficiently. Our cloud marketplace serves 29 aggregated marketplaces and supports more than 200 cloud solutions, a number that is rapidly increasing. |
| | Integrated Managed and Professional Services Tailored to Customer Needs. Customers increasingly demand integrated multi-vendor, high-quality service and support. As of June 29, 2024, we had approximately 1,060 engineers globally who provide the high-quality technical, training and pre- and post-sales support, integration and ongoing managed services that partners and customers need, without adding incremental overhead. These engineers collectively hold thousands of current technical certifications, with a single certification typically requiring an investment of 30 hours or more. Through a personalized and consultative approach, we tailor solution sets to specific customer needs and deploy certified technicians to assist where OEMs have gaps and where our customers are unable to support the high cost of technical talent or are implementing highly complex multi-vendor solutions. |
We also enable the circular economy by providing responsible collection and repurposing of e-waste through remanufacturing, recycling, refurbishing and reselling technology devices. We believe that such efforts help our customers achieve their environmental sustainability goals by keeping harmful materials out of landfills.
As of June 29, 2024, we employed approximately 1,230 dedicated software engineers. Our technology, along with third-party technology and information systems, supports our business operations including inventory and order management, shipping, receiving, billing and accounting. Protecting our technology is an important aspect of our strategy, and as of June 29, 2024, we had 361 registered and pending patent applications worldwide, consisting of 27 granted U.S. patents, 232 granted non-U.S. patents and 102 U.S. and non-U.S. patents that are either pending, published or allowed.
Customer Case Studies
The following are representative examples of how customers have benefited from our Company. The case studies represent (i) a strategic customer, Data41, and Ingram Micros engagement with midsized to large reseller
161
Table of Contents
customers who are expanding their businesses into AI, which is representative of business model changes that resellers are attempting to make as technologies evolve to new transactional models; (ii) an emerging technology vendor, UiPath, that led a request for proposal for a global distribution and solution provider that had the global reach, solution portfolio and resources to successfully expand their sales channel; and (iii) an IT consulting firm customer, Trace3, which leveraged our robust resources and Microsoft expertise to rapidly deploy Copilot for Microsoft 365 to users and to build internal expertise:
162
Table of Contents
Customer Case Study 1: Data41
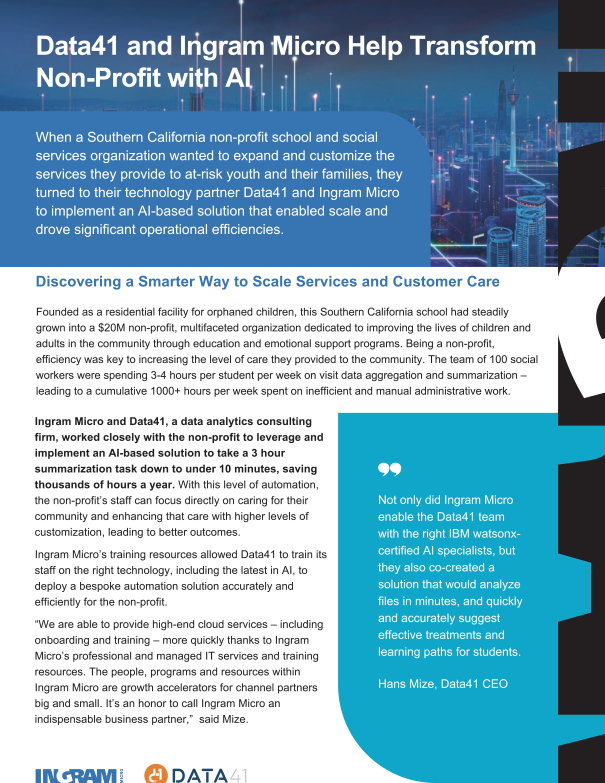
Data41 and Ingram Micro Help Transform Non-Profit with AI When a Southern California non-profit school and social services organization wanted to expand and customize the services they provide to at-risk youth and their families, they turned to their technology partner Data41 and Ingram Micro to implement an AI-based solution that enabled scale and drove significant operational efficiencies. Discovering a Smarter Way to Scale Services and Customer Care Founded as a residential facility for orphaned children, this Southern California school had steadily grown into a $20M non-profit, multifaceted organization dedicated to improving the lives of children and adults in the community through education and emotional support programs. Being a non-profit, efficiency was key to increasing the level of care they provided to the community. The team of 100 social workers were spending 3-4 hours per student per week on visit data aggregation and summarization - leading to a cumulative 1000+ hours per week spent on inefficient and manual administrative work. Ingram Micro and Data41, a data analytics consulting firm, worked closely with the non-profits to leverage and implement an AI-based solution to take a 3 hour summarization task down to under 10 minutes, saving thousands of hours a year. With this level of automation, the non-profit's staff can focus directly on caring for their community and enhancing that care with higher levels of customization, leading to better outcomes. Ingram Micro's training resources allowed Data41 to train its staff on the right technology, including the latest in AI, to deploy a bespoke automation solution accurately and efficiently for the non-profit. "We are able to provide high-end cloud services - including onboarding and training - more quickly thanks to Ingram Micro's professional and managed IT services and training resources. The people, programs and resources within Ingram Micro are growth accelerators for channel partners big and small. It's an honor to call Ingram Micro an indispensable business partner," said Mize. Not only did Ingram Micro enable the Data41 team with the right IBM watsonx-certified AI specialists, but they also co-created a solution that would analyze files in minutes, and quickly and accurately suggest effective treatments and learning paths for students. Hans Mize, Data41 CEO
163
Table of Contents
Customer Case Study 2: UiPath
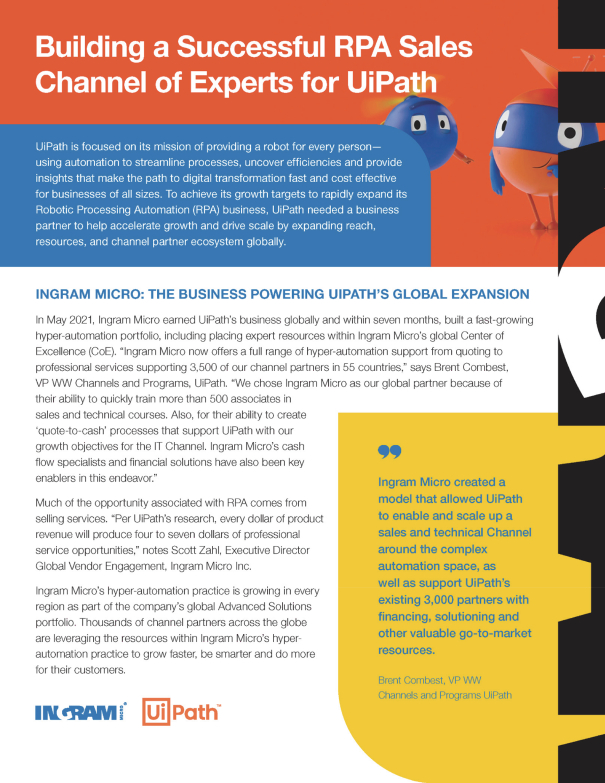
Building a Successful RPA Sales Channel of Experts for UiPathUiPath is focused on its mission of providing a robot for every person-using automation to streamline processes, uncover efficiencies and provide insights that make the path to digital transformation fast and cost effective for business of all sizes. To achieve its growth targets to rapidly expand its Robotic Processing Automation (RPA) business, UiPath needed a business partner to help accelerate growth and drive scale by expanding reach, resources, and channel partner ecosystem globally.INGRAM MICRO: THE BUSINESS POWERING UIPATH'S GLOBAL EXPANSION In May 2021, Ingram Micro earned UiPath's business globally and within seven months, built a fast-growing hyper-automation portfolio, including placing expert resources within Ingram Micro's global Center of Excellence (CoE). "Ingram Micro now offers a full range of hyper-automation support from quoting to professional services supporting 3,500 of our channel partners in 55 countries," says Brent Combest, VP WW Channels and Programs, UiPath. "We chose Ingram Micro as our global partner because of their ability to quickly train more than 500 associates in sales and technical courses. Also, for their ability to create 'quote-to-cash' processes that support UiPath with our growth objectives for the IT Channel. Ingram Micro's cash flow specialists and financial solutions have also been key enablers in this endeavor." Much of the opportunity associated with RPA comes from selling services. "Per UiPath's research, every dollar of product revenue will produce four to seven dollars of professional service opportunities," notes Scott Zahl, Executive Director Global Vendor Engagement, Ingram Micro Inc. Ingram Micro's hyper-automation practice is growing in every region as part of the company's global Advanced Solutions portfolio. Thousands of channel partners across the globe are leveraging the resources within Ingram Micro's hyper-automation practice to grow faster, be smarter and do more for their customers. Ingram Micro created a model that allowed UiPath to enable and scale up a sales and technical Channel around the complex automation space, as well as support UiPath's existing 3,000 partners with financing, solutioning and other valuable go-to-market resources. Brent Combest , VP WW Channels and Programs UiPath
164
Table of Contents
Customer Case Study 3: Trace3
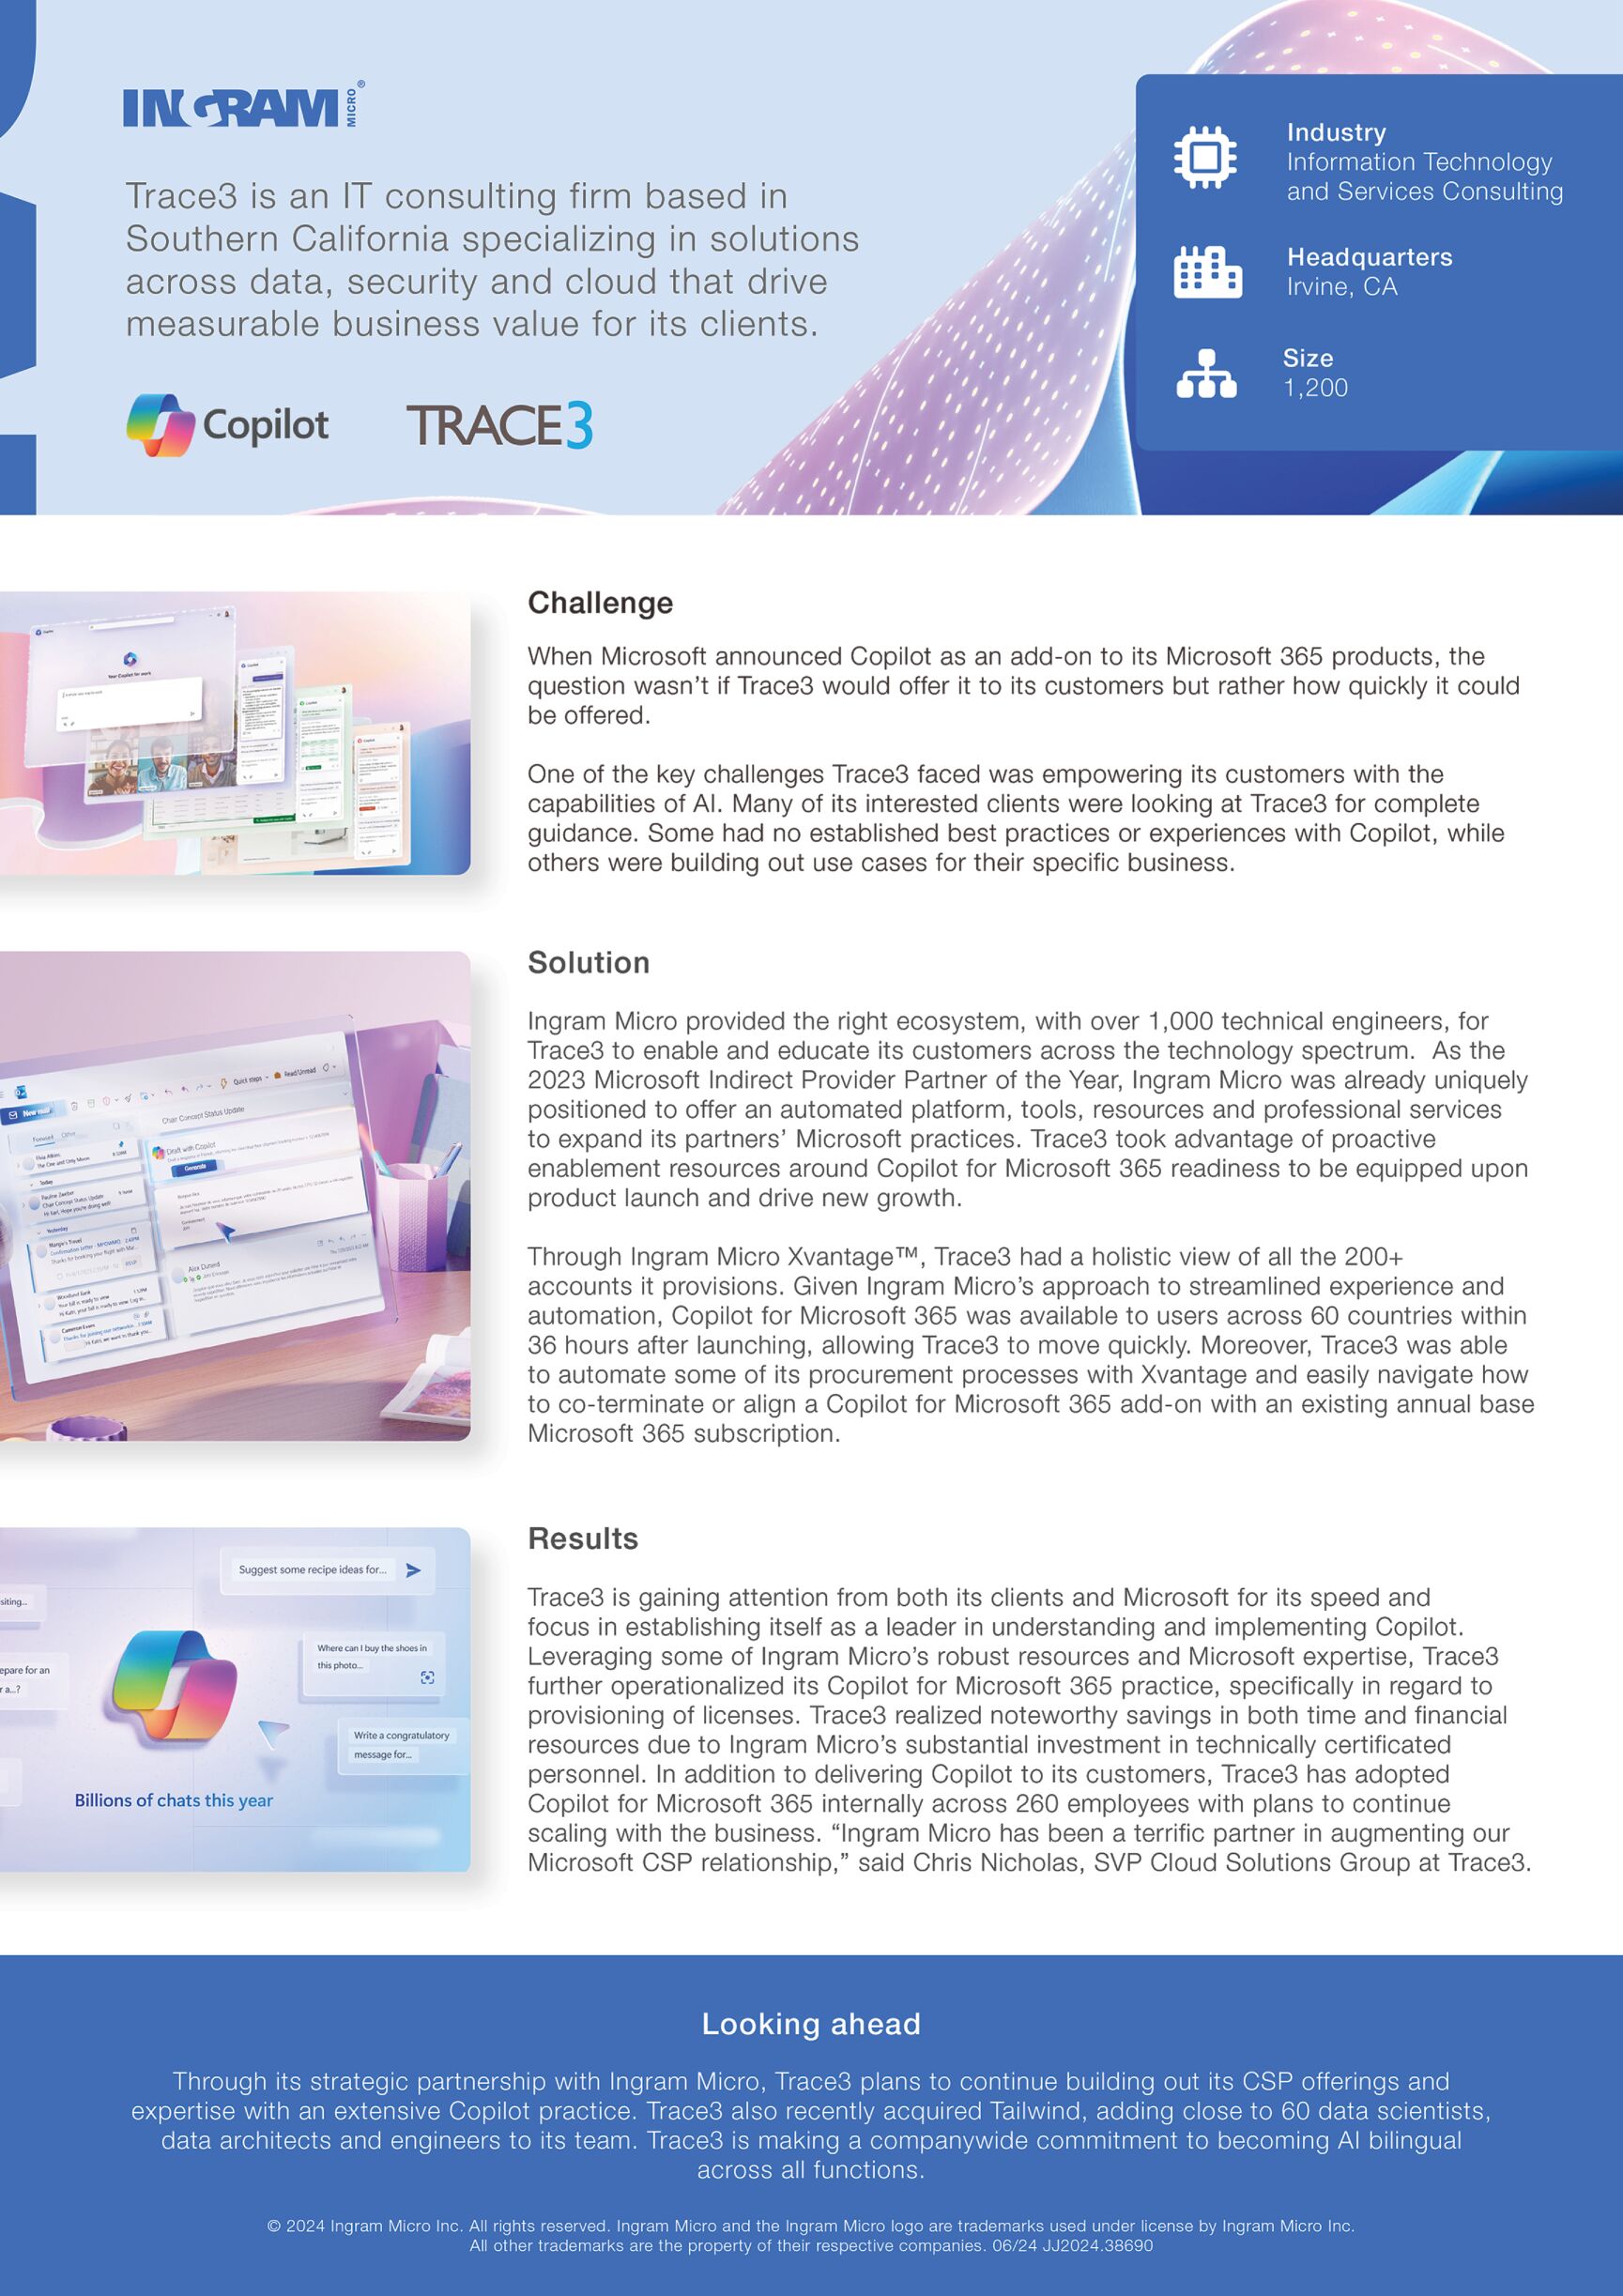
Microsoft Accelerates Channel Transformation With Ingram MicroOffice 365 paved the way for channel partners to sell Software as a Service (SaaS) at scale and drive the migration of IT resources to the Cloud.When Microsoft launched the Microsoft Cloud Solution Provider (CSP) Program in 2015, Ingram Micro was first to support the transformation of Microsoft partners from principally reselling licenses to managing the entire customer relationship. Microsoft looked to Ingram Micro for guidance, education and enablement across the entire buyer's journey. Ingram Micro's Cloud Marketplace provided the right platform for Microsoft's CSP services to ensure that partners could automate many of the requirements of an as a service model and manage end customers at scale. A full suite of Office 365 solutions was offered alongside a team of experts who provided sales and technical training and business resources as partners adopted the new business model. SUCCESS IN CUSTOMER EXPERIENCE, ADOPTION OF SOLUTIONS Today, Ingram Micro continues to invest in its Microsoft Cloud practice to support partners with new programs, certification paths and training, enabling partners to significantly grow their Microsoft businesses. In 2017, Ingram Micro quickly became the largest Azure Indirect Provider globally, and two years later, launched the Microsoft Modern Work Accelerate and MS Security Expert Programs. Ingram Micro also embraced Microsoft Dynamics for its own IM360 CRM and sales enablement. Ingram Micro quickly saw the opportunity in Microsofts early move to subscription services when others saw disruption and enrolled 20,000 partners into the journey. Again, last year Ingram Micro took the initiative as a true business partner and supported us to educate, train and enable the channel to understand and take advantage of Microsofts New Commerce Experience (NCE) Program.Agnes Van De Walle, Partner Lead, Global Partner Service, Microsoft
165
Table of Contents
Our Strategic Priorities
We are a technology-focused company and have invested heavily in developing and acquiring technology, including intellectual property, to enable our partners success. We expect our continued investment in robotics and automation within our advanced logistics centers will augment our efficient, customer-centric delivery capabilities and that our continued investment in our digital capabilities, including in the integration of over 20 proprietary engines within Ingram Micro Xvantage, will enhance the experience of our customers and vendors. We have a proven track record of profitable growth which has enabled us to achieve a position of great competitive strength and remain focused on continuing to deliver strong future growth. We recognize the markets need for sophisticated IT solutions and our strategies are developed with this in mind. Our overall objective is to continue to expand our business and our profitability by delivering innovative and thoughtful solutions to enable business partners to scale and operate more efficiently and successfully in the markets they serve.
Our strategic priorities are aligned to achieve this objective and focus on:
| | Adding digital tools and services to deepen engagement with customers and vendors and continuing to develop a transformative, fully digital platform to further simplify, automate, digitize and scale the delivery of our products and solutions portfolio. We intend to continue expanding our digital and services capabilities to connect and team with our partners and customers and serve their evolving needs. Our goal is to have our entire portfolio of products, software and services available on Ingram Micro Xvantage, delivering a singular business-to-consumer-like experience to our vendor and customer partners in the business-to-business market to interact, learn, partner, plan and consume technology via seamless and autonomous engines. We believe Ingram Micro Xvantage has already influenced, and will continue to influence, the acquisition and delivery of the full spectrum of technology solutions and services. By digitizing and automating quote-to-order, order status and tracking, customer service and other critical business support services, we are reducing transactional complexity and inefficiencies inherent in more manual processes and tools. In addition, as our business intelligence grows through applying the latest in AI and ML technology, we are able to provide higher-value capabilities and recommendations to our customers, enabling them to expand their reach into new markets and categories in a growing XaaS economy. Ingram Micro Xvantage is designed to allow our customers to increasingly benefit from business-to-consumer-like experience, enabling them to shift time and resources away from administering transactions and toward interacting with their end customers and providing them higher value. We expect the investment and commitment we continue to make in Ingram Micro Xvantage will further strengthen our existing relationships, attract new partners and customers and influence end user technology preferences. Xvantage continues to develop with close to two dozen patents pending, 29 million new lines of code, over a hundred internally developed AI models and over 20 proprietary engines powering and supporting the platforms functionality, enabling Xvantage to offer its users instant pricing, billing automation, marketing capabilities, hardware and cloud subscriptions, the ability to configure, quote and track each order, and various other insights and recommendations personalized to the user. |
| | Growing our emerging technologies practices, including cybersecurity and AI, and further extending our technology portfolio to build out additional higher value, more complex product and services offerings. One of our investment priorities for the foreseeable future will be continued expansion of our advanced and emerging technology offerings. We plan to further expand our ecosystem by identifying emerging technologies and higher value, more complex solutions, and adding additional technology vendors to our platform. |
| | Enhancing profitability through operational improvement initiatives, digitization and automation. We have additional opportunities to drive operational enhancement and efficiencies in areas such as pricing, management of rebates, mix enrichment, automation and warehouse efficiency, to name a few. We also plan to continue building our technology roadmap to further develop and enhance our customer and vendor interface and experience. |
| | Continuing our commitment to ESG. We will continue to focus on environmental stewardship, social responsibility and effective governance across our global operations. We aim to continue to invest in our |
166
Table of Contents
| communities and improve our environmental performance, while developing a comprehensive environmental sustainability data management system across our operations. We are committed to minimizing our environmental impact both directly through our operations and indirectly through our influence within our value chain. We will continue to invest in and evolve our ESG efforts, and over the next few years we expect to continue to focus on ESG competency and reporting with a continued focus on climate action and waste reduction, DE&I, supply chain risk assessments and alignment with UN Sustainable Development Goals relevant to our impacts and activities. See Environmental, Social and Governance. |
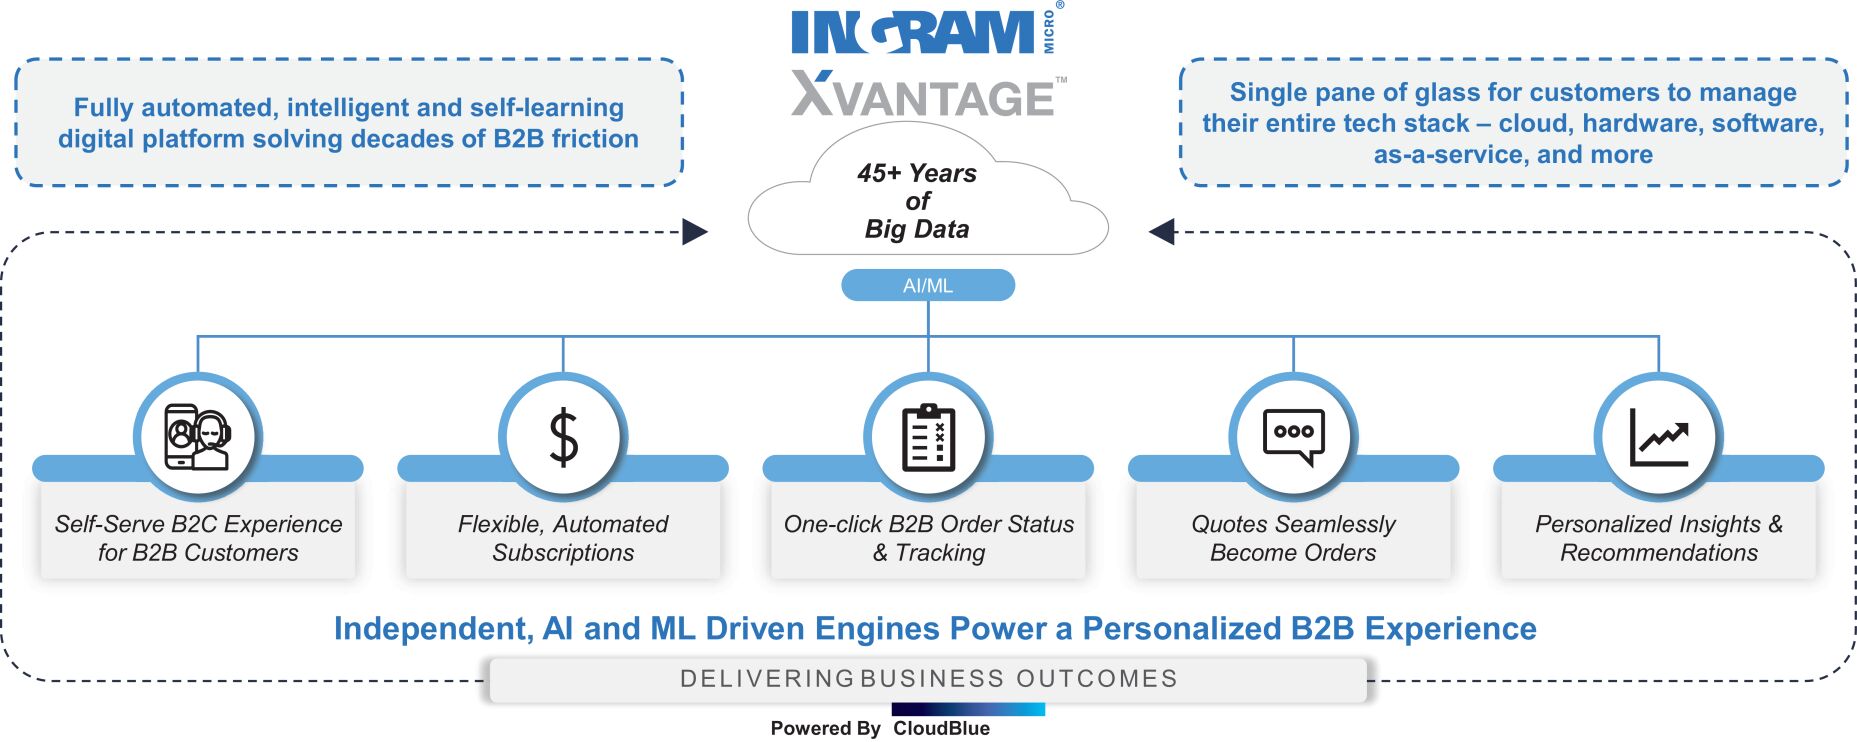
Our Products and Solutions
We provide a broad line of technology, services and solutions from more than 1,500 vendor partners, enabling us to offer comprehensive solutions to our reseller and retail customers. Our suppliers are the worlds most trusted technology leaders, along with emerging technology brands, which include the industrys premier computer hardware suppliers, mobility hardware suppliers, networking equipment suppliers and software publishers such as Advanced Micro Devices, Apple, Cisco, Dell Technologies, Hewlett Packard Enterprise, HP Inc., Lenovo, Microsoft, NVIDIA and Super Micro Computer. We also work with suppliers of computer peripherals, consumer electronics, cloud-based solutions, unified communication and collaboration, DC / POS and physical security products. Our cloud portfolio comprises third-party services and subscriptions spanning a breadth of products from solution software to infrastructure-as-a-service. Our Ingram Micro Cloud Marketplace service portfolio consists of third-party cloud-based services or subscription offerings sold through our own platform. Vendors on the platform include Adobe, Amazon Web Services, Cisco, Microsoft, Proofpoint and VMware. We sell products purchased from many vendors, but generated approximately 15%, 12%, 15% and 16% of our consolidated net sales in the Predecessor 2021 Period, the Successor 2021 Period, Fiscal Year 2022 (Successor) and Fiscal Year 2023 (Successor), respectively, from products purchased from Apple Inc. Additionally, we generated approximately 11%, 10%, 10% and 10% of our consolidated net sales in the Predecessor 2021 Period, the Successor 2021 Period, Fiscal Year 2022 (Successor) and Fiscal Year 2023 (Successor), respectively, from products purchased from HP Inc.
Our cloud marketplace, which in certain key jurisdictions has already been integrated into one unified Ingram Micro Xvantage, connects partners with what we believe to be the worlds largest cloud ecosystem, enabling them to generate demand more efficiently and provide third-party cloud-based services and subscription offerings through a digital platform for the consumption of cloud solutions in an ever-increasing cloud-centric world. We support more than 200 cloud solutions and manage over 36 million seats through our cloud marketplace. Our CloudBlue platform also provides services to many of the worlds leading telecommunication companies, as well as to managed service providers, technology distributors and value-added resellers, and manages over 52 million seats. Our professional services offerings add value to our partners and customers by
167
Table of Contents
providing data-driven business and market insights, pre-sales engineering, post-sale integration, technical support and trade credit and financing solutions to further grow their businesses. In addition, our ITAD and Reverse Logistics and Repairs businesses play an important role in advancing environmental sustainability and bridging the digital divide through electronic device reverse logistics, refurbishment, recycling, reuse and resale for organizations, including the worlds largest mobile telecommunication providers. By helping to enable a circular economy, we help our customers in achieving their sustainability goals and enable consumers to access high-quality, affordable smartphones, computers and other devices.
We are focused on building our presence in those product categories and services and solutions that will benefit from key growth trends, such as the continuing technology shift to cloud-centric solutions, hybrid data centers, anything-as-a-service offerings, AI, hyper automation and circular economy solutions.
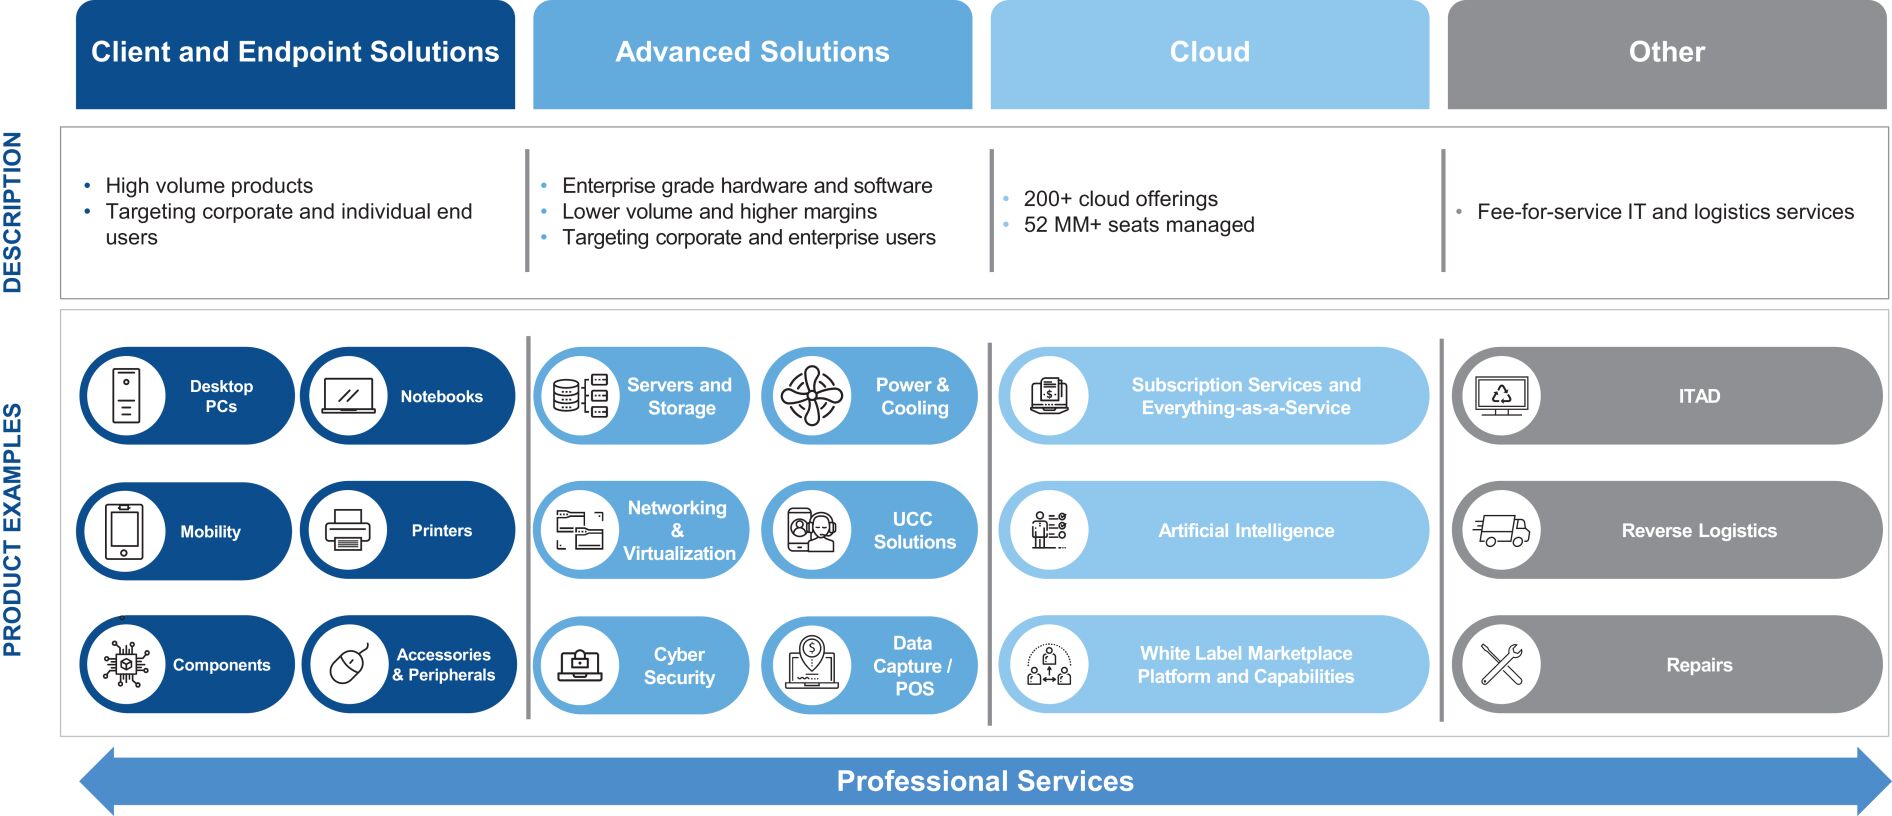
As part of our global presence in each of our four geographic regions, we offer customers a full spectrum of hardware and software, cloud services and logistics expertise through three main lines of business: Technology Solutions, Cloud and Other. In each of our geographic segments we offer customers the product categories listed below broken down under the respective line of business. Beginning in the second quarter of 2024, we began to refer to our Commercial & Consumer category as Client and Endpoint Solutions as a better reflection of the nature of the products and services within that category.
Technology Solutions:
| | Client and Endpoint Solutions (formerly referred to as Commercial & Consumer). We offer a variety of higher-volume products targeted for corporate and individual end users, including desktop personal computers, notebooks, tablets, printers, components (including hard drives, motherboards, video cards, etc.), application software, peripherals, accessories and Ingram Micro branded solutions. We also offer a variety of products that enable mobile computing and productivity, including phones, phone tablets (including two-in-one notebook/tablet devices), smartphones, feature phones, mobile phone accessories, wearables and mobility software. |
| | Advanced Solutions. We offer enterprise grade hardware and software products aimed at corporate and enterprise users and generally characterized by specific projects, which account for lower volumes but higher gross margin. And while Advanced Solutions requires higher operational expenditures, primarily in the form of technical capabilities to serve the market, the operating margin delivered by this business is also generally stronger than Client and Endpoint Solutions. Within this product category we offer servers, storage, networking, infrastructure hardware and software (covering system management, network and storage), hybrid and software-defined solutions, cybersecurity, power & cooling and virtualization (software and hardware) solutions. This category also includes training, professional services and financial solutions |
168
Table of Contents
| related to these product sets. We also offer customers DC / POS, physical security, audio visual & digital signage, UCC and Telephony, IoT (smart office/home automation) and AI products. |
Cloud:
| | Cloud-based Solutions. Our cloud portfolio comprises third-party services and subscriptions spanning a breadth of products from solution software through infrastructure-as-a-service. As technology consumption increasingly moves to XaaS, we have expanded our cloud solutions to more than 200 third-party cloud-based services or subscription offerings, including business applications, security, communications and collaboration, cloud enablement solutions and infrastructure-as-a-service. Also included here are the offerings of our CloudBlue business, which provides customers with multi-channel and multi-tier catalog management, subscription management, billing and orchestration capabilities through a SaaS model. |
Other:
| | Other offerings. We provide customers with ITAD, reverse logistics and repair and other related solutions, and prior to April 2022 included the operations sold through the CLS Sale further described herein. See CLS Sale. These offerings represent less than 10% of net sales for all periods presented herein. |
Our business also includes a comprehensive suite of environmentally focused IT asset disposition solutions from intake to disposal, as well as reverse logistics and repairs solutions. These services operate at the convergence of the digital revolution, increasing demand for environmentally sustainable solutions and growing data security requirements, and include responsibly collecting and beneficially repurposing e-waste through remanufacturing, data sanitization, recycling, refurbishing and reselling technology devices, and asset recovery and management solutions, all through our ITAD and Reverse Logistics and Repairs businesses. Furthermore, offerings within our reverse logistics business include returns management, repair and refurbishment and an aftermarket sales channel. For more information regarding our purchase orders and customer arrangements, please see Managements Discussion and Analysis of Financial Condition and Results of OperationsCritical Accounting EstimatesRevenue Recognition, our audited consolidated financial statements and related notes and our unaudited condensed consolidated financial statements and related notes, each included elsewhere in this prospectus.
Our Customers
We distribute IT and mobility solutions to more than 161,000 customers, including resellers, system integrators and retailers. We conduct business with most of the leading resellers of IT products and services around the world and with many of the worlds leading mobility companies. We serve a customer base that includes value-added resellers, corporate resellers, retailers, custom installers, systems integrators, mobile network operators, mobile virtual network operators, direct marketers, internet-based resellers, independent dealers, product category specialists, reseller purchasing associations, managed service providers, cloud services providers, PC assemblers, independent agents and dealers, IT and mobile device manufacturers and other distributors. Many of our customers are heavily dependent on partners with the necessary systems, capital, inventory availability, logistics capabilities and distribution and repair facilities in place to provide fulfillment and other services. We benefit from a broad geographic presence in 57 countries and are trusted by many of the worlds leading telecommunications companies, mobile operators and retail and consumer brands. We aim to reduce our exposure to the impact of business fluctuations by maintaining a balance in the customer categories we serve. No single customer accounted for more than 10% of our total net sales in any of the periods presented herein.
Sales & Marketing
Our global, customer-facing sales and marketing team drives our go-to-market model centered on a deep understanding of our customer needs, and a goal to provide the industrys broadest solutions offering to meet
169
Table of Contents
evolving customer demand and increasing technology complexity. We have operations in 57 countries, spanning all global regions, while also serving many additional geographies through various export sales offices, including general telesales operations into numerous markets. Our sales teams work closely with our marketing organization to actively pursue leads generated from marketing programs and guide prospective customers through the sales process.
Our marketing effort is focused on generating awareness of Ingram Micros solutions offering, creating sales leads, establishing and promoting our brand and our vendor partners products. Additionally, we offer a wide range of training, professional services, education and support offerings to enable our customers to rapidly onboard, adopt and ultimately realize value from our platform.
Our sales and marketing organization includes sales development, sales operations, field sales and marketing personnel. As of June 29, 2024, we had approximately 12,280 associates in our sales and marketing organization.
Competition
We operate in a competitive environment globally. Competition in our business is based primarily on factors such as level of service, product and solution breadth and availability, subscription management capabilities, credit terms and availability, price, speed of delivery, effectiveness of sales and marketing programs, real-time analytic offerings and e-commerce tools. We compete with other high-volume and value-added international distributors, as well as numerous other smaller, specialized local and regional competitors who generally focus on narrower markets, products, or particular sectors. We also face competition from our vendors that sell directly to resellers, retailers and end-users. Our top competitors include global companies such as TD Synnex, Arrow Electronics, Inc., Scansource, Inc., Westcon-Comstor, Synnex Technology International and Anixter International, and local and regional distributors such as Also Holding, Esprinet, Redington, Exclusive Networks, Intcomex, D&H, Carahsoft, AppDirect and Pax8, along with a number of other smaller local distributors.
We believe that we are well-equipped to outperform our competitors in all areas due to our comprehensive product and service offerings, broad global reach, highly skilled workforce and global distribution network.
Which of the Following IT Distributors Does Your Company Use to Procure Products and Services?
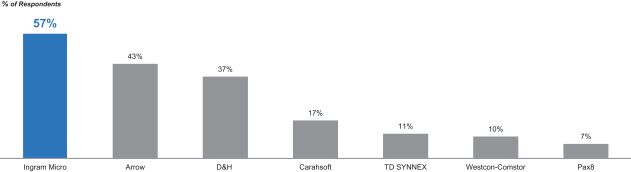
Source: IDC North America Partner Survey, September 2023. Total n=200.
Government Regulation
We are subject to a number of U.S. federal, U.S. state and foreign laws and regulations, covering tax, environmental (relating to product stewardship, including the European Union Waste Electrical and Electronic Equipment Directive), labor and employment, workplace safety advertising, intellectual property, federal securities, trade protection, anti-money-laundering, anti-corruption and anti-bribery, anti-competition, antitrust,
170
Table of Contents
internet and e-commerce, network security, encryption, payments and consumer protection relating to the promotion and sale of merchandise and the operation of fulfillment centers. The products we sell may be subject to tariffs, treaties and various trade agreements, as well as foreign and domestic laws and regulations affecting the import and export of IT products. For more information on the risks associated with complying with applicable laws, please see Risk FactorsRisks Related to the Macroeconomic and Regulatory EnvironmentWe operate a global business that exposes us to risks associated with conducting business in multiple jurisdictions and Risk FactorsRisks Related to the Macroeconomic and Regulatory EnvironmentOur failure to comply with the requirements of environmental, health and safety regulations or other laws and regulations applicable to a distributor of consumer products could adversely affect our business.
We are also subject to data privacy, data security and data protection laws and regulations that impose restrictions on the collection, processing and use of personal data in the jurisdictions in which we operate. For instance, we are subject to the California Consumer Privacy Act and other U.S. state comprehensive privacy laws; the GDPR and EEA member state implementing laws, including as retained in UK law; other similar laws in Brazil and elsewhere; restrictions related to e-marketing, including the ePrivacy Directive in the EEA and the Privacy and Electronic Communications Regulation in the UK; and data localization requirements in China and Russia. The legal and regulatory environment in this space is constantly developing, with an expanding number of jurisdictions considering or enacting new privacy or data security laws, which may not correspond with previously enacted requirements. Ensuring our ongoing compliance with any new requirements may generate additional or unanticipated costs, or otherwise impact our financial condition. For more information on risks related to the development of these laws, see Risk FactorsRisks Related to Information Technology, Data Privacy and Intellectual PropertyChanges in the regulatory environment regarding privacy and data protection regulations could have a material adverse effect on our results of operations.
We monitor changes in the laws and regulations to which we are subject. Our legal and compliance team and our information security team oversee our data protection strategy and monitor our compliance with laws and regulations generally. These teams manage, implement and oversee internal privacy policies and security measures, including regular monitoring and testing of systems and equipment.
We believe that we are in material compliance with applicable laws and regulations, and we are not aware of any laws or regulations that are likely to materially impact our net sales, cash flow or competitive positions or result in any material expenditures. However, many of the laws and regulations to which we are subject continue to develop and could be interpreted, applied or amended in ways that are unfavorable to our business.
Facilities
We have operations in 57 countries, spanning all global regions as set forth in the chart below. Our global infrastructure comprises nearly 11 million square feet across 134 logistics and service centers. Our geographic reach extends into four main regions: North America, EMEA, Asia-Pacific and Latin America.
| Regions | Country | |
| North America (2) |
United States, Canada | |
| EMEA (37) |
Austria, Belgium, Bosnia and Herzegovina, Bulgaria, Croatia, Czech Republic, Denmark, Egypt, Finland, France, Germany, Hungary, Ireland, Israel, Italy, Kosovo, Lebanon, Luxembourg, Morocco, The Netherlands, North Macedonia, Norway, Oman, Pakistan, Poland, Portugal, Qatar, Romania, Saudi Arabia, Serbia, Slovenia, Spain, Sweden, Switzerland, Turkey, United Arab Emirates, United Kingdom | |
| Asia-Pacific (11) |
Australia, Bangladesh, The Peoples Republic of China (including Hong Kong), India, Indonesia, Malaysia, New Zealand, Philippines, Singapore, Sri Lanka, Thailand | |
| Latin America (7) |
Brazil, Chile, Colombia, Costa Rica, Mexico, Peru, Uruguay |
171
Table of Contents
Our headquarters is in Irvine, California and consists of over 200,000 rentable square feet of space pursuant to a lease that expires on July 31, 2026.
Our Trademarks and Service Marks
We own or license various trademarks and service marks, including, among others, Ingram Micro, the Ingram Micro logo, V7 (Video Seven), CloudBlue, Aptec, Xvantage and Trust X Alliance. Certain of these marks are registered, or are in the process of being registered, in the United States and various other countries. Even though our marks are not registered in every country where we conduct business, in many cases we have acquired rights in those marks because of our continued use of them.
Human Capital Resources
As of June 29, 2024, we had approximately 24,150 full-time associates. Additionally, as of June 29, 2024, we utilized the services of approximately 2,000 full-time equivalent temporary or contract workers at peak, who provide us with the workforce agility we require. Works councils or unions represent some of our associates in certain countries, almost exclusively where required by local regulations or brought in through acquisitions; our U.S. associates are not represented by a labor union, nor are they covered by a collective bargaining agreement.
Diversity, Equity and Inclusion
At Ingram Micro, our people and their diverse talents define us. Our unique perspectives generate innovative ideas; our lived differences help us find new futures; our varied strengths and weaknesses enable our growth.
Our commitment to diversity is embodied in our Together Ingram Micro program which includes Listening & Storytelling, Coaching for Actions & Habits, Learning Activities, Scorecards, Focused Diversity Talent Acquisition and Celebrations and Equity Reviews. As of June 29, 2024, women represented approximately 35% of our leaders, and approximately 42% of our associate base. We strive to continue to increase our diversity and maximize our inclusiveness throughout our company in all countries and at all levels, while ensuring we have the best associates regardless of their race, color, religion, sex, age, national origin, disability, sexual orientation, gender identity, marital status, veteran status, citizenship or other protected criteria under state and federal laws. Our CEO, Paul Bay, has clearly communicated to our associates his commitment to, and the importance of, working hard, doing well and treating others with respect.
Pay Equity or Total Rewards
We believe people should be paid for what they do and how they do it, regardless of their gender, race or other personal characteristics. To deliver on that commitment, we benchmark and set pay ranges based on market data and consider factors such as an associates role and experience, the location of their job and their performance. We also review our compensation practices, both in terms of our overall workforce and individual associates, to ensure our pay is fair and equitable. We have reviewed the compensation of associates to ensure consistent pay practices by conducting annual rewards equity reviews.
We offer total rewards that are market-competitive and performance-based, driving innovation and operational excellence. Our compensation programs, practices and policies reflect our commitment to reward short- and long-term performance that aligns with, and drives, value for our owners. Total direct compensation is generally positioned within a competitive range of the market median, with differentiation based on tenure, skills, proficiency and performance to attract and retain key talent.
172
Table of Contents
Associate Engagement
We regularly collect feedback to better understand and improve the associate experience and identify opportunities to continually strengthen our culture. We want to know what is working well, what we can do better and how well our associates understand our priorities and live by the Tenets of Our Success. In 2023, 84% of respondents who received our annual associate survey participated. Our results equaled or exceeded our survey providers High Performance Benchmark in eight of thirteen categories and equaled or increased our favorable results in eleven of thirteen categories since our last full survey in 2021.
Training and Development
People development is foundational to our success. We continually invest in our associates career growth and provide a wide range of development opportunities. In 2023, approximately 77% of our executive positions were filled with internal candidates. We also deployed a new career development framework to further accelerate the development of our colleagues at all levels and areas of the business.
Health, Safety and Wellness
The physical health, financial well-being, life balance and mental health of our associates is vital to our success. Throughout the year, we encourage healthy behaviors through regular communications, educational sessions, voluntary progress tracking, wellness challenges and other incentives. In January 2021, we implemented a global employee assistance program to ensure that all associates and their immediate families have access to many tools and sources of support that address their financial, physical and mental well-being. Our warehouse and integration facilities continue to represent our most significant health and safety risks. Our global health and safety leadership team uses our global injury and illness reporting system to assess trends regionally and worldwide as part of quarterly reviews. Managing and reducing risks at these facilities remains a focus, and injury rates continue to be low.
Environmental, Social and Governance
Our ESG program is overseen by our executive ESG steering committee, consisting of our:
| | Chief Executive Officer, |
| | Executive Vice President and Chief Financial Officer, |
| | Executive Vice President, Secretary and General Counsel, |
| | Executive Vice President, Human Resources, and |
| | Executive Vice President, Global Operations and Engineering. |
The executive ESG steering committee receives periodic briefings from our Global ESG team and individual program owners that include ESG risks and developments. We are constantly in the process of determining meaningful and impactful actions we can take to drive ESG improvements.
173
Table of Contents
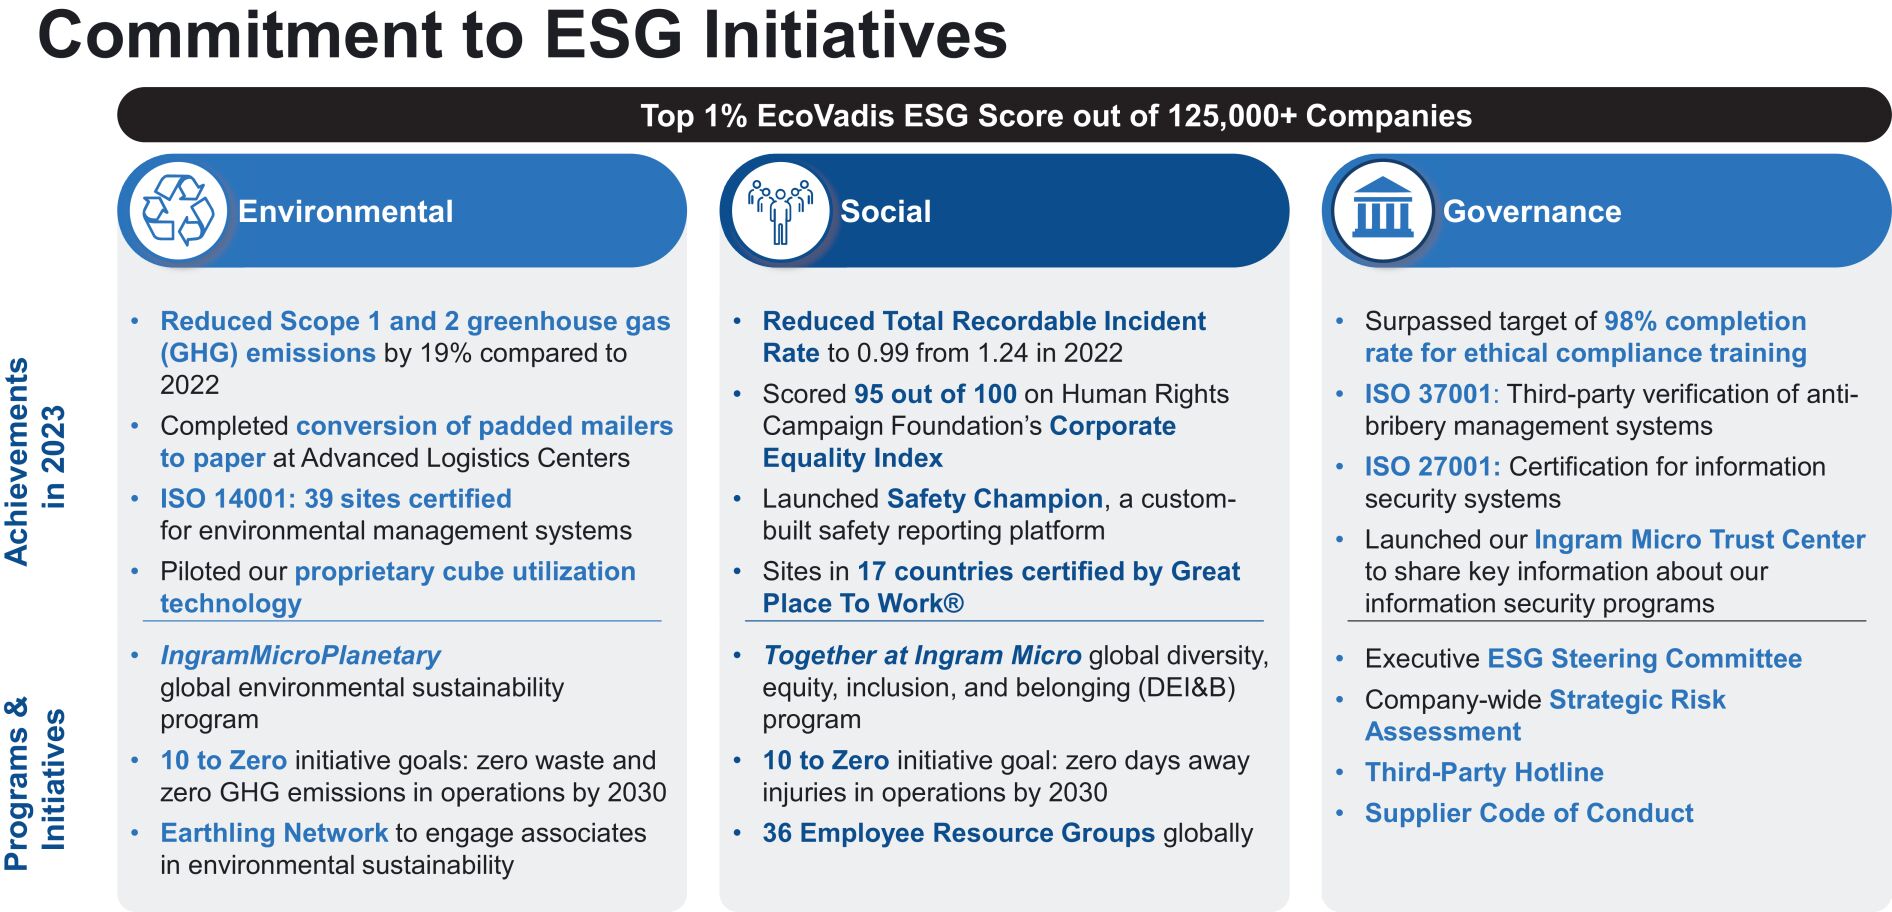
In 2021, we launched a new company-wide ESG program called IngramMicroESG. The program is administered by a dedicated team located at our corporate headquarters in Irvine, California, that is responsible for setting program strategy, initiatives and monitoring progress, all under the guidance of the executive ESG steering committee.
Responsibility is one of the Tenets of Our Success as a company, and environmental stewardship is one area in which we demonstrate our responsibility. Our Environmental Stewardship Policy provides specific guidance to management and associates on their specific responsibilities. Reduction of our environmental footprint is integrated into our work culture through our IngramMicroPlanetary environmental sustainability program, which we use to monitor and track our environmental impact, set context-and risk-based goals and drive and recognize outstanding environmental stewardship. We also seek to reduce our environmental footprint through our Operational Excellence Business System, which is a process-based approach to analyzing operations to identify and eliminate inefficiencies, such as materials waste and excess utilities usage. We have established targets for reducing greenhouse gas emissions and waste in our operations. To support a circular economy, our ITAD solutions focus on the reuse and recycling of electronics, and, as of December 31, 2023, a total of five of our ITAD processing facilities held e-Stewards certifications, four of which were in North America. Since 2019, we have been a registered SmartWay Shipper Partner in the EPAs SmartWay Program, which allows us to benchmark our performance and assess the environmental impact of our transportation in the United States, as well as measure the fuel efficiency of our carrier partners, helping us address the carbon impacts of goods movement within our value chain.
We help our associates and communities thrive through career development programs, embracing inclusivity and diversity while promoting service and our continued focus on health and safety. In addition to launching our Together at Ingram Micro DE&I program, in 2020 and 2021 we formalized our first employee resource groups. We earned a top score of 95% on the Human Rights Campaign Foundations Corporate Equality Index in 2023. We are proud to support the philanthropic interests of our associates through volunteerism and giving programs.
We believe our culture of ethics and integrity is built on a foundation of strong corporate governance, encapsulated in our Code of Conduct. Fair business practices are fundamental to our ability to establish trust with our partners, our associates and the communities in which we operate as well as maintain our reputation. Our ethical compliance program, which is overseen by the audit committee of our board of directors, covers areas such as anti-corruption, anti-bribery, anti-money laundering and harassment and whistleblower compliance. The program spans all our entities, across all operating regions and markets in which we have a presence. Our anti-
174
Table of Contents
bribery management system was verified by Ethisphere as meeting the requirements of ISO 37001 in 2023. We are also a member of the Global Technology Distribution Council, which comprises the technology industrys top wholesale distributors who drive more than $150 billion in annual worldwide sales, allowing us to participate in the development of an industry approach to address corruption.
In early 2024, the Companys broad-based ESG efforts were recognized by EcoVadis, a well-known third-party provider of evidence-based business sustainability assessments, who gave Ingram Micro a platinum medal rating, reserved for the top one percent of the more than 125,000 companies on its platform. We believe this recognition signifies a substantial validation of our companys commitment to ESG initiatives and our leadership in sustainable and responsible business operations.
Legal Proceedings
From time to time we are involved in legal proceedings and subject to investigations, inspections, audits, inquiries and similar actions by government authorities, arising in the normal course of our business. Other than as discussed in Note 10, Commitments and Contingencies, to our audited consolidated financial statements, and in Note 10, Commitment and Contingencies, to our unaudited condensed consolidated financial statements, we do not believe that the currently pending proceedings will have a material adverse effect on our results of operations or financial condition.
175
Table of Contents
Our Executive Officers and Directors
Below are the names, ages as of July 1, 2024, positions and a brief account of the business and experience of certain individuals who we expect will serve as our executive officers and directors at the completion of the offering.
| Name |
Age | Position | ||||||
| Executive Officers: |
||||||||
| Alain Monié |
73 | Non-Executive Chairperson Director Nominee* | ||||||
| Paul Bay |
54 | Chief Executive Officer and Director Nominee* | ||||||
| Michael Zilis |
54 | Executive Vice President and Chief Financial Officer | ||||||
| Scott Sherman |
58 | Executive Vice President, Human Resources | ||||||
| Augusto Aragone |
51 | Executive Vice President, Secretary and General Counsel | ||||||
| Directors and Director Nominees: |
||||||||
| Mary Ann Sigler |
69 | Director | ||||||
| Felicia Alvaro |
63 | Director Nominee* | ||||||
| Craig W. Ashmore |
62 | Director Nominee* | ||||||
| Christian Cook |
53 | Director Nominee* | ||||||
| Jakki Haussler |
67 | Director Nominee* | ||||||
| Leslie Heisz |
63 | Director Nominee* | ||||||
| Bryan Kelln |
58 | Director Nominee* | ||||||
| Jacob Kotzubei |
55 | Director Nominee* | ||||||
| Matthew Louie |
46 | Director Nominee* | ||||||
| Sharon Wienbar |
62 | Director Nominee* | ||||||
| Eric Worley |
53 | Director Nominee* | ||||||
| * | To be elected to the board upon or before consummation of this offering |
Executive Officers
Alain Monié formerly served as the Chief Executive Officer of Ingram Micro and was named Executive Chairman of the Company on January 1, 2022. Mr. Monié will serve as the Executive Chairman of the Company until the earlier of December 31, 2024 or the date of an initial public offering or certain similar transactions, and he will serve as Non-Executive Chairperson of the board of directors upon the completion of this offering. Mr. Monié had served as Ingram Micros Chief Executive Officer since January 20, 2012 until January 1, 2022. He rejoined Ingram Micro as our President and Chief Operating Officer on November 1, 2011, after a year as Chief Executive Officer of APRIL Management Pte., a multinational industrial company based in Singapore. Prior to his role at APRIL Management Pte., Mr. Monié served as President and Chief Operating Officer of Ingram Micro from 2007 to 2010 and initially joined Ingram Micro in February 2003 as Executive Vice President, and served in that role and as President of Ingram Micro Asia-Pacific from January 2004 to August 2007. Prior to joining Ingram Micro, Mr. Monié spent more than two years as President of the Latin American Division of Honeywell International. He joined Honeywell through the corporations merger with Allied Signal Inc., where he built a 17-year career on three continents, progressing from a regional sales manager to head of Asia-Pacific operations from October 1997 to December 1999. Mr. Monié has been a member of the board of directors of The AES Corporation since July 2017 and was a member of the board of directors of Expeditor International of Washington, Inc. from May 2017 to May 2020 and Amazon.com, Inc. from November 2008 to May 2016. As a seasoned executive and Chief Executive Officer of Ingram Micro, Mr. Monié brings in-depth knowledge of Ingram Micros business operations and strategy that is important to the board of directors oversight of strategy, succession planning, enterprise risk management, compensation and implementation of sound corporate governance practices for Ingram Micro. Mr. Monié earned a Masters degree in business
176
Table of Contents
administration from the Institut Supérieur des Affaires, France (now part of the HEC Group). He received high honors in automation engineering studies at the École Nationale Supérieure dArts et Métiers (ENSAM) France.
Paul Bay assumed the role of Chief Executive Officer of Ingram Micro on January 1, 2022. Mr. Bay had served as Ingram Micros Executive Vice President and President of Global Technology Solutions since January 2020. Prior to that, he served as Ingram Micros Executive Vice President and Group President of the Americas from August 2018 to December 2019, Executive Vice President and Chief Executive of Ingram Micro U.S. and Miami Export from 2015 to August 2018, and Sr. Executive Vice President and President of Ingram Micro North America from 2013 to 2014. Mr. Bay first joined Ingram Micro in 1995 and served in various roles of increasing responsibility until 2006. Mr. Bay then served as CEO of Punch! from 2006 to 2010 and rejoined Ingram Micro in 2010. Mr. Bay holds a Bachelors degree in speech communication from California State University, Northridge.
Michael Zilis has served as Ingram Micros Executive Vice President and Chief Financial Officer since January 2020. Prior to that, he served as Ingram Micros Executive Vice President of Asia-Pacific from August 2016 to December 2019, and has served in various other operational and finance roles since joining Ingram Micro in 2006. As Executive Vice President and Chief Financial Officer, Mr. Zilis is responsible for Ingram Micros global finance organization, including financial planning and analysis, mergers and acquisitions, treasury and risk management, financial operations, accounting and reporting, and internal audit, tax and global business processes. Prior to joining Ingram Micro, Mr. Zilis held roles at Avnet, Inc. and Arthur Andersen LLP. Currently, Mr. Zilis serves as a director of Veritone, Inc. (Nasdaq: VERI). Mr. Zilis received his Bachelor of Science degree in Finance and Accounting from Boston College.
Scott Sherman has served as Ingram Micros Executive Vice President of Human Resources since May 2015. As Executive Vice President of Human Resources, Mr. Sherman is responsible for the identification, development and implementation of the companys human resources strategies in support of the organizations global objectives. Mr. Sherman oversees all aspects of human resources worldwide, including organization development and talent management, compensation and benefits, payroll, learning and development. Prior to joining Ingram Micro, Mr. Sherman served as Executive Vice President of Human Resources and a member of the Executive Committee at Allergan from September 2010 to March 2015. Mr. Sherman also held human resources roles at Medtronic, and human resources and territory management roles at Exxon. Mr. Sherman received his Bachelor of Arts degree in International Affairs from the George Washington University and holds a Master of Industrial and Labor Relations from Cornell Universitys School of Industrial and Labor Relations.
Augusto Aragone has served as Ingram Micros Executive Vice President, Secretary and General Counsel since December 2016. Prior to that, Mr. Aragone served a variety of legal leadership roles with the company, especially in the areas of mergers and acquisitions and finance transactions, originally joining as regional counsel for Latin America in 2008. As Executive Vice President, Secretary and General Counsel, Mr. Aragone oversees all aspects of Ingram Micros worldwide legal department, including managing Ingram Micros team of legal professionals, preventing and resolving disputes, promoting Ingram Micros contractual rights and safeguarding Ingram Micros assets. Prior to joining Ingram Micro, Mr. Aragone served as legal director for Latin America for DHL and held several business roles across the international logistics industry in Latin America. Mr. Aragone holds a Juris Doctor degree from Uruguay State University, a Masters degree from Bologna University in Italy and a Master of Laws degree from the University of Miami. He is admitted to the New York bar.
Directors
Mary Ann Sigler has served as a director of Ingram Micro since the acquisition of the company by Platinum in July of 2021. Ms. Sigler is Executive Vice President, Chief Financial Officer and Treasurer of Platinum Advisors. She joined Platinum Advisors in 2004 and is responsible for overall accounting, tax and financial reporting, as well as managing strategic planning projects for the firm. Prior to joining Platinum Advisors, Ms. Sigler was with Ernst & Young LLP for 25 years where she was a partner. Ms. Sigler holds a Bachelor of Arts degree in Accounting from California State University at Fullerton and a Masters degree in Business Taxation
177
Table of Contents
from the University of Southern California. Ms. Sigler is a Certified Public Accountant in California, as well as a member of the American Institute of Certified Public Accountants and the California Society of Certified Public Accountants. She served on the board of directors of Ryerson Holding Corporation (NYSE: RYI) (2010 to 2024). We believe that Ms. Siglers qualifications to serve on our board of directors include her extensive and significant business, financial and investment experience and prior involvement with Platinums investment in Ingram Micro.
Felicia Alvaro served as Chief Financial Officer, EVP and Treasurer for Ultimate Software from 2018 until her retirement in 2020, a period during which she oversaw the companys transition in 2019 from a publicly traded company to a privately held company. Ms. Alvaro joined Ultimate Software as Vice President of Finance in 1998, shortly after the companys initial public offering. During her 22-year tenure at Ultimate Software, she was responsible for the companys accounting, finance, privacy, risk and compliance, financial planning, tax, treasury and financial systems teams. Previously, Ms. Alvaro spent 11 years in finance and accounting positions at Precision Response Corporation, Pueblo Xtra International and KPMG. She served as a director and as Audit Committee Chair of Cornerstone OnDemand, a publicly traded company at the time of her joining, from 2020 until it was acquired and taken private in 2021. She also served as a director and as Audit Committee Chair of ServiceMax, a privately held company, from 2021 until its sale in late 2022 to PTC, a publicly traded company. Ms. Alvaro holds a Bachelor of Science in Accounting from Southeastern Louisiana University and is a Certified Public Accountant in Georgia. Ms. Alvaro was selected to serve on our board of directors due to her decades of senior executive leadership experience and expertise in accounting, auditing, financial reporting, financial planning and analysis, risk oversight and general compliance.
Craig W. Ashmore joined Platinum Advisors in 2014. Mr. Ashmore is currently a Managing Director at the firm and is responsible for senior level business development activities focused on identifying new acquisition opportunities. Prior to joining Platinum Advisors, Mr. Ashmore was Executive Vice President of Planning and Development at Emerson (NYSE: EMR), where he had responsibility for Emersons mergers and acquisitions, strategic planning and corporate technology functions as well as Emerson Network Powers connectivity solutions business. He was a member of Emersons Office of the Chief Executive. Mr. Ashmore holds a Bachelors Degree in Mechanical and Civil Engineering from the University of Connecticut and a masters degree in Business Administration from the Harvard Business School. Mr. Ashmore was selected to serve on our board of directors due to his experience related to private equity, transactional matters and operational expertise.
Christian Cook is currently a Managing Director at Platinum Advisors with responsibility for managing the transition of newly acquired companies into Platinums portfolio. Post-transition, he also has responsibility for strategy, value creation and operational performance at select global portfolio companies. Since his joining Platinum Advisors in 2013, Mr. Cook has served as an officer of a number of Platinums portfolio companies, notably Vertiv Holdings Co (NYSE: VRT), a manufacturer of technology and data center infrastructure equipment. Prior to joining Platinum Advisors, Mr. Cook was with AlixPartners where he focused on the operational improvements and cost reduction opportunities during high urgency situations, often serving interim C-suite roles such as CEO and COO. Mr. Cook holds a Bachelor of Mechanical Engineering degree from the Georgia Institute of Technology and holds a Masters of International Business Studies degree from the University of South Carolina. Mr. Cook was selected to serve on our board of directors due to his experience related to private equity, transactional matters and operational performance on a global scale.
Jakki Haussler serves as the Non-Executive Chairman of Opus Capital Management LLC, an investment advisory firm she co-founded in 1996 and where she served as Chief Executive Officer from 1996 to 2019. She also served as managing director of Capvest Venture Fund LP from 2000 to 2011 and as a partner at Adena Ventures LP from 1999 to 2010. Ms. Haussler currently serves as a director of Service Corporation International (NYSE: SCI), where she chairs the Investment Committee and is a member of the Audit Committee, Barnes Group Inc. (NYSE: B), where she is a member of the Compensation and Management Development Committee, and Vertiv Holdings Co. (NYSE: VRT), where she is a member of the Audit Committee. In addition, she also serves as a director, trustee, and/or chair of the Audit Committee of various Morgan Stanley Funds. Ms. Haussler, a former certified public accountant (CPA), holds a Bachelor of Business Administration degree in
178
Table of Contents
Accounting from the University of Cincinnati and a Juris Doctor degree from the Salmon P. Chase College of Law at Northern Kentucky University. Ms. Haussler was selected to serve on our board of directors due to her experience on several public company boards and her expertise in finance, accounting, portfolio management and business development.
Leslie Heisz served as managing director of Lazard Frères, a financial advisory firm and independent investment bank, from 2004 until her retirement in 2010, providing strategic financial advisory services for clients in a variety of industries. An experienced investment banking and corporate finance executive, Ms. Heisz previously held positions with Dresdner Kleinwort Wasserstein, Solomon Brothers, and PricewaterhouseCoopers. She currently serves as a director and Audit Committee Chair of Edwards Lifesciences Corporation (NYSE: EW) as well as on the boards of Kaiser Foundation Health Plan, Inc., and Kaiser Foundation Hospitals. In addition, she serves as a trustee for certain funds advised by Capital Group. Over the past two decades, Ms. Heisz has also served as a director of several other public companies, including Public Storage (NYSE: PSA) until May 2024 and Ingram Micro Inc. until it was taken private in 2016. Ms. Heisz holds a Bachelor of Science degree in Economics-Systems Science from UCLA and a Master of Business Administration degree from the UCLA Anderson School of Management. Ms. Heisz was selected to serve on our board of directors due to her extensive experience as a public company director and audit committee member, her in-depth knowledge of capital markets, and her expertise in enterprise risk management, mergers and acquisitions, and numerous other finance and governance matters.
Bryan Kelln joined Platinum Advisors in 2008 and is a Partner and President of Portfolio Operations at the firm and is a member of the firms Investment Committee. Mr. Kelln is responsible for all aspects of business strategy and operations at the firms portfolio companies and is involved in evaluating buy- and sell-side opportunities across the firm. Mr. Kelln works closely with the firms operations team as well as portfolio company executive management to drive strategic initiatives and to deploy operational resources. Prior to joining Platinum Advisors, Mr. Kelln was Senior Vice President and Chief Operating Officer at Nortek, Inc. Previously Mr. Kelln was a senior executive at Jacuzzi Brands, Inc. where he served as President of Jacuzzi, Inc. and an Operating Executive with the Jordan Company, a private investment firm where he was involved in acquisitions, divestitures and operations for the firm and served as a board member of portfolio companies. Additionally, Mr. Kelln has also served as President and CEO of RockShox, Inc., Senior Vice President at General Cable Corporation and as a Partner in the Supply Chain Management Practice of Mercer Management Consulting. Mr. Kelln holds a bachelors degree from Washington State University and a Masters of Business Administration from The Ohio State University, Fisher College of Business. Mr. Kelln has served as a director or manager of a number of Platinums portfolio companies. Mr. Kelln serves on the board of directors of Custom Truck One Source, Inc. (NYSE: CTOS), and he is a former director of Key Energy Services, Inc. (2016 to 2020) and Verra Mobility Corporation (NASDAQ: VRRM) (2018 to 2021). Mr. Kelln was selected to serve on our board of directors due to his experience related to private equity, transactional matters and post-acquisition monitoring
and oversight of operational performance at portfolio companies.
Jacob Kotzubei joined Platinum Advisors in 2002 and is a Partner and co-President at the firm. Prior to joining Platinum Advisors in 2002, Mr. Kotzubei was a Vice President of the Goldman Sachs Investment Banking Division High Tech Group in New York City, and the head of the East Coast Semiconductor Group. Previously, he was an attorney at Sullivan & Cromwell LLP in New York City, specializing in mergers and acquisitions. Mr. Kotzubei received a Bachelor of Arts degree from Wesleyan University and holds a Juris Doctor from Columbia University School of Law. Mr. Kotzubei serves on the board of directors of Ryerson Holding Corporation (NYSE: RYI) and Vertiv Holdings Co (NYSE: VRT), and is a former director of Key Energy Services, Inc. (2016 to 2022), Verra Mobility Corporation (NASDAQ: VRRM) (2018 to 2021) and KEMET Corporation (2011 to 2020). Mr. Kotzubei was selected to serve on our board of directors due to his experience in executive management oversight, private equity, capital markets, mergers and acquisitions and other transactional matters.
Matthew Louie joined Platinum Advisors in 2008. Mr. Louie is a Managing Director at the firm and is
179
Table of Contents
responsible for the structuring and execution of acquisition and divestiture transactions. Prior to joining Platinum Advisors in 2008, Mr. Louie was an investment professional at American Capital Strategies, a middle-market focused private equity firm. Prior to American Capital, Mr. Louie worked in venture capital and growth equity at both Canaan Partners and Agilent Technologies, and in investment banking at Donaldson, Lufkin & Jenrette. Mr. Louie holds undergraduate degrees in both Economics and Political Science from Stanford University. He also holds a Masters degree in Business Administration from Harvard Business School. Mr. Louie serves as a manager of a number of Platinums portfolio companies and serves on the board of directors of Vertiv Holdings Co (NYSE: VRT). Mr. Louie was selected to serve on our board of directors due to his experience related to private equity, capital markets, transactional matters and post-acquisition monitoring and oversight of operational performance at portfolio companies.
Sharon Wienbar served as a partner of Scale Venture Partners, a venture capital firm investing in early-stage technology companies, from 2001 until her retirement in 2018. She also served as Chief Executive Officer of Hackbright Academy, a leading software development program for women, from 2015 until its acquisition in 2016. She currently serves as the lead independent director of Enovis Corporation (NYSE: ENOV), where she is a member of the Compensation and Human Capital Management Committee, and as a director of Resideo Technologies, Inc. (NYSE: REZI), where she chairs the Compensation and Human Capital Management Committee and is a member of the Nominating and Governance Committee. In addition, Ms. Wienbar serves as a director of USRowing and Planned Parenthood Direct. Previously, she served as a director for several other public companies, including Covetrus until it was taken private in 2022. Ms. Wienbar holds Bachelor of Science and Master of Science degrees in Engineering from Harvard University, as well as a Master of Business Administration degree from Stanford University. Ms. Wienbar was selected to serve on our board of directors due to her service as a director for multiple public companies and her vast experience investing in technology companies and advising them on corporate strategy.
Eric Worley joined Platinum Advisors in 2001. Mr. Worley is currently a Managing Director at the firm and is responsible for financial due diligence and supporting the structuring and execution of acquisition and divestiture transactions. Post-acquisition, he also has responsibilities related to monitoring and oversight of financial performance at select portfolio companies. Since joining Platinum Advisors, Mr. Worley has served as an officer, director and member of the operating council for a number of Platinums privately held portfolio companies. Prior to joining Platinum Advisors, Mr. Worley was with Ernst & Young in its Transaction Support and Audit practices in Los Angeles and London. Mr. Worley holds a Bachelors Degree in Accounting from Michigan State University and is a former CPA in the State of California. Mr. Worley was selected to serve on our board of directors due to his experience related to private equity, transactional matters and post-acquisition monitoring and oversight of financial performance on a global scale.
Board Composition
Our business and affairs are managed under the direction of our board of directors.
The number of directors which shall constitute our board of directors will initially be fixed at thirteen directors, set forth above. The authorized number of directors may be changed by resolution of our board of directors. Vacancies on our board of directors can be filled by resolution of our board of directors. Upon the completion of the offering, our board of directors will be divided into three classes, each serving staggered three-year terms:
| | our Class I directors will be Craig W. Ashmore, Christian Cook, Leslie Heisz and Alain Monié, and their terms will expire at the first annual meeting of stockholders following the date of this prospectus; |
| | our Class II directors will be Bryan Kelln, Mary Ann Sigler, Sharon Wienbar and Eric Worley, and their terms will expire at the second annual meeting of stockholders following the date of this prospectus; and |
180
Table of Contents
| | our Class III directors will be Felicia Alvaro, Paul Bay, Jakki Haussler, Jacob Kotzubei and Matthew Louie, and their terms will expire at the third annual meeting of stockholders following the date of this prospectus. |
As a result, only one class of directors will be elected at each annual meeting of stockholders, with the other classes continuing for the remainder of their respective terms. See Description of Capital Stock.
In addition, pursuant to our amended and restated certificate of incorporation which will become effective prior to the consummation of this offering and the Investor Rights Agreement we expect to enter into in connection with this offering, Platinum will have the right to nominate for election to our board of directors individuals designated by Platinum subject to the maintenance of certain ownership requirements in us. See Certain Relationships and Related Person TransactionsInvestor Rights Agreement.
Board Independence
Our board of directors has affirmatively determined that Felicia Alvaro, Jakki Haussler, Leslie Heisz and Sharon Wienbar do not have a relationship that would interfere with the exercise of independent judgment in carrying out the responsibilities of a director and that each of these directors is independent as that term is defined under the applicable rules and regulations of the SEC and the listing standards of the NYSE. In making these determinations, our board of directors considered the current and prior relationships that each such director nominee has with our Company, Platinum and all other facts and circumstances our board of directors deemed relevant in determining their independence.
Controlled Company Exception
After the completion of this offering, Platinum will continue to beneficially own shares representing more than 50% of the voting power of our shares eligible to vote in the election of directors. As a result, we will be a controlled company within the meaning of the NYSEs governance standards. Under such corporate governance standards, a company of which more than 50% of the voting power is held by an individual, group or another company is a controlled company and may elect not to comply with certain corporate governance standards, including the requirements that (1) a majority of our board of directors consist of independent directors, (2) our board of directors have a compensation committee that is composed entirely of independent directors with a written charter addressing the committees purpose and responsibilities, and (3) that our director nominations be made, or recommended to the full board of directors, by our independent directors or by a nominations committee that is composed entirely of independent directors and that we adopt a written charter or board resolution addressing the nominations process.
For at least a period of time following this offering, we intend to utilize all of these exemptions. As a result, following this offering, we will not be required to have a majority of independent directors on our board of directors and will not be required to have compensation or nominating and corporate governance committees that are composed entirely of independent directors. Accordingly, our stockholders will not have the same protections afforded to stockholders of companies that are subject to all of the corporate governance requirements of the NYSE. In the event that we cease to be a controlled company and our shares continue to be listed on the NYSE, we will be required to comply with these provisions within the applicable transition periods.
If at any time we cease to be a controlled company, we will take all action necessary to comply with the independence requirements, subject to any permitted phase-in period.
Committees of the Board of Directors
Upon the listing of our shares on the NYSE, our board of directors will have three standing committees: an audit committee, compensation committee, and nominating and corporate governance committee, each of which
181
Table of Contents
will operate under a charter that has been approved by our board of directors. In addition, from time to time, special committees may be established at the direction of the board of directors when necessary to address specific issues. Our chief executive officer and other executive officers will regularly report to the non-executive directors and the audit committee, compensation committee, and nominating and corporate governance committee to ensure effective and efficient oversight of our activities and to assist in proper risk management and the ongoing evaluation of management controls. Upon the listing of our shares on the NYSE, copies of each committees charter will be posted on our website, www.ingrammicro.com. The reference to our website address does not constitute incorporation by reference of the information contained at or available through our website, and you should not consider such information to be a part of this prospectus.
Audit Committee
Upon the completion of this offering, we expect to have an audit committee, consisting of Felicia Alvaro, Leslie Heisz and Sharon Wienbar, with Ms. Alvaro serving as the Chair. Each of Ms. Alvaro, Ms. Heisz and Ms. Wienbar qualifies as an independent director under the NYSEs corporate governance standards and the independence requirements of Rule 10A-3 of the Exchange Act. Our board of directors has determined that each of Ms. Alvaro and Ms. Heisz qualifies as an audit committee financial expert as such term is defined in Item 407(d)(5) of Regulation S-K.
The primary purposes of the audit committee are to prepare the audit committee report required by the SEC and to assist our board of directors with its oversight of (1) our risk management policies and procedures; (2) the audits and integrity of our financial statements; (3) the effectiveness of our internal controls over financial reporting; (4) our compliance with legal and regulatory requirements; (5) the qualifications, performance and independence of the outside auditors; and (6) the performance of our internal audit function.
Compensation Committee
Upon completion of this offering, we expect to have a compensation committee consisting of Jacob Kotzubei, who will be serving as the Chair, Leslie Heisz, Bryan Kelln, Mary Ann Sigler and Sharon Wienbar. The primary purposes of the compensation committee are to review and approve corporate goals and objectives relevant to the compensation of our Chief Executive Officer and the other senior executives; to evaluate the performance of the Chief Executive Officer and the other senior executives in light of such goals and objectives; to determine and approve the compensation of our Chief Executive Officer and the other senior executives; to make recommendations to our full board of directors with respect to incentive-based and equity-based compensation plans that are subject to board approval; to prepare the disclosure required by SEC rules; and to oversee our overall compensation structure, policies and programs.
Nominating and Corporate Governance Committee
Upon completion of this offering, we expect to have a nominating and corporate governance committee consisting of Matthew Louie, who will be serving as the Chair, Christian Cook, Jakki Haussler and Eric Worley. The primary purposes of the nominating and corporate governance committee are to review and make recommendations to our full board of directors regarding the structure and composition of the board and its committees, including identifying qualified director nominees consistent with criteria approved by our board of directors; to develop and recommend corporate governance guidelines to our full board of directors; and to oversee the evaluation of our board of directors, its committees, and our management team.
Compensation Committee Interlocks and Insider Participation
None of the members of our compensation committee is or has at any time during the past year been an officer or employee of ours, except for Mary Ann Sigler who was our President and Treasurer within the past year and shall no longer be an officer of the Company upon the completion of this offering. None of our
182
Table of Contents
executive officers serves as a member of the compensation committee or board of directors of any other entity that has an executive officer serving as a member of our board of directors or compensation committee.
We are parties to certain transactions with Platinum and its affiliates and certain of our directors described in the section of this prospectus entitled Certain Relationships and Related Person Transactions.
Role of our Board of Directors in Risk Oversight
Our board of directors is responsible for overseeing our risk management process. Our board of directors focuses on our general risk management strategy, the most significant risks facing us and oversees the implementation of risk mitigation strategies by management. Our board of directors is also apprised of particular risk management matters in connection with its general oversight and approval of corporate matters and significant transactions.
Code of Conduct
We have adopted a Code of Conduct that applies to all of our directors, officers and team members, including our chief executive officer and chief financial and accounting officer. Our Code of Conduct will be available on our website upon the completion of this offering. Our Code of Conduct is a code of ethics, as defined in Item 406(b) of Regulation S-K. We will make any legally required disclosures regarding amendments to, or waivers of, provisions of our code of ethics on our website.
183
Table of Contents
The following discussion and analysis of our executive compensation philosophy, objectives and design, our executive compensation program components, and the process followed for making decisions regarding all components of compensation with respect to Fiscal Year 2023 (Successor) for our executive officers should be read together with the compensation tables and related disclosures set forth below. The discussion in this section contains forward-looking statements that are based on our current considerations and expectations relating to our executive compensation programs and philosophy. As our business and our needs evolve, the actual amount and form of compensation and the compensation programs that we adopt may differ materially from current or planned programs as summarized in this section. The following discussion may also contain statements regarding corporate performance targets and goals. These targets and goals are disclosed in the limited context of our compensation programs and should not be understood to be statements of managements expectations or estimates of future results or other guidance. We specifically caution investors not to apply these statements to other contexts.
Compensation Discussion & Analysis
This Compensation Discussion and Analysis reviews the compensation provided to our Chief Executive Officer, our Chief Financial Officer and our three other most highly compensated officers who served as executive officers as of the last day of Fiscal Year 2023 (Successor) (collectively, the named executive officers, or NEOs) as determined under the rules of the SEC and set forth in the Summary Compensation Table.
Our NEOs for Fiscal Year 2023 (Successor) were:
| Executive Officer |
Position as of December 31, 2023 |
|
| Paul Bay | Chief Executive Officer (CEO) | |
| Michael Zilis | Chief Financial Officer (CFO) | |
| Alain Monié | Executive Chairman | |
| Augusto Aragone | Executive Vice President, Secretary & General Counsel | |
| Scott Sherman | Executive Vice President, Human Resources (EVP HR) |
Executive Summary
Decisions Regarding Material Elements of Compensation
All determinations relating to the components and amounts of compensation paid to our CEO and Executive Chairman for Fiscal Year 2023 (Successor) were approved by the board of directors in early 2023. All recommendations relating to the components and amounts of compensation paid to our other NEOs for Fiscal Year 2023 (Successor) were made by the CEO and approved by the board of directors. Decisions regarding compensation to be paid to the CEO and each of the other NEOs following completion of this offering, and for each fiscal year thereafter, will be made by the board of directors or by the compensation committee that will be organized upon completion of this offering under a charter that has been approved by the board of directors. See Management for information regarding the composition of our board of directors and committees following the consummation of this offering.
The following summarizes the decisions made in Fiscal Year 2023 (Successor) regarding the material elements of 2023 compensation.
| | Increases to Base Salary. Salaries are reviewed annually to ensure they are externally competitive, reflect individual performance and are internally equitable relative to our other executives. Our CEO and EVP HR met in Q1 2023 to review market data of executive officers of similarly sized companies, current economic conditions and other market factors and compare to the base salary of each of our NEOs (except our CEO and Mr. Monié), in order to determine the appropriate base salary changes to |
184
Table of Contents
| recommend to the board of directors for 2023. Upon review of the CEOs recommendations for base salary increases for the applicable NEOs, the board of directors approved the individual base salary increases for such NEOs that became effective April 1, 2023. The board of directors also reviewed Mr. Bays annual base salary against market data of CEOs of similarly sized companies and approved a merit increase for him effective April 1, 2023. |
| | Establishing Challenging Targets to Differentiate Payments Under Our Annual Executive Incentive Program (EIP). The EIP is a short-term incentive plan under which participants can earn annual cash payments based on annual company, business unit and/or functional performance, as well as individual performance. We set financial performance targets under the EIP each year with the primary objective of aligning executive compensation with total company performance. Our CEO, other officers and other EIP eligible executives were paid from an EIP pool (the EIP Pool) that required achievement of actual non-GAAP EBITDAR equal to at least 85% of the expected non-GAAP EBITDAR set forth in Fiscal Year 2023 (Successor) annual operating plan for any bonus to be paid, with threshold funding of 50% upon achievement of such threshold non-GAAP EBITDAR performance, target funding upon achievement of the 2023 plan for non-GAAP EBITDAR, and maximum funding of the EIP Pool (at 200%) when actual non-GAAP EBITDAR exceeds the strategic plans non-GAAP EBITDAR by 25% (with straight line interpolation between threshold and target, and target and maximum performance). The Companys 2023 non-GAAP EBITDAR performance, $1,294.97 million, was above the non-GAAP EBITDAR threshold, $1,117.0 million, and below the non-GAAP EBITDAR target, $1,314.2 million, which resulted in the funding of the EIP Pool at 95.13%. For these purposes, we define non-GAAP EBITDAR as foreign exchange neutral (FXN) earnings before interest, taxes, depreciation, amortization and restructuring or other similar costs as defined by management and approved by the board. The EIP Pool was further distributed to each NEO individually taking into consideration their contribution to the strategic plan, as well as achievement of annual goals and individual performance considerations; however, no factor was considered in a formulaic or objective manner. The individual payments to our CEO and the other NEOs (other than Mr. Monié who was not eligible for the EIP with respect to Fiscal Year 2023 (Successor)) are discussed further on page 192 and range between 95% and 96% of the target annual EIP incentive. |
| | Participation Plan. The Ingram Micro Holding Corporation (formerly Imola Holding Corporation) 2021 Participation Plan (the Participation Plan) incentivizes key associates, including our NEOs (other than Mr. Monié), by granting performance units, the value of which is tied to the appreciation in the value of the Company. The performance units result in proceeds payable to the participants upon the occurrence of certain qualifying events. |
| | Transition Agreement with Mr. Monié. In connection with the transition of Mr. Monié from our CEO to Executive Chairman as of January 1, 2022 and his expected retirement as of December 31, 2024, or the day after the grant date of certain shares that will be granted following the occurrence of our initial public offering or certain similar transactions (as described elsewhere in this Compensation Discussion & Analysis), Mr. Monié and Ingram Micro agreed upon the terms and conditions of his transition and retirement. A summary of this transition agreement, which has been amended three times since it was first entered into on October 2, 2021, is included in Mr. Monié Transition Agreement found later in this Compensation Discussion & Analysis. |
Focus on Long-Term Value Creation.
At executive management levels, compensation focuses on long-term shareholder value creation, reflecting our NEOs responsibility for setting and achieving long-term strategic goals. In support of this responsibility, compensation is heavily weighted toward variable compensation with a focus on long-term incentives. The units granted under our Participation Plan, which vest over five years from the July 2021 grant date or upon our primary stockholder, Platinum, achieving certain specified returns in respect of their investment in the Company, represent a significant portion of the compensation payable to our NEOs (other than Mr. Monié who did not receive any units).
185
Table of Contents
Pay-for-Performance and CEO Compensation.
We emphasize pay-for-performance with performance-based compensation, including annual EIP awards, performance-based long-term cash incentives and our Participation Plan. With the introduction of the Participation Plan awards in 2021, we ceased granting new awards to our NEOs under the cash-based long-term incentive program; however, our NEOs did remain eligible to realize certain payments in 2023 under previously granted awards that were outstanding under our cash-based long-term incentive program and were earned based on our performance in 2022. At the time 2023 compensation decisions were made, new performance-based compensation awards were limited to the EIP and constituted 71% of our CEOs new total target annual cash compensation and 46% to 55% of each of our other NEOs 2023 new total target annual cash compensation, excluding Mr. Monié who was not eligible for the EIP in 2023. This performance-based compensation does not include the value of performance-based long-term cash compensation that was granted in previous years and paid in 2023 based on achievement against 2022 performance targets or units granted under our Participation Plan, the value of which we were not able to quantify at the time Fiscal Year 2023 (Successor) compensation decisions were made (or at any time thereafter during Fiscal Year 2023 (Successor)).
Focus on Best Practices.
Our leadership team periodically examines our executive compensation practices in an effort to align them with best practices and evolving trends as a private company. For example (and as described further below):
| | A clawback policy exists that provides for the repayment of incentive and/or severance compensation in appropriate circumstances; |
| | Awards under our short-term and long-term incentive plans (other than the Participation Plan) are capped to limit windfalls; |
| | None of the NEOs has an employment agreement, however, Mr. Monié is party to a transition agreement as further discussed in Mr. Monié Transition Agreement below; |
| | Benefits and perquisites are generally not provided to NEOs beyond the level provided to all other levels of management; and |
| | The CIC Plan (as defined below) does not automatically accelerate vesting, requires a double trigger before benefits are paid and does not have any provision for tax gross-ups. |
We expect that upon the completion of this offering, our new board of directors or its compensation committee will review any existing policies above and put in place the following additional executive compensation best practices:
| | The compensation committee will retain and consult with its independent outside compensation consultants on a regular basis and will have sole discretion to engage or terminate its compensation consultants and other advisors; |
| | NEOs will be subject to significant stock ownership guidelines; |
| | The Company will adopt a clawback policy that meets the applicable SEC and NYSE requirements; |
| | The Company will reinstate its policy prohibiting its associates (including our executive officers and directors) from using Company stock in hedging transactions; |
| | Company directors and executive officers will be prohibited from engaging in short sales of Company securities, holding Company securities in a margin account or having Company securities pledged as collateral for a loan, and any Company securities transaction will require approval from the office of the General Counsel; and |
| | Repricing of options will not be permitted without the consent of shareholders. |
186
Table of Contents
Overall Design and Rewards of the Executive Compensation Program
Design Elements
We operate in the extremely competitive, rapidly changing and low-margin Client and Endpoint Solutions distribution industry and are continuing our expansion into the higher-margin Advanced Solutions and Cloud-based Solutions categories. The broad objectives and key features of each element of the 2023 executive compensation program were as follows:
| Compensation Element |
Objectives |
Key Features |
||
| Base Salary | Links performance and pay by providing competitive levels of base salary for each NEO based on the NEOs role and responsibilities. Used to attract and retain executive talent in a very competitive marketplace. | Reflects:
Peer market median range for positions with similar responsibilities and business size, and
An NEOs responsibilities and performance, as demonstrated over time.
Salaries are reviewed annually to ensure they are externally competitive, reflect individual performance and are internally equitable relative to our other executives. |
||
| Annual Executive Incentive Program (EIP), including the Strategic Objectives (MBOs) thereunder | Provides incentives to focus our NEOs on the actions necessary to achieve the approved annual business plan.
Identifies what is expected for the year from the standpoint of corporate, business unit, regional and country results. Additionally, specific individual objectives and other strategic management-by-objective (MBO) goals provide focus on strategic projects that often deliver positive results over future years.
Links reward to accomplishment of goals within executives control and encourages both profitable growth and operating efficiency. |
Establishes incentive targets as a percentage of each NEOs base salary that approximate the median market practice of comparable positions at comparator peer group companies. Each participating NEO has an individual MBO target that is 20% of the NEOs EIP target. Achievement against the MBO component is capped at 100% of the MBO target.
EIP payouts depend on meeting certain performance targets and specified strategic objectives over the course of a one-year performance period. Achievement against the EIP target is capped at 200% of the EIP target. |
||
| Performance targets and results vary among our NEOs to reflect appropriate differences in their responsibilities, as well as their individual performance. | ||||
187
Table of Contents
| Compensation Element |
Objectives |
Key Features |
||
| Cash-Based Long-Term Incentive Award Program | Provided retentive mechanism that attempted to mimic retentive power of stock-based awards. Similar to a stock incentive program, historically 55% of the target award was provided as a performance-based award, cliff vesting after three years, and 45% was provided as a time-based award, vesting 50% on the second anniversary and 50% on the third anniversary.
Performance metrics aligned the long-term goals of our NEOs with those of our owners to increase value.
Encouraged retention through the overlapping multi-year performance periods. |
No grants have been made under this program to any NEO since Platinums acquisition of Ingram Micro. Certain performance-based awards remained outstanding through early 2023 and became vested and payable in 2023 based on our meeting non-GAAP Net Income performance targets for 2022. Future long-term incentive grants following this offering will likely be stock-based. We will review the appropriate measures to use in future performance-vesting stock- based awards.
Final payments under these programs were made to our NEOs in early 2023. |
||
| Participation Plan | |
No grants have been made under this program to any NEO since the initial awards in 2021. This is a long-term incentive program using time-vested and performance-based units, with performance-vested awards subject to achievement of shareholder profit and multiple of invested capital gains. We intend to terminate the Participation Plan and all awards under the plan in connection with this offering. | ||
| Benefits and Perquisites | Provide market competitive benefits to all associates, with limited special perquisites to NEOs. | NEOs participate in our broad-based health and welfare, life insurance, disability and retirement programs for management associates. We provide officers and other executive leadership in the U.S. (including our NEOs) with executive physicals. | ||
Design Principles
We believe a significant portion of NEO compensation should be at risk and subject to our financial performance. The only non- performance-based elements of our NEO compensation are base salaries and our employee benefit programs that are generally available to all management associates, and time-vesting cash-based long-term incentives that were awarded in previous years to Mr. Monié. The remainder of compensation must be earned through the attainment of predetermined financial or strategic performance objectives. Compensation programs are designed to align the financial interests of our NEOs with those of our owners by
188
Table of Contents
providing appropriate short-and long-term financial incentives that reward executives for achieving objectives that enhance shareholder value. Our key design principles include:
| 1. | Target executive compensation with reference to the market median (50th percentile) for each element of pay and in total to be competitive with other employment opportunities. |
| | A competitive compensation program is critical in attracting, retaining and motivating our senior leadership in order to achieve our long-term business and financial objectives. |
| | In late 2021, we engaged an outside executive compensation consultant to define the comparator peer group as the following group of 18 publicly traded companies: |
| Technology Distributors |
Other Distributors |
Broader Tech Ecosystem |
||
| Arrow Electronics, Inc. Avnet, Inc. CDW Insight Enterprises, Inc. TD Synnex Corporation |
AmerisourceBergen Corporation (Cencora, Inc. as of August 2023) Archer-Daniels-Midland Bunge Cardinal Health GXO Logistics McKesson Corporation Performance Food Group Sysco United Natural Foods W.W. Grainger, Inc. WESCO International, Inc. |
Best Buy DXC Tech |
| | In late 2022, we engaged the same outside executive compensation consultant (which confirmed that no modifications to the above peer group were necessary or advisable for fiscal year 2023 compensation decisions) to benchmark NEO compensation against SEC filings of the peer group and the Radford Global Compensation Database including public and private U.S. companies with annual revenues between $13.75 billion and $55 billion. |
| | The management analysis and compensation report prepared by the compensation consultant examined the competitiveness of our executive compensation programs in total and by each element of compensation (base salary, annual incentives and long-term incentives). In doing so, the value of each NEOs compensation elements was compared to median information available from the survey sources and defined comparator group. Benefits and perquisites were not included in the 2022 report as they represent a small portion of our NEOs total remuneration. |
| 2. | Importance of Internal Pay Equity. Balancing competitiveness with internal equity helps support management development and movement of talent worldwide throughout the Company. Differences in actual compensation among associates in similar positions will reflect individual performance, future potential and business results. This effort also helps us promote talented leaders to positions with increased responsibilities and provides meaningful developmental opportunities. |
| 3. | Pay-for-Performance. We emphasize pay-for-performance, as indicated above under Focus on Long-Term Value Creation. With the introduction of the Participation Plan awards in 2021, we ceased granting new awards to the NEOs under the cash-based long-term incentive program. Income received in 2023 tied to the long-term incentive program was due to the vesting and performance requirements of the cash-based long-term incentive awards granted in prior years being met. At the time 2023 compensation decisions were made, new performance-based compensation awards were limited to the EIP for fiscal year 2023 and constituted 71% of our CEOs new total target annual cash compensation and 46% to 55% of each of our other NEOs 2023 new total target annual cash compensation, excluding Mr. Monié who was not eligible for the EIP for fiscal year 2023. This performance-based |
189
Table of Contents
| compensation does not include the potential value of outstanding performance-based long-term cash compensation that was granted in previous years or units granted under our Participation Plan, the value of which we were not able to quantify at the time 2023 compensation decisions were made (or at any time thereafter during Fiscal Year 2023(Successor)). |
What is Rewarded
Executive compensation is designed to reward achievement of targeted financial results and individual performance. Our performance metrics are generally based on financial results, excluding restructuring charges, integration and transition costs directly related to acquisitions and implementation of cost-reduction programs and the impacts of any unplanned acquisitions. These metrics are regularly used by our management internally to understand, manage and evaluate our business and make operating decisions. The following table defines each performance metric used in 2023 as an executive incentive measure and states why the metric was selected and the compensation programs which use that metric. We are reviewing which financial metrics will be used in the future for each of our performance-based components of compensation.
| Metric |
Definition |
Why Selected |
Pay Programs |
|||
| Non-GAAP EBITDAR | Non-GAAP FXN earnings before interest, taxes, depreciation, amortization and restructuring or other similar costs as defined by management and approved by the board of directors. | Performance metrics align the long-term goals of our executives with those of our owners to increase value. | Annual Executive Incentive Program | |||
| Individual performance is assessed via the Performance Management Process (PMP) | PMP is designed to establish specific objectives for associates related to overall company goals and help them understand their role in meeting these objectives. Objectives are established for specific initiatives, major responsibilities key to their position, critical competencies and individual developmental requirements. | PMP is an effective tool in assessing performance against individual goals. Once our objectives are established, salaried associates (including NEOs) set individual objectives aligned with our strategic direction. At year end, salaried associate performance is assessed against established goals and executive competencies and behaviors. |
Base Salary
Annual Executive Incentive Program |
|||
Exclusion of any items from the calculation of any of these measures must be pre-approved by management and approved by the board of directors.
Elements of Compensation
The elements of NEO compensation (other than with respect to Mr. Monié) are annual base salary, annual bonus, cash-based long-term incentive awards (granted prior to 2022), Participation Plan grants and benefits. The mix and proportion of these elements to total compensation are benchmarked annually against the survey and peer group data for each NEO. The CEO, following consultation with outside executive compensation advisors and with approval from the board of directors, may make changes to the mix or relative weighting of each compensation element after taking into consideration the impact a change in one element may have on other elements and total compensation. A summary of each element of compensation and how the amount and formula are determined is presented below.
190
Table of Contents
How Designed and Determined
Base Salary
Each NEO is eligible for an annual salary review to ensure the base salaries of our NEOs are externally competitive, reflect individual performance and are internally equitable relative to our other executives. The CEO and EVP HR engage an outside compensation consultant to review all components of pay for the NEOs each year and to compare each NEOs pay to the pay of similar roles at our peer group companies. The CEO and EVP HR considered this external report, the NEOs scope of responsibilities within the organization, as well as the CEOs personal assessment of the NEOs performance and overall contribution to the achievement of our short-term and long-term objectives, the NEOs performance in relation to individual performance objectives established during the PMP, the NEOs experience, pay history, current salary versus market information, internal equity considerations and our overall company performance in making any decisions or recommendations, as applicable, regarding any changes to base salaries of the NEOs. There is no set formula or weighting assigned to these factors. Our CEO discussed his recommendations with our EVP HR and received approval from the board of directors to provide certain adjustments to the base salary of each other NEO, other than Mr. Monié, effective April 1, 2023.
Our CEOs salary is determined by the board of directors based on a review of his overall performance, market data on competitive compensation levels for CEOs prepared by our compensation consultant, proxy information for direct competitors, as well as our overall performance. Like with our other NEOs, there is no set formula or weighting assigned to these factors. The board of directors approved a merit increase to our CEOs base salary effective April 1, 2023.
The board of directors approved the following base salary increases effective April 1, 2023.
| Name |
Prior Base Salary |
2023 Base Salary (as of 4/1/23) |
% Base Salary Increase |
|||||||||
| Mr. Bay |
900,000 | 918,000 | 2 | % | ||||||||
| Mr. Zilis |
806,000 | 830,180 | 3 | % | ||||||||
| Mr. Monié (1) |
1,323,000 | 1,323,000 | 0 | % | ||||||||
| Mr. Aragone |
600,000 | 618,000 | 3 | % | ||||||||
| Mr. Sherman |
600,000 | 618,000 | 3 | % | ||||||||
| (1) | Mr. Moniés compensation through June 30, 2023 was governed by the terms of the Amended and Restated Monié Transition Agreement. On July 1, 2023, Mr. Moniés annual base salary was reduced to $300,000 under the terms of the Second Amended and Restated Monié Transition Agreement, and on December 30, 2023, his annual base salary was further reduced to $200,000 under the terms of the Third Amended and Restated Monié Transition Agreement, as described under Mr. Monié Transition Agreement below. |
2023 Annual Executive Incentive Program
Each NEO (other than Mr. Monié) has a cash incentive target, as a percentage of base salary, that has been approved by the board of directors, as set forth in the table below. The percentage approximates the median market practice of comparable positions based on the data from our comparator peer group (see Design Principles above).
|
Target EIP as % of Annual Base Salary |
Target MBO as % of Annual Base Salary |
Total Target Annual Incentive as % of Annual Base Salary |
||||||||||
| 2023 | 2023 | 2023 | ||||||||||
| Mr. Bay |
200 | % | 40 | % | 240 | % | ||||||
| Mr. Zilis |
100 | % | 20 | % | 120 | % | ||||||
| Mr. Monié (1) |
| | | |||||||||
191
Table of Contents
|
Target EIP as % of Annual Base Salary |
Target MBO as % of Annual Base Salary |
Total Target Annual Incentive as % of Annual Base Salary |
||||||||||
| 2023 | 2023 | 2023 | ||||||||||
| Mr. Aragone |
70 | % | 14 | % | 84 | % | ||||||
| Mr. Sherman |
70 | % | 14 | % | 84 | % | ||||||
| (1) | In connection with his appointment to Executive Chairman on January 1, 2022, Mr. Monié agreed that he would no longer be eligible for the EIP or MBO program. |
The CEO, in consultation with the CFO, recommended to the board of directors that non-GAAP EBITDAR be utilized to determine the level of funding of the EIP Pool for fiscal year 2023 under the EIP. The board of directors approved the selected metric and the specific non-GAAP EBITDAR values to fund the EIP Pool at threshold, target and maximum (with straight line interpolation for performance between threshold and target, and between target and maximum performance) as shown below. The EIP Pool would fund at target if the company achieved its planned non-GAAP EBITDAR for 2023 of $1,314.2 million. The MBO component of the annual incentive was capped at the target percentage and the subjective achievement between 0% and 100% was based on individual performance against pre-established personal objectives and the CEOs discretion for the NEOs other than for himself, and discretion of the board of directors for the CEO. The actual non-GAAP EBITDAR for Fiscal Year 2023(Successor) was $1,294.97 million, which resulted in 95.13% funding of the EIP Pool for the EIP in 2023.
2023 Achievement Against Established Financial Targets
| Funding Percentage (1) | ||||||||||||||||
| Operating Objective | Minimum (50% funding) |
Target (100% funding) |
Maximum (200%) funding |
Actual (95.13%) funding |
||||||||||||
| EBITDAR (in millions) |
$ | 1,117.0 | $ | 1,314.2 | $ | 1,642.7 | $ | 1,294.97 | ||||||||
| (1) | Performance achievement between the specified levels was interpolated on a straight-line basis; provided that the funding percentage was zero if actual performance was below 85% and was capped at 200% if actual performance was 125% of target. |
The CEO reviewed additional financial performance against pre-established factors (although none are assessed on a formulaic basis), such as progress with regard to this offering, as well as the NEOs individual performance against pre-established personal objectives, that were subjective in nature, to determine each NEOs share of the established EIP Pool. The board of directors reviewed and approved the CEOs individual performance against pre-established objectives to determine his share of the EIP Pool. Individual payments are capped at 200% of their target incentive and may be zero in the event that threshold performance objectives are not achieved.
Following the CEOs recommendation, the board of directors approved award payments for each NEO, other than Mr. Monié, under the EIP for fiscal year 2023 as follows:
| Target EIP + Award ($) |
Individual | |||||||||||||||
| EIP Pool |
EIP Achievement % |
MBO Achievement |
Actual EIP + MBO |
|||||||||||||
| Mr. Bay (1) |
2,192,548 | 95.13 | % | 99 | % | 2,099,914 | ||||||||||
| Mr. Zilis (2) |
989,061 | 95.13 | % | 96 | % | 942,329 | ||||||||||
| Mr. Aragone (2) |
515,392 | 95.13 | % | 96 | % | 491,040 | ||||||||||
| Mr. Sherman (2) |
515,392 | 95.13 | % | 96 | % | 491,040 | ||||||||||
| (1) | Mr. Bays EIP payment for fiscal year 2023 took into consideration our overall financial performance, the significant contributions to our growth including this filing and the transactions completed herein, and his |
192
Table of Contents
| execution on the following strategic objectives: the launch of Xvantage in thirteen key countries, the integration of multiple channel sales organizations into a single unified channel team in each market, and progress in achieving our ESG initiatives, including with respect to diversity, equity and inclusion. |
| (2) | The EIP payments for fiscal year 2023 to Messrs. Zilis, Aragone and Sherman took into consideration our overall financial performance, each such officers significant contributions to our performance including this filing and the transactions contemplated herein, and support of the channel integration, Xvantage and ESG initiatives. |
Outstanding Long-Term Cash Awards from Prior Years
When we became privately held in late 2016, the new board of directors continued the practice of having a long-term component of compensation by granting cash settled long-term-incentive grants through 2020 pursuant to which the recipients could earn a cash award equal to a specified value, subject to time-based and performance-based vesting requirements (Cash-Based LTI).
| | Performance-Vesting: The final payment to NEOs under this program was made in March 2023, with respect to the Cash- Based LTI award granted in 2020 to be measured with respect to non-GAAP Net Income performance during fiscal year 2022. Consistent with SEC guidance, because the payment was based on the fiscal year 2022 results, the Company considers these payments to be compensation for fiscal year 2022, and the values are not reflected in the Summary Compensation Table, which reports compensation earned in fiscal year 2023. |
| | Time-Vesting: As of the start of Fiscal Year 2023(Successor), Mr. Monié was the only NEO with awards outstanding under our time vesting Cash-Based LTI program, which provided for the payment of fixed cash awards on specified payment dates. The amounts paid to Mr. Monié under the Cash-Based LTI program in Fiscal Year 2023 (Successor) are included in the Summary Compensation Table and reflect the vesting of his final award under this program. |
Participation Plan
In July 2021, we adopted the Participation Plan to provide incentive compensation to certain key executives. Under the Participation Plan, participants are granted performance units, the value of which are related to our financial performance. In general, half of the performance units granted vest over a period of time specified in the applicable award agreement, typically in annual tranches over five years. Once vested, certain Qualifying Events (as defined below) are required to occur prior to the expiration date of the plan for any payment related to these performance units, with accelerated vesting in the event of certain change in control or public offering events, in each case, subject to the participants continued employment through the applicable vesting date. The other half of the units are payable to participants only upon the occurrence of certain Qualifying Events, and will terminate if a minimum return is not achieved (or, in certain instances, deemed achieved based on our then current valuation) upon the earliest to occur of a change in control, on such date following an IPO (as defined below) that Platinum has collectively sold or otherwise disposed of 75% of its shares of common stock of the Company for cash and the 30th day prior to the third anniversary of the IPO. Any payment to a participant under the time-based or performance-based performance units is conditioned on our reaching a minimum valuation at the time of a Qualifying Event or through a series of Qualifying Events. Grants to the NEOs, excluding Mr. Monié, were made under the Participation Plan in fiscal year 2021, and because the grants were made prior to January 1, 2023, they are not reflected in the Grants of Plan Based Awards table below.
The Participation Plan may be altered or amended by the board of directors of the Company at any time without obtaining the approval of the participants, provided that any such amendment that materially adversely affects the economic benefits intended to be made available to a participant under the Participation Plan with respect to the participants outstanding performance units may not be made without obtaining such participants consent. Unless sooner terminated, the Participation Plan and the awards granted under the plan will expire on its
193
Table of Contents
eight-year anniversary. Any payments due to a participant with respect to a Qualifying Event that occurs prior to the expiration or termination of the Participation Plan will continue to be made, notwithstanding such expiration or termination. All performance units will terminate upon the expiration or termination of the Participation Plan. Participants in the Participation Plan may be entitled to receive compensation for their vested units upon the occurrence of a Qualifying Event that occurs during the participants employment with us (unless otherwise provided in an award agreement, as described below) or during a short period following the participants death or disability.
The Participation Plan identifies two categories of Qualifying Events: (1) a Qualifying Sale Event, which is defined as a sale of (a) some or all of the stock of the Company by Platinum, including in connection with an IPO, or (b) all or substantially all of the assets of the Company, the proceeds of which sale are distributed to Platinum in a Qualifying Distribution Event (as defined below), and (2) a Qualifying Distribution Event, which is defined as a cash dividend to Platinum.
The amount payable to a participant under the Participation Plan will be equal to the Qualified Event Value (as defined below) less the Grant Value (as defined below) of the participants matured performance units. The grant value of the performance units granted to our NEOs on the date of grant was $1 per unit (the Grant Value). Upon a Qualifying Event, the Qualified Event Value of a performance unit will be determined pursuant to one of the following methods:
| | In the event of a Qualifying Sale Event, the quotient of (A) the net purchase price divided by (B) 3,987,000,000; |
| | In the event of a Qualifying Distribution Event, the quotient of (A) the amount of such dividend or distribution, net of any and all withholdings, divided by (B) 3,987,000,000; or |
| | If greater, an amount determined by the board of directors of the Company in good faith. |
In determining the Qualified Event Value, the board of directors of the Company will take into consideration the transaction costs and expenses incurred by the Company and its affiliates in connection with any Qualifying Event and may modify the calculations accordingly.
Payment to participants of any amounts due under the Participation Plan will be made in cash, provided that, in the event of a Qualifying Sale Event that involves consideration of publicly traded stock, payment may be made via a distribution of shares of such stock to participants in lieu of cash. Such stock issued to participants may contain certain commercially standard or other reasonable restrictions that are not more restrictive than the trading restrictions applicable to the securities received by Platinum in connection with such Qualifying Sale Event.
The Participation Plan award agreements with each of our NEOs provide that if the participants employment terminates for any reason other than a termination by us for Cause (as defined in the award agreement), subject to the participants execution of a customary general release of claims (the Release), the participant will remain a participant in the Participation Plan with respect to all of the participants time-based performance units that were matured on the participants employment termination date. If the participants employment is terminated by us without cause, by the participant for good reason (each, as defined in the award agreement) or due to the participants death or permanent disability, subject to the participants execution of the Release, the participants performance units that were not matured on the participants employment termination date will remain outstanding and eligible to mature upon the occurrence of a Qualifying Event within six (6) months following the participants employment termination date if, and to the extent that, such performance units would otherwise have matured if the participants employment had continued through the date of such Qualifying Event.
194
Table of Contents
As of the date of this prospectus, each NEO, other than Mr. Monié, held the following performance units under the Participation Plan:
| Name |
Date of Grant | Maturity Start Date |
Number of Units |
Initial Grant Value | ||||||||||||
| Mr. Bay |
July 31, 2021 | July 2, 2021 | 26,339,916 | $ | 1.00 | |||||||||||
| Mr. Zilis |
July 31, 2021 | July 2, 2021 | 19,769,201 | $ | 1.00 | |||||||||||
| Mr. Aragone |
July 31, 2021 | July 2, 2021 | 12,837,143 | $ | 1.00 | |||||||||||
| Mr. Sherman |
July 31, 2021 | July 2, 2021 | 14,263,493 | $ | 1.00 | |||||||||||
In the event of an initial public offering of common stock by the Company or a transaction with a publicly traded special purpose acquisition company following which the common stock of the Company is listed on a national securities exchange (an IPO), for purposes of determining the timing of the payment of the amounts payable under the Participation Plan in connection with such IPO, Platinum will be deemed to have sold and received payment for the remainder of their unsold shares of common stock of the Company on the earlier of (i) the date on which Platinum has collectively sold or otherwise disposed of 75% of its shares of common stock of the Company for cash and (ii) the 30th day prior to the third anniversary of the IPO.
We intend to terminate the Participation Plan and all awards under the plan in connection with this offering.
Mr. Monié Transition Agreement
In connection with the transition of Mr. Monié from CEO of Ingram Micro to Executive Chairman of Ingram Micro as of January 1, 2022 and his expected retirement following the completion of an initial public offering or certain similar transactions, Mr. Monié and Ingram Micro entered into a transition agreement which has since been amended and restated three times, as described below.
The agreement, entered into on October 2, 2021 (the Original Monié Transition Agreement), generally set forth the terms and conditions of his transition and retirement. Effective June 24, 2022, Mr. Monié and Ingram Micro entered into the Amended and Restated Monié Transition Agreement (amending and restating the Original Monié Transition Agreement), which continued many of the terms and conditions from the Original Monié Transition Agreement and extended the termination date to the earlier of July 1, 2023 or the date of an initial public offering or certain similar transactions (or a later date in 2023 as may be mutually agreed upon by him and Ingram Micro). Under the terms of the Original Monié Transition Agreement, as amended and restated in the Amended and Restated Monié Transition Agreement, while employed as Executive Chairman, Mr. Monié would continue to receive a base salary (initially, $1,323,000 per year) and the same benefits as he received as CEO, provided that following his transition he (i) would no longer be eligible to receive any payments under our EIP and MBO programs or any other cash incentive programs of the Company in respect of any calendar year after 2021, and (ii) has foregone any rights under the CIC Plan (as defined below). In lieu of his rights under the CIC Plan, Mr. Monié is eligible to receive the following retirement payments and benefits:
| | Mr. Moniés termination of employment for any reason would be treated as a Retirement (as defined in the Cash-Based LTI award agreements) for purposes of his outstanding Cash-Based LTI awards and such Cash-Based LTI awards would remain outstanding and be paid in accordance with their terms; and |
| | in the event that an initial public offering or certain similar transactions occur prior to Mr. Moniés retirement date, Mr. Monié will be granted vested shares of common stock of Ingram Micro, its parent entity or its successor (the IPO Grant) in an amount equal to the IPO Grant Amount (as described below), provided that (x) his employment is not terminated by Ingram Micro for cause or by him without good reason, in each case, prior to the grant date and (y) he is required to pay to Ingram Micro the amount of the associated portion of withholding taxes required in connection with the grant. The IPO Grant Amount would have been equal to $9,166,666.66 less the product of $833,333.33 and |
195
Table of Contents
| the number of full months that had elapsed in 2023 with the final amount rounded to the nearest whole dollar if the initial public offering or other qualifying transaction had occurred on or before December 31, 2023. |
Any payments made to Mr. Monié pursuant to the Amended and Restated Monié Transition Agreement and the Original Monié Transition Agreement during Fiscal Year 2023 (Successor) are included in the Summary Compensation Table for Fiscal Year 2023 (Successor).
On June 30, 2023, Mr. Monié and Ingram Micro entered into the Second Amended and Restated Monié Transition Agreement (amending and restating the Amended and Restated Monié Transition Agreement), effective as of July 1, 2023. The Second Amended and Restated Monié Transition Agreement provided that (i) Mr. Moniés expected retirement date will be December 31, 2023, or, if earlier, on the day after the grant date of the IPO Grant described above, and (ii) that Mr. Moniés base salary from July 1, 2023, through his retirement date, would be $300,000 (on an annualized basis). No other changes were made to the terms of Mr. Moniés employment under the Second Amended and Restated Monié Transition Agreement.
On December 20, 2023, Mr. Monié and Ingram Micro entered into the Third Amended and Restated Monié Transition Agreement (amending and restating the Second Amended and Restated Monié Transition Agreement), effective as of December 30, 2023. The Third Amended and Restated Monié Transition Agreement provided that (i) Mr. Moniés expected retirement date will be December 31, 2024, or, if earlier, on the day after the grant date of an IPO Grant that was amended to have a value equal to approximately $2,000,000, in the event an initial public offering or similar transaction occurs prior to Mr. Moniés retirement date, and (ii) that Mr. Moniés base salary from December 30, 2023, through his retirement date, would be $200,000 (on an annualized basis). No other changes were made to the terms of Mr. Moniés employment under the Third Amended and Restated Monié Transition Agreement.
Compensation Recovery Policies
In connection with this offering, we intend to adopt the Policy for the Recovery of Erroneously Award Compensation (the Required Clawback Policy), a policy intended to be compliant with the applicable SEC and NYSE rules relating to the recoupment of incentive compensation. The Required Clawback Policy describes the circumstances in which current and former executive officers of the Company will be required to repay or return to the Company erroneously awarded compensation. In general, as provided in the policy, such circumstances include an accounting restatement that results in an executive officer having received more incentive compensation during the three completed fiscal years preceding the date of the accounting restatement than would have been received had such compensation been determined based on the restated amounts.
In addition to the Required Clawback Policy, we continue to maintain the Compensation Recovery Policy (the Discretionary Clawback Policy), last revised in 2017, that is applicable to our NEOs as well as other key executives (each, a Covered Employee). The Discretionary Clawback Policy authorizes the board of directors, in its sole discretion, to recover incentive compensation earned and received or realized in the 36 months preceding the date that a recoverable event (as defined in the policy to include a Covered Employees engagement in certain conduct that is detrimental to us or the calculation, grant, vesting and/or payment of any incentive compensation that is based on materially inaccurate financial results or performance metric criteria) is determined to have occurred. To date we have not had a recoverable event under the Discretionary Clawback Policy.
The board of directors believes that it is in the best interests of the Company and its stockholders to maintain the Discretionary Clawback Policy in addition to the Required Clawback Policy.
Benefits
We do not use benefit programs or perquisites as a primary compensatory element or as an enhancement to executive officer compensation. In general, our executive officers participate in our broad-based health and
196
Table of Contents
welfare, life insurance, disability and retirement programs on the same basis as our management associates. In addition, in 2023, the costs associated with Mr. Bays and Mr. Ziliss spouses travel and required attendance at business events were covered by the Company.
We offer participation in the Ingram Micro 401(k) Plan (the 401(k) Plan) with Company matching contributions as the only qualified retirement program in the United States. In addition, we offer certain U.S. highly compensated associates, including the NEOs based in the U.S., an opportunity to participate on a voluntary basis in our Supplemental Investment Savings Plan (the Supplemental Plan), a nonqualified deferred compensation arrangement. In general, the Supplemental Plan operates to restore 401(k) Plan benefits, including Company matching contributions, which were reduced or limited by the Internal Revenue Code of 1986, as amended (the Code). Participants in both the 401(k) Plan and the Supplemental Plan may elect to defer a total of up to 50% of their base salary and annual bonus. In 2023, our matching contribution was equal to 50% of the first 5% of eligible compensation deferred under the 401(k) Plan and the Supplemental Plan.
Change in Control and Termination of Employment Arrangements
Change in Control Plan
We maintain an Executive Change in Control Severance Plan (CIC Plan). We have determined that this plan will assist us in retaining and motivating our key executives. The CIC Plan, which provides double-trigger severance benefits, endeavors to continue providing our eligible officers with reasonable financial security in their employment and position with us, without distraction from uncertainties regarding their employment created by the possibility of a potential or actual change in control. Each of our CEO and the other NEOs (excluding Mr. Monié) participates in the CIC Plan.
In the event the participants employment is terminated by us without cause or by the participant for good reason, (each, as defined in the CIC Plan) in each case within six months prior to or 24 months following our change in control, subject to the participants execution of a release and restrictive covenant agreement satisfactory to us, the CIC Plan provides for certain severance benefits. Specifically, the participant will be eligible for the following: a lump-sum cash payment of a specified multiple (2.5 times for our CEO and 2.0 times for all other participants) multiplied by the sum of the participants base salary and target annual bonus; a prorated target annual bonus for the year in which the qualifying termination occurs; immediate vesting and payment of outstanding time-based long-term incentive awards, with outstanding performance-based long-term incentive awards vesting at the target value; a lump-sum payment equal to the annualized cost of the premiums required for the continuation of employer-sponsored medical, dental and vision insurance benefits for 12 months; and outplacement benefits of up to $50,000.
A summary of the terms and conditions of the CIC Plan, including a detailed description of the severance benefits and estimated values of these benefits, is set forth under Potential Payments Upon Termination or Change in Control below. The CIC Plan does not provide for any tax gross-up to participants.
Executive Officer Severance Policy
We also maintain an Executive Officer Severance Policy (the Severance Policy), which applies to our CEO and certain other executive officers elected by the board of directors (which includes all of the NEOs other than Mr. Monié) and which endeavors to continue providing our eligible officers with reasonable financial security in their employment and position with us, without distraction from uncertainties regarding their employment created by the possibility of a termination of employment without cause. Under the terms of the Severance Policy, eligible executive officers are entitled to severance benefits if their employment is terminated by us without cause (as defined in the Severance Policy) outside of the change-in-control context and if certain other conditions are satisfied. In such cases, subject to the execution of a release and restrictive covenant agreement satisfactory to us, eligible executive officers will be entitled to the severance benefits described in
197
Table of Contents
Potential Payments on Termination or Change in Control below. Pursuant to the Severance Policy, if an executive officer receives any severance payments or other benefits under the Severance Policy and we subsequently determine that the executive officer had engaged in conduct which constituted cause for the termination of such executive officers employment by us, the executive officer is obligated to reimburse us for all payments and the value of all benefits received by the executive officer which would not have been received if the executive officers employment had been terminated by us for cause, including interest.
Management periodically reviews both the Severance Policy and the CIC Plan to ensure they are providing appropriate protections compared to the estimated costs. Management anticipates our future board of directors will initiate a review of these policies in the year following becoming a publicly traded company.
Internal Revenue Code Section 162(m) Policy
Under Code Section 162(m), a publicly held corporation cannot take a federal income tax deduction for compensation exceeding $1 million per person in any taxable year for its chief executive officer, chief financial officer and other three most highly compensated executive officers (each, a Covered Person). In addition, once an individual becomes a Covered Person for any taxable year, that individual will remain a Covered Person for all future years, including following any termination of employment.
While our board of directors will consider the anticipated tax treatment to us and our executive officers as one factor when reviewing our executive compensation and other compensation programs, our board of directors will also look at other factors in making its decisions, as noted above, and retains full authority to approve compensation arrangements for our executive officers that are not fully deductible under Section 162(m) when it believes that other considerations outweigh the tax deductibility of the compensation.
2024 Stock Incentive Plan
In connection with this offering, our board of directors adopted, and our stockholders approved, the 2024 Plan. The 2024 Plan will have the features described below. The purpose of the 2024 Plan is to assist the Company in attracting, retaining, motivating, and rewarding certain employees, officers, and directors of the Company and its affiliates and promoting the creation of long-term value for stockholders of the Company by closely aligning the interests of such individuals with those of the stockholders.
The total number of shares of our common stock available for issuance pursuant to awards under the 2024 Plan will equal 20,347,826. The number of shares of common stock available for issuance under the 2024 Plan will be subject to adjustment as provided in the plan. Any of our employees and directors of our subsidiaries or affiliates will be eligible to receive an award under the 2024 Plan, to the extent that an offer of such award is permitted by applicable law, stock market or exchange rules, and regulations or accounting or tax rules and regulations.
The 2024 Plan will provide for the grant of non-qualified stock options, restricted stock, restricted stock units, other stock-based awards, or any combination thereof.
RSU and PSU Grants Under the 2024 Stock Incentive Plan
In connection with this offering, our board of directors intends to approve the grant of Restricted Stock Units (RSUs) and Performance Restricted Stock Units (PSUs) to certain employees, including our named executive officers. The RSUs and PSUs will be granted in connection with this offering. A portion of the RSUs granted to our named executive officers will vest on the first trading day following the effective date of this registration statement and the remaining RSUs will vest over a three (3) year period subject to the executives continuous service with us, or, if earlier, upon the achievement of specified returns on invested capital by
198
Table of Contents
Platinum. One-half of the PSUs will vest upon a qualifying event, whereby the return on invested capital achieved by Platinum is two times the total of all capital or other contributions made by Platinum and the remaining one-half will vest upon a qualifying event whereby the return on invested capital achieved by Platinum is two and one-half times the total of all capital or other contributions made by Platinum, in each case, except in certain circumstances as specified in the award agreement, subject to the executives continuous service with us through such qualifying event. Any such RSUs and PSUs so granted shall be subject to the terms of the lock-up agreement as further described herein. For these purposes, a qualifying event means either : (1) a Qualifying Sale Event, which is generally defined as a sale of (a) some or all of the stock of the Company by Platinum, including in connection with an IPO (but excluding a sale of stock by the Company), or (b) all or substantially all of the assets of the Company, the proceeds of which sale are distributed to our shareholders (including Platinum) in a Qualifying Distribution Event (as defined below), and (2) a Qualifying Distribution Event, which is generally defined as a cash dividend to our shareholders. The following table sets forth information concerning these grants of RSUs and PSUs, assuming an initial public offering price of $21.50 per share, which is the midpoint of the estimated offering price range set forth on the cover page of this prospectus. Any increase or decrease in the actual initial public offering price will impact the number of shares subject to RSUs and PSUs that we intend to grant.
| Name |
Number of shares underlying RSUs Assuming Midpoint Offering Price |
Number of shares underlying PSUs Assuming Midpoint Offering Price |
||
| Paul Bay | 355,356 | 355,356 | ||
| Michael Zilis | 266,710 | 266,710 | ||
| Augusto Aragone | 173,188 | 173,188 | ||
| Scott Sherman | 192,430 | 192,431 |
Other than with respect to the IPO Grant Amount to Mr. Monié discussed above, and grants to be made to our non-employee directors discussed below, no other determinations have been made as to the types or amounts of awards that will be granted to specific individuals under the 2024 Plan. Each award, if and when made, will be set forth in a separate grant notice or agreement and will indicate the type and terms and conditions of the award.
Summary Compensation Table
The following table sets forth information concerning the total compensation earned or paid to our NEOs for services rendered to us during Fiscal Year 2023 (Successor).
| Name and Principal Position |
Year |
Salary ($) |
Bonus ($)(1) |
Non-Equity Incentive Plan Compensation ($)(2) |
All Other Compensation ($)(3) |
Total ($) |
||||||||||||||||||
| Paul Bay Chief Executive Officer |
2023 | 913,562 | | 2,099,914 | 39,267 | 3,052,743 | ||||||||||||||||||
| Michael Zilis Chief Financial Officer |
2023 | 824,218 | | 942,329 | 39,519 | 1,806,065 | ||||||||||||||||||
| Alain Monié Executive Chairman |
2023 | 811,500 | 1,800,000 | | 20,779 | 2,632,279 | ||||||||||||||||||
| Augusto Aragone Executive Vice President, Secretary & General Counsel |
2023 | 613,562 | | 491,040 | 21,271 | 1,125,873 | ||||||||||||||||||
| Scott Sherman Executive Vice President, Human Resources |
2023 | 613,562 | | 491,040 | 20,838 | 1,125,440 | ||||||||||||||||||
| (1) | This column includes the time-vested Cash Based LTI award held by Mr. Monié that vested and was paid to Mr. Monié in January 2023. |
199
Table of Contents
| (2) | This column represents the payment of the EIP for fiscal year 2023 (including the MBO portion). |
| (3) | The amounts in this column are itemized in the following All Other Compensation Table Fiscal Year 2023(Successor): |
All Other Compensation Table Fiscal Year 2023 (Successor)
|
Employer Contributions to the 401(k) Plan ($) |
Employer Contributions to the Supplemental Plan ($) |
Other ($) (A) |
Total (as disclosed in the All Other Compensation column) ($) |
|||||||||||||
| Mr. Bay |
8,250 | 18,935 | 12,082 | 39,267 | ||||||||||||
| Mr. Zilis |
8,250 | 18,073 | 13,196 | 39,519 | ||||||||||||
| Mr. Monié |
6,416 | 14,363 | | 20,779 | ||||||||||||
| Mr. Aragone |
8,250 | 13,021 | | 21,271 | ||||||||||||
| Mr. Sherman |
8,250 | 12,588 | | 20,838 | ||||||||||||
| (A) | Represents executive perquisites and benefits exceeding $10,000 in the aggregate per executive, consisting of (i) the incremental cost to the company of the executives spouses travel to and required attendance at business events ($9,567 for Mr. Bay and $8,959 for Mr. Zilis), (ii) executive physical examinations ($2,000 for Mr. Bay and $3,721 for Mr. Zilis), and (iii) $515 in long-term disability insurance premiums. |
Grants of Plan-Based Awards Table
| Plan Name | Estimated Future Payouts Under Non-Equity Incentive Plan Awards (1) |
|||||||||||||
| Name |
Threshold ($) |
Target ($) |
Maximum ($) |
|||||||||||
| Paul Bay |
Executive Incentive Program | 913,562 | 2,192,548 | 4,019,671 | ||||||||||
| Michael Zilis |
Executive Incentive Program | 412,109 | 989,061 | 1,813,279 | ||||||||||
| Augusto Aragone |
Executive Incentive Program | 214,747 | 515,392 | 944,885 | ||||||||||
| Scott Sherman |
Executive Incentive Program | 214,747 | 515,392 | 944,885 | ||||||||||
| (1) | Represents incentive awards under the EIP for fiscal year 2023. The actual 2023 incentive awards earned by Messrs. Bay, Zilis, Sherman and Aragone are disclosed in the Summary Compensation Table under the Non-Equity Incentive Plan Compensation column. See the discussion above under Compensation Discussion and AnalysisHow Designed and DeterminedAnnual Executive Incentive Program. |
Narrative Disclosure Relating to Summary Compensation Table and Grants of Plan Based Awards Table
The material terms of the agreements and arrangements relating to the information disclosed in the Summary Compensation table and the Grant of Plan Based Awards table are included in our Compensation Discussion & Analysis above.
200
Table of Contents
Nonqualified Deferred Compensation
The following table provides information relating to nonqualified deferred compensation balances and contributions by the NEOs for the period indicated.
| Name |
Name of Plan | Executive Contributions in Fiscal Year 2023 (Successor) ($) |
Registrant Contributions in Fiscal Year 2023 (Successor) ($) (1) |
Aggregate Earnings in Fiscal Year 2023 (Successor) ($) |
Aggregate Withdrawals/ Distributions in Fiscal Year 2023 (Successor) ($)(3)(4) |
Aggregate Balance at End of Fiscal Year 2023 (Successor) ($) |
||||||||||||||||
| Paul Bay |
Supplemental Plan | 413,515 | 18,935 | 484,189 | | 2,696,562 | ||||||||||||||||
| Michael Zilis |
Supplemental Plan | 1,162,392 | 18,073 | 924,508 | | 6,198,754 | ||||||||||||||||
| Alain Monié |
Supplemental Plan | 41,559 | 14,363 | 562,357 | | 11,710,266 | ||||||||||||||||
| Cash Based LTI(2) | 1,800,000 | 0 | ||||||||||||||||||||
| Augusto Aragone |
Supplemental Plan | 302,769 | 13,021 | 161,657 | 1,308 | 1,366,376 | ||||||||||||||||
| Scott Sherman |
Supplemental Plan | 30,658 | 12,588 | 42,970 | 53,865 | 243,411 | ||||||||||||||||
| (1) | Executive officers who are paid on the U.S. payroll may voluntarily participate in the Supplemental Plan. The Supplemental Plan, in general, allows executives to reduce their taxable compensation in the year earned and operates to restore 401(k) Plan benefits, including Company matching contributions, which were reduced or limited by the Code. Under the terms of the Supplemental Plan, participants may elect to defer up to a combined 50% of their base salary and annual bonus between the Supplemental Plan and the 401(k) Plan. In conformance with Section 409A of the Code, deferral and distribution elections are made by each participant prior to the beginning of each calendar year for deferrals from base salary earned and paid during such calendar year and deferrals from bonus amounts earned during such calendar year but paid in the following calendar year. Executive contributions for 2023 include deferrals from base salary in respect of Fiscal Year 2023 (Successor) (reported in the Salary column of the Summary Compensation Table) and may also include bonus amounts earned in 2022 but paid in 2023 (which are not reported in the Non-Equity Incentive Plan Compensation column of the Summary Compensation Table included in this registration statement since such amounts relate to performance in 2022). We typically provide an employer match on behalf of the participants who make Supplemental Plan deferrals for the applicable year and remain employed through the last day of the year to restore the company match the Code limits in the 401(k) Plan. For the 2023 plan year, we made an employer match in the first quarter of 2024 equal to 50% of the deferrals up to 5% of eligible compensation, reduced by the 2023 employer matching contributions to the 401(k) Plan (such amounts reported in the All Other Compensation column of the Summary Compensation Table). Participants have earnings or losses credited to their Supplemental Plan account as a result of their selection from the various investment options available to them in this plan. Participants may redirect their investment in the various investment fund options on a daily basis. Account balances are disbursed to participants upon their termination of employment or such other fixed date as elected by the participant, based on the participants election prior to the year of deferral. Participants may elect to receive their account balance as a lump-sum cash payment or in installment payments over 5, 10 or 15 years. Executive contributions are not separately shown in the Summary Compensation Table but instead are deferrals from individuals salary and/or bonus amount shown in the Summary Compensation Table. |
| (2) | The value of the Cash-Based LTI awards was fixed up front, and subject to time-based vesting. Mr. Monié meets the definition of Retirement eligible under the respective awards, and therefore was eligible to retain his Cash-Based LTI awards following a termination of his employment for any reason other than cause and would receive the amounts payable under such awards in accordance with the payment schedules set forth in each award agreement. For additional information regarding our Cash-Based LTI awards, please see Compensation Discussion and AnalysisHow Designed and DeterminedOutstanding Long-Term Cash Awards from Prior YearsTime Vesting above. |
| (3) | Payments made in respect of the Cash-Based LTI awards are reported in the Bonus column of the Summary Compensation Table. |
| (4) | During 2023, under the Supplemental Plan, Messrs. Sherman and Aragone received lump sum distributions as noted in the table based on their initial deferral elections which provided for an in-service distribution. |
201
Table of Contents
Potential Payments Upon Termination or Change in Control
We maintain incentive programs, including award agreements, the Severance Policy and the CIC Plan which require that we provide payments and benefits to the NEOs (other than Mr. Monié) in the event of a qualifying termination of employment and/or a change in control.
The chart below describes the termination provisions of each incentive program and the award agreements, as well as any payments and benefits under the Severance Policy and the CIC Plan assuming the last date of employment for the NEO was the last business day of our fiscal year, December 29, 2023 (and therefore the cash incentive award would be considered earned) and/or that the change in control occurred on December 29, 2023, as applicable. NEOs had no outstanding Cash Based Long-Term Incentives as of December 29, 2023.
| Short-Term Incentive Cash (1) |
Participation Plan (2) |
Severance Pay and Benefits (Under Severance Policy or CIC Plan) (3) |
||||
| Change in Control (CIC) (No Termination) | None | A CIC is a Qualifying Event under the terms of the Participation Plan. Outstanding time-based performance units will become fully vested and payable in cash or, if the transaction involves consideration in publicly traded shares, in shares. Outstanding performance-based performance units will vest, if at all, according to the performance valuation calculation. | None | |||
| Qualifying Termination in Connection with a CIC | None; see treatment under CIC Plan column. | A CIC is a Qualifying Event under the terms of the Participation Plan. Outstanding time-based performance units will become fully vested and payable in cash or, if the transaction involves consideration in publicly traded shares, in shares. Outstanding performance-based performance units will vest, if at all, according to the performance valuation calculation. | We will pay or provide (A) a lump sum payment equal to 2.5 times for the CEO (or 2 times for the other NEOs and EVPs (except Mr. Monié): the sum of (i) the participants annual base salary and (ii) target annual bonus, (B) a lump sum payment equal to the prorated target annual bonus for the year of termination, (C) a lump sum payment equal to 12 months of 100% of the premium costs for employer- sponsored medical, dental and vision insurance benefits in effect on the date of termination, and (D) participation in an outplacement program until the earlier of (i) the end of the year following the year of termination and (ii) the participants subsequent full-time employment, subject to a maximum cost of $50,000. | |||
202
Table of Contents
| Short-Term Incentive Cash (1) |
Participation Plan (2) |
Severance Pay and Benefits (Under Severance Policy or CIC Plan) (3) |
||||
| Termination for Cause | None | None | None | |||
| Voluntary Termination | Any earned payment based on actual 2023 performance under the terms of the EIP. |
Time-based performance units that have matured on or prior to the termination date will remain eligible for future payment. | None | |||
| Involuntary Not for Cause Termination (not under CIC) |
None; see treatment under Severance Pay and Benefits column. | Time-based performance units that have matured on or prior to the termination date will remain eligible for future payment, and all remaining performance units will remain outstanding and eligible to mature upon the occurrence of a Qualifying Event for 6 months following the termination date, to the extent such units would have otherwise matured had employment continued. | We will pay or provide (A) a lump sum payment equal to the prorated annual bonus for the year of termination based on actual company performance, (B) a lump sum payment equal to the sum of the participants monthly annual base salary and target monthly bonus in effect on the termination date multiplied by total number of years of continuous service (with a minimum of 12 and capped at 24 for the CEO and 18 for all other NEOs), (C) a | |||
| lump sum payment equal to total number of years of continuous service (with a minimum of 12 months and capped at 18 months) of 100% of the premium costs for employer- sponsored medical, dental and vision insurance benefits in effect on the termination date, and (D) participation in an outplacement program until the earlier of the participants subsequent full-time employment or 12 months following the termination date, subject to a maximum cost of $20,000. | ||||||
203
Table of Contents
| Short-Term Incentive Cash (1) |
Participation Plan (2) |
Severance Pay and Benefits (Under Severance Policy or CIC Plan) (3) |
||||
| Death or Disability | Any earned payment based on actual 2023 performance under the terms of the EIP. | Time-based performance units that have matured on or prior to the termination date will remain eligible for future payment, and all remaining performance units will remain outstanding and eligible to mature upon the occurrence of a Qualifying Event for 6 months following the termination date, to the extent such units would have otherwise matured had employment continued. | None | |||
| Voluntary Termination for Good Reason (not under CIC) | Any earned payment based on actual 2023 performance under the terms of the EIP. | Time-based performance units that have matured on or prior to the termination date will remain eligible for future payment, and all remaining performance units will remain outstanding and eligible to mature upon the occurrence of a Qualifying Event for 6 months following the termination date, to the extent such units would have otherwise matured had employment continued. | None | |||
| (1) | Payment to be calculated and paid on the same basis and at the same time as the annual bonus payments to actively employed executives under the EIP. Our EIP generally provides that if a participant remains employed through the last date of the program year (which ended on December 29, 2023, the business day preceding the last day of our fiscal year 2023) and experiences a termination of employment following the expiration of the program year but before the payment date of the bonus for such period, other than in the event of a termination of employment by the company for cause, the participant will remain eligible to receive the bonus for the completed program year based on actual performance. In addition, the NEOs are eligible for benefits under the Severance Policy and CIC Plan, as applicable, which likewise provide for the payment of prorated bonuses for the year in which termination occurs, as reflected in the table above. Both the Severance Policy and CIC Plan note that in no event will such policy or plan result in the duplication of payments or benefits provided to an NEO. Accordingly, the table above reflects that upon any termination without cause, the annual bonuses payable to our NEOs for the year in which such termination occurs would be paid pursuant to the terms of the Severance Policy or CIC Plan, as applicable. |
| (2) | Payments made under the Participation Plan related to termination are subject to the participants execution of a release of claims and restrictive covenant agreement. |
| (3) | Severance benefits provided under the Severance Policy and the CIC Plan are subject to the participants execution of a release of claims and restrictive covenant agreement and are payable in a lump sum cash payment. |
Mr. Monié has entered into a transition agreement, the material terms of which have been summarized above under Compensation Discussion and Analysis Mr. Monié Transition Agreement. Following a termination of employment, Mr. Monié remains eligible to receive his IPO Grant (as described above), which will have a value of $2 million if made, unless his employment is terminated by the Company for cause or
204
Table of Contents
Mr. Monié resigns without good reason, subject to and conditioned upon the occurrence of the relevant transaction within the specified period. The table below reflects that Mr. Monié would not be eligible for any payments of compensation and benefits upon a termination of employment effective as of December 29, 2023 pursuant to his transition agreement.
Payments Upon Termination Table
For purposes of this analysis, we assumed:
| a. | the last date of employment for the NEO is the last business day of our last fiscal year, December 29, 2023; |
| b. | annual base salary at termination is equal to salary as of December 29, 2023; and |
| c. | annual target incentive at termination is equal to target incentive as of December 29, 2023. |
Based on these assumptions, the amount of compensation payable to each NEO in each potential situation is listed in the table below. Performance units granted pursuant to our Participation Plan had no value as of December 29, 2023 and therefore are not included in the table below.
|
Short- Term Incentive ($)(1) |
Severance Pay ($) |
Health Premiums ($) |
Outplacement ($) |
Total ($) | ||||||||||||||||
| Paul Bay |
||||||||||||||||||||
| CIC Termination |
2,203,200 | 7,803,000 | 19,379 | 50,000 | 10,075,579 | |||||||||||||||
| Voluntary Termination (with or without Good Reason) |
2,099,914 | | 2,099,914 | |||||||||||||||||
| Involuntary Not for Cause Termination |
2,099,914 | 3,381,300 | 20,994 | 20,000 | 5,522,208 | |||||||||||||||
| Death/Disability |
2,099,914 | | 2,099,914 | |||||||||||||||||
| Michael Zilis |
||||||||||||||||||||
| CIC Termination |
996,216 | 3,652,792 | 15,786 | 50,000 | 4,714,794 | |||||||||||||||
| Voluntary Termination (with or without Good Reason) |
942,329 | 942,329 | ||||||||||||||||||
| Involuntary Not for Cause Termination |
942,329 | 2,587,394 | 22,363 | 20,000 | 3,572,086 | |||||||||||||||
| Death/Disability |
942,329 | 942,329 | ||||||||||||||||||
| Alain Monié (2) |
||||||||||||||||||||
| Augusto Aragone |
||||||||||||||||||||
| CIC Termination |
519,120 | 2,274,240 | 27,516 | 50,000 | 2,870,876 | |||||||||||||||
| Voluntary Termination (with or without Good Reason) |
491,040 | 491,040 | ||||||||||||||||||
| Involuntary Not for Cause Termination |
491,040 | 1,421,400 | 34,395 | 20,000 | 1,966,835 | |||||||||||||||
| Death/Disability |
491,040 | 491,040 | ||||||||||||||||||
| Scott Sherman |
||||||||||||||||||||
| CIC Termination |
519,120 | 2,274,240 | 16,402 | 50,000 | 2,859,762 | |||||||||||||||
| Voluntary Termination (with or without Good Reason) |
491,040 | 491,040 | ||||||||||||||||||
| Involuntary Not for Cause Termination |
491,040 | 1,137,120 | 16,402 | 20,000 | 1,664,562 | |||||||||||||||
| Death/Disability |
491,040 | 491,040 | ||||||||||||||||||
| (1) | All scenarios show the actual EIP payment amounts for fiscal year 2023, except that CIC Terminations show the target EIP amounts calculated using each applicable participants annual base salary immediately preceding the date of termination. |
| (2) | Although not reflected in the table above because it does not necessarily relate to a change in control, the transition agreement with Mr. Monié provides that in the event that an initial public offering or certain |
205
Table of Contents
| similar transactions occurs within a specified period Mr. Monié would be granted vested shares of common stock of the Company with a value as specified in the transition agreement, and would remain eligible to receive such grant unless his employment is terminated by the Company without cause or he resigns without good reason prior to the date of grant. Mr. Monié is not eligible for any other payments with respect to the termination of his employment or the termination of the transition agreement as of December 29, 2023 for any reason. |
Director Compensation
In May 2023, we entered into an agreement with one of our non-employee director nominees, Felicia Alvaro. The agreement specified that details regarding director compensation and the terms of the nominees formal appointment to the board of directors would be provided at a later date. The agreement also provides that, subject to the nominees appointment to the board of directors, the nominee will receive a one-time grant of shares of our common stock (the Sign-On Grant) with a fair market value equal to the product of (x) $10,000 times (y) the number of full months between May 1, 2023, and the IPO, that will vest on the six (6) month anniversary of the Delivery Date (as defined below). The Sign-On Grant will be delivered on the tenth business day following the IPO (the Delivery Date) in the form of a number of restricted shares of common stock of the Company with a fair market value as of the Delivery Date equal to the aggregate value of the Sign-On Grant, with such fair market value determined based on the closing price of our common stock reported on the principal national securities exchange on which such shares are listed on the Delivery Date. No amounts have been paid to, or accrued with respect to, the nominee for her role on the board of directors with respect to Fiscal Year 2023 (Successor).
In connection with this offering, our board of directors approved a new non-employee director compensation policy that will become effective upon the execution and delivery of the underwriting agreement related to this offering and will be applicable to all of our non-employee directors. This compensation policy provides that each such non-employee director will receive the following compensation for service on our board of directors (other than any member of the board of directors affiliated with Platinum):
| | Annual cash retainer of $100,000 for each non-employee director; |
| | Additional cash retainer for the Chair of the audit committee of $35,000 for service as chairperson of the audit committee; |
| | An initial equity award in connection with this offering of restricted stock units with a grant date value of $185,000, vesting on the first anniversary of our offering; and |
| | An annual restricted stock unit award to be granted on the date of the Companys annual meeting of stockholders with a grant date value of $185,000, with all of the shares of our common stock subject to the award vesting on the earlier of either the date of the Companys next annual meeting of stockholders or the one-year anniversary of the date of the grant. |
We will also reimburse our directors for reasonable and necessary out-of-pocket expenses incurred in attending board and committee meetings or performing other services for us in their capacities as directors.
206
Table of Contents
CERTAIN RELATIONSHIPS AND RELATED PERSON TRANSACTIONS
In addition to the compensation arrangements, including employment, termination of employment and change of control arrangements and indemnification arrangements, discussed in the sections titled Management and Executive Compensation, the following is a description of each transaction since January 3, 2021 and each currently proposed transaction in which:
| | we or any of our subsidiaries have been or will be a participant; |
| | the amount involved exceeded or will exceed $120,000; and |
| | any of our directors, executive officers or beneficial holders of more than 5% of any class of our capital stock, or their affiliates, or any immediate family member of, or person sharing the household with, any of these individuals, had or will have a direct or indirect material interest. |
Related Party Transactions in Effect Prior to this Offering
Platinum Acquisition Agreement
The consummation of the Imola Mergers was effected through the Agreement and Plan of Merger, dated as of December 9, 2020 by and among Tianjin Tianhai Logistics Investment Management Co., Ltd., HNA Tech, GCL Investment Management, Inc., Ingram Micro, Imola Acquisition Corporation and Imola Merger Corporation.
Advisory Agreement
Following the consummation of the Imola Mergers, the Company (and/or one of its affiliates) and Platinum Advisors entered into the Advisory Agreement, pursuant to which the Company engaged Platinum Advisors as a financial, transactional and management consultant. Under the Advisory Agreement, the Company has agreed to pay Platinum Advisors an annual management fee in an amount to be mutually agreed between the parties and to reimburse Platinum Advisors for its out-of-pocket costs and expenses incurred in connection with its services under the agreement. In 2023, the aggregate management fee was $25 million.
The Advisory Agreement contains customary indemnification provisions in favor of Platinum Advisors and its affiliates, including Platinum. The Advisory Agreement will be terminated upon the consummation of this offering.
Loan to Officer
On October 8, 2021, we entered into a secured promissory note with Alain Monié, our Chief Executive Officer at the time, in the amount of $7,000,000 at an interest rate of 1.5% per annum, in connection with the purchase of 125 shares of Class B non-voting common stock of the Company (the Monié Purchased Shares). The loan was secured by a pledge of the Monié Purchased Shares. The loan was repaid prior to the filing of this registration statement.
Mr. Monié Transition Agreement
In connection with the transition of Mr. Monié from CEO of Ingram Micro to Executive Chairman of Ingram Micro as of January 1, 2022 and his expected retirement as of December 31, 2024 or, if earlier, on the day after the grant date of certain shares that will be granted following the occurrence of our initial public offering or certain similar transactions, Mr. Monié and Ingram Micro entered into a transition agreement, on October 2, 2021 (which has since been amended and restated three times, most recently effective as of December 30, 2023), which generally sets forth the terms and conditions of his transition and retirement. See Executive CompensationCompensation Discussion and AnalysisMr. Monié Transition Agreement.
207
Table of Contents
Share Purchases
Following the Imola Mergers, certain members of our management team, including our executive officers, were provided the opportunity to purchase shares of Class B non-voting common stock at a price equal to the fair market value of $100,000 per share.
| 2021 Share Purchases (Shares) | |||||
| Mr. Monié |
125.0 | ||||
| Mr. Zilis |
6.41250 | ||||
| Mr. Bay |
14.15625 | ||||
| Mr. Sherman |
7.74375 | ||||
| Mr. Aragone |
5.16250 | ||||
| Mr. Dave (1) |
7.74375 | ||||
| (1) | Nimesh Dave is our former Executive Vice President of Global Cloud. Mr. Dave ceased being an officer of the Company on January 12, 2022 and ceased being an employee on June 30, 2022. |
Dividend
On April 29, 2022, the Company declared and paid a dividend to our current stockholders, including Imola JV Holdings, L.P., the entity through which Platinum holds its investment in the Company, of approximately $1.75 billion, with proceeds from the primary closing of the CLS Sale, which occurred on April 4, 2022. Each of our executive officers who held shares of common stock participated in their pro-rata share of the dividend declared in connection with the CLS Sale.
Certain Relationships with Platinum
From time to time, Platinum and/or its affiliates have entered into, and may continue to enter into, arrangements with us to use our products and services. We believe that all such arrangements have been entered into in the ordinary course of business and have been negotiated on commercially reasonable terms.
Agreements to Be Entered into in Connection with this Offering
Investor Rights Agreement
In connection with this offering, we intend to enter into the Investor Rights Agreement with Platinum and prior to the consummation of this offering, our amended and restated certificate of incorporation will become effective. At each annual meeting of our stockholders (and in connection with any election by written consent or special meeting for the election of directors) for which Platinum has nominated an individual for election to our board of directors, (i) we will include each such nominee as a nominee for election as a director, (ii) we will use all reasonable best efforts to cause the election as a director of each such nominee including, to the fullest extent permitted by applicable law, soliciting proxies in favor of the election of such nominee and (iii) we will take all action within our power to cause each such nominee to be included as a nominee recommended by our board of directors to our stockholders for election as a director, unless our board of directors determines that making such recommendation would be inconsistent with the directors fiduciary duties under applicable law. The Investor Rights Agreement and our amended and restated certificate of incorporation will grant Imola JV Holdings, L.P. (the Platinum Stockholder) the right to nominate for election to our board of directors no fewer than that number of directors that would constitute: (i) a majority of the total number of directors so long as the Platinum Stockholder and Platinum collectively beneficially own at least 50% of the then-outstanding capital stock of the Company; (ii) 40% of the total number of directors so long as the Platinum Stockholder and Platinum collectively beneficially own at least 40% but less than 50% of the then-outstanding capital stock of the Company; (iii) 30% of the total number of directors so long as the Platinum Stockholder and Platinum collectively beneficially own at least 30% but less than 40% of the then-outstanding capital stock of the Company; (iv) 20% of the total number of directors so long as the Platinum Stockholder and Platinum
208
Table of Contents
collectively beneficially own at least 20% but less than 30% of the then-outstanding capital stock of the Company; and (v) 10% of the total number of directors so long as the Platinum Stockholder and Platinum collectively beneficially own at least 5% but less than 20% of the then-outstanding capital stock of the Company. For purposes of calculating the number of directors that the Platinum Stockholder will be entitled to nominate pursuant to the formula outlined above, any fractional amounts shall automatically be rounded up to the nearest whole number. Unless otherwise agreed by the Platinum Stockholder, for so long as the Platinum Stockholder retains the right to nominate a person to our board of directors, each committee of the board of directors will include at least one of the director candidates designated by the Platinum Stockholder, except to the extent such membership would violate applicable securities laws or stock exchange or stock market rules or where the sole purpose of such committee is to address actual or potential conflicts of interest between us and Platinum. In the event that (i) a vacancy is created at any time by the death, resignation, removal (with or without cause) or by any other cause of a Platinum Stockholder nominee and (ii) the number of directors nominated by the Platinum Stockholder is less than the number that the Platinum Stockholder is entitled to nominate under our amended and restated certificate of incorporation or the Investor Rights Agreement, then such vacancy may be filled only by the Platinum Stockholder unless otherwise agreed by the Platinum Stockholder.
The Investor Rights Agreement will also grant Platinum certain customary demand registration rights, as well as piggyback registration rights, with respect to shares of our Common Stock. See Description of Capital StockRegistration Rights. In addition, the Investor Rights Agreement will provide that if we retain Platinum Advisors to provide corporate and advisory services to us, then we will reimburse Platinum Advisors for all third party costs incurred in rendering such services and indemnify Platinum Advisors and its officers, directors, managers, employees, affiliates, agents and other representatives, to the fullest extent permitted by law, against all liabilities, costs and expenses incurred in connection with such services other than if and to the extent that such liabilities, costs and expenses arise as a result of the gross negligence, bad faith, fraud or willful misconduct of Platinum Advisors.
Indemnification Agreements
Prior to the completion of this offering, we expect to enter into indemnification agreements with each of our directors and officers. These agreements will require us to indemnify these individuals and, in certain cases, affiliates of such individuals, to the fullest extent permissible under Delaware law against liabilities that may arise by reason of their service to us or at our direction, and to advance expenses incurred as a result of any proceeding against them as to which they could be indemnified. Insofar as indemnification for liabilities arising under the Securities Act may be permitted to directors, we have been informed that in the opinion of the SEC such indemnification is against public policy and is therefore unenforceable.
Reserved Share Program
At our request, an affiliate of BofA Securities, Inc., a participating underwriter, has reserved for sale, at the initial public offering price, up to 5% of the shares of Common Stock offered by this prospectus for sale to some of our directors, officers and employees, as well as to certain employees of Platinum and/or Platinum Advisors. See UnderwritingReserved Share Program.
Related Party Transactions Policy
In connection with this offering, we have adopted a written policy with respect to the review, approval and ratification of related person transactions to assist our board of directors in reviewing and taking appropriate action concerning related person transactions and assist us in preparing the disclosure that the SEC rules require to be included in our applicable filings as required by the Securities Act and the Exchange Act and their related rules. This policy is intended to supplement, and not to supersede, our other policies that may be applicable to or involve transactions with related persons, such as our policies for determining director independence and our code of conduct and conflicts of interests policies. The policy covers any financial transaction, arrangement or
209
Table of Contents
relationship or any series of similar transactions, arrangements or relationships (including indebtedness and guarantees of indebtedness and transactions involving employment and similar relationships) involving the Company and any director, nominee or executive officer, or any immediate family member thereof, or any greater than 5% beneficial owner of our voting securities, in each case, having a direct or indirect material interest in such transaction. Any such transaction must be approved or ratified by our audit committee unless our board of directors in its discretion designates another independent body consisting solely of independent directors. The audit committee may only approve those transactions that are in, or are not inconsistent with, our best interests and those of our stockholders, as the audit committee determines in good faith.
210
Table of Contents
PRINCIPAL AND SELLING STOCKHOLDER
The following table sets forth, as of October 15, 2024, information regarding beneficial ownership of our capital stock, and, after giving effect to this offering of 11,600,000 shares of Common Stock by us and 7,000,000 shares of Common Stock by the selling stockholder, both assuming that (x) the underwriters do not elect to exercise their option to purchase additional shares of Common Stock (solely to cover over-allotments, if any) from the selling stockholder and (y) the underwriters exercise in full their option to purchase additional shares of Common Stock (solely to cover over-allotments, if any) from the selling stockholder in this offering, by:
| | each person, entity or group of affiliated persons, known by us to beneficially own more than 5% of our voting securities; |
| | each of our named executive officers; |
| | each of our directors and director nominees; |
| | all of our executive officers, directors and director nominees as a group; and |
| | the selling stockholder. |
To our knowledge, each person named in the table has sole voting and investment power with respect to all of the securities shown as beneficially owned by such person, except as otherwise set forth in the notes to the table. The number of securities shown represents the number of securities the person beneficially owns, as determined by the rules of the SEC. The SEC has defined beneficial ownership of a security to mean the possession, directly or indirectly, of voting power and/or investment power. A security holder is also deemed to be, as of any date, the beneficial owner of all securities that such security holder has the right to acquire within 60 days after that date through (1) the exercise of any option, warrant or right, (2) the conversion of a security, (3) the power to revoke a trust, discretionary account or similar arrangement or (4) the automatic termination of a trust, discretionary account or similar arrangement.
We have based our calculation of the percentage of beneficial ownership prior to the offering on 222,400,000 shares of Common Stock outstanding on October 15, 2024, after giving effect to the Offering Reorganization Transactions, which will occur prior to the consummation of this offering. We have based our calculation of the percentage of beneficial ownership after the offering of shares of our Common Stock outstanding immediately after the completion of this offering (assuming no exercise of the underwriters option to purchase additional shares of our Common Stock, solely to cover over-allotments, if any, from the selling stockholder). In addition, at our request, an affiliate of BofA Securities, Inc., a participating underwriter, has reserved for sale, at the initial public offering price, up to 5% of the shares of Common Stock offered by this prospectus for sale to some of our directors, officers and employees, as well as to certain employees of Platinum and/or Platinum Advisors through a reserved share program. The table below does not reflect any purchases by these potential purchasers. If any shares of Common Stock are purchased by our existing principal stockholders, directors, officers or their affiliated entities, the number and percentage of shares of our Common Stock beneficially owned by such persons after this offering will be higher than those set forth in the table below. See UnderwritingReserved Share Program.
211
Table of Contents
Unless otherwise noted below, the address for each of the stockholders in the table below is c/o Ingram Micro Holding Corporation, 3351 Michelson Drive, Suite 100, Irvine, CA 92612.
| Beneficial owner |
Shares before offering | Shares after offering (no option exercise) |
Shares after offering (full option exercise (3)) |
|||||||||||||||||||||
| Number | Percentage | Number | Percentage | Number | Percentage | |||||||||||||||||||
| 5% Stockholders: |
% | % | % | |||||||||||||||||||||
| Investment vehicles affiliated with Platinum Equity, LLC (1) |
220,742,854 | 99.3% | 213,742,854.00 | 90.8% | 210,952,854 | 89.6% | ||||||||||||||||||
| Named Executive Officers, Directors and Director Nominees: |
||||||||||||||||||||||||
| Augusto Aragone |
43,195 | 0.0% | 147,108 (2) | 0.1% | 147,108 (2) | 0.1% | ||||||||||||||||||
| Paul Bay |
118,448 | 0.1% | 331,662 (2) | 0.1% | 331,662 (2) | 0.1% | ||||||||||||||||||
| Alain Monié |
1,045,899 | 0.5% | 1,138,922 (2) | 0.5% | 1,138,922 (2) | 0.5% | ||||||||||||||||||
| Scott Sherman |
64,793 | 0.0% | 180,251 (2) | 0.1% | 180,251 (2) | 0.1% | ||||||||||||||||||
| Michael Zilis |
53,654 | 0.0% | 213,680 (2) | 0.1% | 213,680 (2) | 0.1% | ||||||||||||||||||
| Mary Ann Sigler |
| | | | | | ||||||||||||||||||
| Felicia Alvaro |
| | | | | | ||||||||||||||||||
| Craig W. Ashmore |
| | | | | | ||||||||||||||||||
| Christian Cook |
| | | | | | ||||||||||||||||||
| Jakki Haussler |
| | | | | | ||||||||||||||||||
| Leslie Heisz |
| | | | | | ||||||||||||||||||
| Bryan Kelln |
| | | | | | ||||||||||||||||||
| Jacob Kotzubei |
| | | | | | ||||||||||||||||||
| Matthew Louie |
| | | | | | ||||||||||||||||||
| Sharon Wienbar |
| | | | | | ||||||||||||||||||
| Eric Worley |
| | | | | | ||||||||||||||||||
| Named Executive Officers, Directors and Director Nominees as a group (individuals) |
1,325,989 | 0.6% | 2,011,623 | 0.9% | 2,011,623 | 0.9% | ||||||||||||||||||
| (1) | Imola JV Holdings, L.P. (the Platinum Stockholder or the selling stockholder) is the record holder of 220,742,854 shares of our Common Stock. Tom Gores is the manager of Platinum Equity, LLC, which is the sole member of Platinum Equity Investment Holdings, LLC, which is the sole member of Platinum Equity Investment Holdings IC (Cayman), LLC which is the general partner of Platinum Equity InvestCo, L.P., which is the sole member of Platinum Equity Investment Holdings V, LLC, which is the sole member of Platinum Equity Partners V, LLC, which is the general partner of Platinum Equity Partners V, L.P., which is the general partner of the Platinum Stockholder. By virtue of these relationships, each of these entities and Mr. Gores may be deemed to share beneficial ownership of the securities held of record by the Platinum Stockholder. The business address of each of the entities named herein and Mr. Gores is 360 North Crescent Drive, South Building, Beverly Hills, CA 90210. |
| (2) | Includes the number of shares of Common Stock issuable pursuant to the Initial Grants or Monié Grant that vest on the first trading day following the effective date of this registration statement (gross of any shares withheld to satisfy tax withholding obligations in connection with such vesting). |
| (3) | To the extent the underwriters option to purchase additional shares (solely to cover over-allotments, if any) is not exercised in full, the shares sold by the selling stockholder will be decreased. |
212
Table of Contents
DESCRIPTION OF MATERIAL INDEBTEDNESS
ABL Credit Facilities
On July 2, 2021, Ingram Micro entered into the ABL Revolving Credit Facility and the ABL Term Loan Facility. Letters of credit under the ABL Revolving Credit Facility are limited to the lesser of (a) $400 million and (b) the aggregate unused amount of commitments under the ABL Revolving Credit Facility then in effect. Loans under the ABL Credit Facilities are denominated, at its option, in U.S. dollars, Canadian dollars, Euros, Pounds Sterling, Australian dollars or other currencies to be agreed. JPMorgan Chase Bank, N.A. acts as administrative agent and collateral agent for the ABL Credit Facilities. Prior to the voluntary prepayment in full discussed below, the ABL Term Loan Facility would have matured on July 2, 2026. The ABL Revolving Credit Facility matures on September 20, 2029. A portion of the ABL Credit Facilities was drawn on July 2, 2021 to finance a portion of the Imola Mergers (and the related transactions) and the ABL Revolving Credit Facility may be drawn from time to time to fund working capital and for other general corporate purposes, including permitted acquisitions and other investments. As of June 29, 2024, there was $0 of borrowings outstanding and $3,500 million of unused commitments available under the ABL Revolving Credit Facility. See Capitalization.
Borrowings under the ABL Credit Facilities are limited by borrowing base calculations based on the sum of specified percentages of eligible accounts receivable, eligible inventory and unrestricted cash, minus the amount of any applicable reserves. Borrowings bear interest at a floating rate, which can be either (A) an adjusted forward-looking term rate based on SOFR (subject to a floor of 0.00%) plus (x) in the case of the ABL Revolving Credit Facility, a margin ranging from 1.25% to 1.75% (determined by reference to the average availability under the ABL Revolving Credit Facility) or (y) in the case of the ABL Term Loan Facility, 3.50%, or, at the companys option, (B) a base rate plus (x) in the case of the ABL Revolving Credit Facility, a margin ranging from 0.25% to 0.75% (determined by reference to the average availability under the ABL Revolving Credit Facility) or (y) in the case of the ABL Term Loan Facility, 2.50%. Ingram Micro may borrow on the ABL Revolving Credit Facility only up to the lesser of (i) the level of its then current borrowing base and (ii) the committed maximum borrowing capacity of $3,500 million plus the amount of loans outstanding under the ABL Term Loan Facility. Subject to certain conditions, the ABL Credit Facilities may be expanded by up to the greatest of (a) $1,000 million less any increases or incremental facilities established under the Term Loan Credit Facility in reliance on the Fixed Term Loan Incremental Amount which is the greater of $1,337 million and 100.0% of Consolidated EBITDA (as such term is defined in the Term Loan Credit Agreement), (b) 100.0% of four-quarter Consolidated EBITDA (as such term is defined in the ABL Credit Agreement) less any increases or incremental facilities established under the Term Loan Credit Facility in reliance on the Fixed Term Loan Incremental Amount and (c) the excess of the borrowing base over the sum of (i) the aggregate commitments of the ABL Revolving Credit Facility at such time plus (ii) the outstanding amount of loans under the ABL Term Loan Facility at such time, in additional commitments and loans. Ingram Micros ability to draw under the ABL Revolving Credit Facility or issue letters of credit thereunder is conditioned upon, among other things, its delivery of prior written notice of a borrowing or letter of credit request, as applicable, its ability to reaffirm the representations and warranties contained in the ABL Credit Agreement in all material respects and the absence of any default or event of default thereunder.
Ingram Micros obligations under the ABL Credit Facilities are guaranteed by Imola Acquisition Corporation, an investment vehicle of certain private investment funds sponsored and ultimately controlled by Platinum, Ingram Micro and all of Ingram Micros direct and indirect wholly owned U.S. subsidiaries (subject to certain permitted exceptions, including exceptions based on immateriality thresholds of aggregate assets and revenues of excluded U.S. subsidiaries), as well as certain of Ingram Micros direct and indirect wholly owned foreign subsidiaries organized in jurisdictions where borrowing base assets are located (subject to certain permitted exceptions). The ABL Credit Facilities are secured by a lien on substantially all of Imola Acquisition Corporations, Ingram Micros and each of Ingram Micros direct and indirect wholly owned U.S. subsidiaries current and fixed assets (subject to certain exceptions), as well as certain assets of certain of Ingram Micros direct and indirect wholly owned subsidiaries organized in foreign jurisdictions where borrowing base assets are located (subject to certain exceptions). The ABL Credit Facilities have a first-priority lien on all inventory,
213
Table of Contents
accounts receivable, tax refunds (other than accounts receivable and tax refunds relating to real estate, equipment, intellectual property and capital stock), cash, deposit accounts, securities accounts, investment property (other than capital stock and accounts solely to hold identifiable proceeds of Fixed Asset Collateral (as defined below)), certain related assets and, in each case, proceeds thereof that secure the obligations of the U.S. borrowers and U.S. guarantors (the Current Asset Collateral) and a lien (second in priority to the liens securing the 2029 Notes and the Term Loan Credit Facility discussed below) on (i) all real estate, equipment, intellectual property, equity interests in Ingram Micro or a subsidiary guarantor or its subsidiaries and all other assets other than Current Asset Collateral, and all supporting obligations, documents and books and records relating to any of the foregoing; and (ii) all substitutions, replacements, accessions, products or proceeds (including, without limitation, insurance proceeds) of any of the foregoing (Fixed Asset Collateral), excluding any fee-owned real property included in the Fixed Asset Collateral, in each case, subject to other permitted liens.
The following fees are applicable under the ABL Credit Facilities: (a) an unused line fee of (i) 0.375% per annum of the unused portion of the ABL Revolving Credit Facility (excluding any swingline loans) when the average unused portion of such facility is greater than 50% of the aggregate commitments under the ABL Revolving Credit Facility or (ii) 0.250% per annum of the unused portion of the ABL Revolving Credit Facility when the average unused portion of such facility (excluding any swingline loans) is less than or equal to 50% of the aggregate commitments under the ABL Revolving Credit Facility, (b) a letter of credit participation fee on the aggregate stated amount of each letter of credit equal to the applicable margin for adjusted Eurodollar rate loans, as applicable and (c) certain other customary fees and expenses of the lenders and agents thereunder. Subject to customary provisions for discretionary and protective overadvances, Ingram Micro is required to make prepayments under the ABL Credit Facilities at any time when, and to the extent that, the aggregate amount of the outstanding loans and letters of credit under the ABL Credit Facilities exceeds the lesser of (a) the aggregate amount of commitments in respect of the ABL Revolving Credit Facility plus the amount of loans outstanding under the ABL Term Loan Facility and (b) the applicable borrowing base. In addition, Ingram Micro will be required to make prepayments under the ABL Term Loan Facility with (a) the net cash proceeds of certain asset sales and casualty events relating to Current Asset Collateral subject to step-downs at specified leverage ratios and (b) the net cash proceeds of issuances of debt obligations by Ingram Micro and its restricted subsidiaries, except for certain permitted debt.
The ABL Credit Facilities contain customary covenants, including, but not limited to, restrictions on the ability of Ingram Micro and its restricted subsidiaries to merge and consolidate with other companies, incur indebtedness, grant liens or security interests on assets, make acquisitions, loans, advances or investments, pay dividends or make other restricted payments, sell or otherwise transfer assets, optionally prepay or modify terms of certain junior indebtedness, enter into transactions with affiliates or change the companys line of business. The ABL Credit Facilities will require the maintenance of a minimum Fixed Charge Coverage Ratio (as set forth in the ABL Credit Agreement), on any date when Adjusted Availability (as such term is defined in the ABL Credit Agreement) is less than the greater of (a) 10% of the Line Cap (as such term is defined in the ABL Credit Agreement) and (b) $300.0 million, of 1.00 to 1.00, tested for the four fiscal-quarter periods ending on the last day of the most recently ended fiscal quarter for which financials have been delivered, and at the end of each succeeding fiscal quarter thereafter until the date on which Adjusted Availability (as such term is defined in the ABL Credit Agreement) has exceeded the greater of (a) 10% of the Line Cap (as such term shall be defined in the ABL Credit Agreement) and (b) $300.0 million for at least 30 consecutive calendar days.
The ABL Credit Facilities provide that, upon the occurrence of certain events of default, its obligations thereunder may be accelerated and the lending commitments terminated. Such events of default include payment defaults to the lenders thereunder, material inaccuracies of representations and warranties, covenant defaults, cross-defaults to other material indebtedness, voluntary and involuntary bankruptcy proceedings, material money judgments, material pension plan events, certain change of control events and other customary events of default, subject to certain materiality levels, default triggers, cure and grace periods and/or baskets.
On April 4, 2022, we used a portion of the proceeds received from the primary closing of the CLS Sale to pay down the full outstanding balance of our ABL Term Loan Facility.
214
Table of Contents
On May 30, 2023, we entered into Amendment No. 2 to the ABL Credit Agreement, effective as of May 30, 2023, to amend the ABL Credit Agreement to replace LIBOR with SOFR as the interest rate benchmark.
On June 17, 2024, we entered into Amendment No. 3 to the ABL Credit Agreement, effective as of June 29, 2024, to amend the ABL Credit Agreement to replace the CDOR Rate (as such term is defined in the ABL Credit Agreement) with the Term CORRA Rate (as such term is defined in the ABL Credit Agreement) as the interest rate benchmark with respect to loans denominated in Canadian dollars.
As part of the 2024 Refinancing, on September 20, 2024, we entered into Amendment No. 4 to the ABL Credit Agreement to amend the ABL Credit Agreement to, among other things, extend the maturity date of the Revolving Commitment (as defined in the ABL Credit Agreement) to September 20, 2029.
Term Loan Credit Facility
On July 2, 2021, Ingram Micro entered into the Term Loan Credit Facility, which was fully drawn on such date to finance a portion of the Imola Mergers (and the related transactions).
Subject to certain conditions, the Term Loan Credit Facility, without the consent of the then existing lenders (but subject to the receipt of commitments), may be increased (or new incremental term loan facilities added) in an aggregate principal amount for all such increases and incremental facilities of no greater than (a) the greater of $1,337 million and 100.0% of Consolidated EBITDA (as such term is defined in the Term Loan Credit Agreement) less any increase in the ABL Credit Facilities established in reliance on the Fixed ABL Incremental Amount which means the greater of (1) $1,002,750,000 and (2) 75% of Consolidated EBITDA of Ingram Micro and its Restricted Subsidiaries (as such term is defined in the ABL Credit Agreement) for the most recently ended Test Period (as such term is defined in the ABL Credit Agreement) (calculated on a Pro Forma Basis (as such term is defined in the ABL Credit Agreement)), plus (b) an amount equal to all voluntary prepayments, repurchases and redemptions of pari passu term loans borrowed under the Term Loan Credit Agreement, the 2029 Notes, loans under the ABL Term Loan Facility and certain other indebtedness, plus (c) an unlimited amount, so long as on a pro forma basis (i) with respect to indebtedness secured by the Current Asset Collateral and Fixed Asset Collateral on a pari passu basis with the Term Loan Credit Facility, either (1) the Consolidated First Lien Net Leverage Ratio (as such term is defined in the Term Loan Credit Agreement) either (x) would not exceed the Consolidated First Lien Net Leverage Ratio as of the Acquisition Closing Date or (y) at the election of Ingram Micro if incurred in connection with a permitted acquisition or other permitted investment, would not increase or (2) the Fixed Charge Coverage Ratio (as such term is defined in the Term Loan Credit Agreement) is not less than the Fixed Charge Coverage Ratio prior to such increase and (ii) with respect to indebtedness secured by the Current Asset Collateral and Fixed Asset Collateral on a junior lien basis to the Term Loan Credit Facility or indebtedness that is unsecured, the Fixed Charge Coverage Ratio either (1) would not be less than 2.00 to 1.00 or (2) at the election of Ingram Micro if incurred in connection with a permitted acquisition or other permitted investment, would not decrease.
Borrowings under the Term Loan Credit Facility amortize in equal quarterly installments in an amount equal to 1.00% per annum of the principal amount. The interest rate applicable to borrowings under the Term Loan Credit Facility will be, at the companys option, either (1) the base rate (which is the highest of (x) the then current federal funds rate set by the Federal Reserve Bank of New York, plus 0.50%, (y) the prime rate on such day and (z) the one-month SOFR rate published on such date plus 1.00%) plus 1.75% or (2) one-, three- or six-month SOFR (subject to a floor of 0.50%) plus 2.75%. The Company entered into certain agreements during the first quarter of 2023 to establish a 5.5% upper limit on the LIBOR interest rate applicable to a substantial portion of the borrowings under the Term Loan Credit Facility. Due to the cessation of the LIBOR interest rate on June 30, 2023, we amended the interest rate cap agreements to establish a 5.317% upper limit on the SOFR interest rate. These interest rate cap agreements transitioned from LIBOR to SOFR as the interest reference rate during the third quarter of 2023.
Ingram Micro may voluntarily prepay loans or reduce commitments under the Term Loan Credit Facility, in whole or in part, subject to minimum amounts, with prior notice but without premium or penalty.
215
Table of Contents
Ingram Micro will be required to prepay the Term Loan Credit Facility with the net cash proceeds of certain asset sales and casualty events relating to Fixed Asset Collateral, the incurrence or issuance of specified refinancing indebtedness and 50% of excess cash flow, in each case, subject to certain reinvestment rights, thresholds, step-downs and other exceptions.
Ingram Micros obligations under the Term Loan Credit Facility are guaranteed by Imola Acquisition Corporation, Ingram Micro and all of Ingram Micros direct and indirect wholly owned U.S. subsidiaries (subject to certain permitted exceptions, including exceptions based on immateriality thresholds of aggregate assets and revenues of excluded U.S. subsidiaries). The Term Loan Credit Facility has a first-priority lien on the Fixed Asset Collateral and a lien (second in priority to the liens securing the ABL Credit Facilities discussed above) on the Current Asset Collateral, in each case, subject to other permitted liens. The liens securing the Term Loan Credit Facility are pari passu with the liens securing the 2029 Notes.
The Term Loan Credit Facility contains customary negative covenants, including, but not limited to, restrictions on the ability of Ingram Micro and its restricted subsidiaries to merge and consolidate with other companies, incur indebtedness, grant liens or security interests on assets, make acquisitions, loans, advances or investments, pay dividends or make other restricted payments, sell or otherwise transfer assets, optionally prepay or modify terms of certain junior indebtedness or enter into transactions with affiliates.
The Term Loan Credit Facility provides that, upon the occurrence of certain events of default, the companys obligations thereunder may be accelerated. Such events of default include payment defaults to the lenders thereunder, material inaccuracies of representations and warranties, covenant defaults, cross-defaults to other material indebtedness, voluntary and involuntary bankruptcy proceedings, material money judgments, material pension plan events, change of control and other customary events of default subject to certain materiality levels, default triggers, cure and grace periods and or baskets.
On June 23, 2023, the Term Loan Credit Agreement was amended pursuant to Amendment No. 1 to the Term Loan Credit Agreement to make certain conforming changes to replace LIBOR with SOFR with such changes to become effective as of July 1, 2023.
On June 30, 2023, we voluntarily paid down $500 million of the principal balance of our Term Loan Credit Facility. On September 27, 2023, the Term Loan Credit Agreement was amended pursuant to Amendment No. 2 to the Term Loan Credit Agreement to reduce the applicable margin on the outstanding term loans by 0.50%. Additionally, on September 27, 2023, we also concurrently paid down an incremental $50 million of the principal balance of our Term Loan Credit Facility. In June 2024, we voluntarily paid down an incremental $150 million of the principal balance of our Term Loan Credit Facility. As of June 29, 2024, $1,216.8 million remained outstanding under the Term Loan Credit Facility. See Capitalization.
As part of the 2024 Refinancing, on September 20, 2024, we voluntarily paid down an incremental $100 million of the principal balance of our Term Loan Credit Facility. Additionally, on September 20, 2024, concurrently with such repayment, the Term Loan Credit Agreement was amended pursuant to Amendment No. 3 to the Term Loan Credit Agreement to, among other things, extend the maturity date of the Term Loan (as defined in the Term Loan Credit Agreement) to September 19, 2031, reduce the applicable margin on the outstanding term loans by 0.25% and eliminate the credit-spread adjustment.
2029 Notes
On April 22, 2021, a shell company issued $2,000 million aggregate principal amount of 4.750% 2029 Notes into escrow to finance a portion of the Imola Mergers (and the related transactions). Ingram Micro became the issuer upon the Acquisition Closing Date. The 2029 Notes will mature on May 15, 2029. The interest rate for the 2029 Notes is 4.750% per annum, payable semi-annually on May 15 and November 15 of each year. The 2029 Notes were offered and sold in transactions not required to be registered under the Securities Act and are
216
Table of Contents
not entitled to any registration rights. The 2029 Notes are senior secured obligations and are jointly and severally guaranteed by Imola Acquisition Corporation and each of Ingram Micros existing and future wholly owned domestic subsidiaries that serve as guarantors under the Term Loan Credit Facility.
The 2029 Notes have a first-priority lien on the Fixed Asset Collateral and a lien (second in priority to the liens securing the ABL Credit Facility discussed above) on the Current Asset Collateral, in each case, subject to other permitted liens. The liens securing the 2029 Notes are pari passu with the liens securing the Term Loan Credit Facility.
The 2029 Notes are redeemable, in whole or in part, at any time, at the applicable redemption prices specified in the Indenture.
In connection with any offer to purchase the 2029 Notes (including a change of control offer and any tender offer), if holders of no less than 90% of the aggregate principal amount of the 2029 Notes validly tender their 2029 Notes, Ingram Micro is entitled to redeem any remaining 2029 Notes at the price offered to each holder.
Upon the occurrence of an event constituting a change of control under the Indenture governing our 2029 Notes, Ingram Micro must offer to repurchase all of the 2029 Notes at a price equal to 101% of their principal amount, plus accrued and unpaid interest, if any, to the repurchase date.
The Indenture governing the 2029 Notes contains certain negative covenants, agreements and events of default, including, among other things and subject to certain significant exceptions and qualifications, limitations on the ability of Ingram Micro and its restricted subsidiaries to (i) incur additional indebtedness and guarantee indebtedness; (ii) pay dividends or make other distributions in respect of, or repurchase or redeem, its capital stock; (iii) prepay, redeem or repurchase certain debt; (iv) issue certain preferred stock or similar equity securities; (v) make loans and investments; (vi) sell assets; (vii) incur liens; (viii) enter into agreements containing prohibitions affecting its subsidiaries ability to pay dividends; (ix) enter into transactions with affiliates; and (x) consolidate, merge or sell all or substantially all of its assets.
Other Indebtedness
We also have additional lines of credit, short-term overdraft facilities and other credit facilities with various financial institutions worldwide, which provide for borrowing capacity aggregating to approximately $960,023 million at June 29, 2024. Most of these arrangements are on an uncommitted basis and are reviewed periodically for renewal. At June 29, 2024, we had approximately $179,368 million outstanding under these facilities. The weighted average interest rate on the outstanding borrowings under these facilities, which may fluctuate depending on geographic mix, was 9.8% per annum at June 29, 2024. At June 29, 2024, letters of credit totaling approximately $155,072 million were issued to various customs agencies and landlords to support our subsidiaries. The issuance of these letters of credit reduces our available capacity under the corresponding agreements by the same amount.
217
Table of Contents
The following summary describes our capital stock and our amended and restated certificate of incorporation, amended and restated bylaws and Investor Rights Agreement to which we and Platinum will be party, each of which will be in effect immediately prior to the consummation of this offering and of certain relevant provisions of the DGCL. Because the following is only a summary, it does not contain all of the information that may be important to you. For a complete description, you should refer to our amended and restated certificate of incorporation, amended and restated bylaws and the Investor Rights Agreement, each of which will be in effect immediately prior to the consummation of this offering and copies of which are incorporated by reference as exhibits to the registration statement of which this prospectus is part, and to the applicable provisions of the DGCL.
Authorized Capital Stock
Our purpose is to engage in any lawful act or activity for which corporations may now or hereafter be organized under the DGCL. After the Offering Reorganization Transactions and consummation of this offering, our authorized capital stock will consist of 2,000,000,000 shares of Common Stock, par value $0.01 per share, and 100,000,000 shares of undesignated Preferred Stock, par value $0.01 per share. After the Offering Reorganization Transactions and consummation of this offering, we expect to have 235,495,185 shares of our Common Stock outstanding and no shares of Preferred Stock outstanding.
Common Stock
Voting Rights
Holders of our Common Stock are entitled to one vote for each share held on all matters submitted to a vote of stockholders and do not have cumulative voting rights. An election of directors by our stockholders shall be determined by a plurality of the votes cast by the stockholders entitled to vote on the election.
Dividend Rights
Holders of Common Stock are entitled to receive proportionately any dividends as may be declared by our board of directors, subject to any preferential dividend rights of any series of Preferred Stock that we may designate and issue in the future.
Liquidation Rights
In the event of our liquidation, dissolution or winding-up, the holders of Common Stock are entitled to receive proportionately our net assets available for distribution to stockholders after the payment in full of all debts and other liabilities and subject to the prior rights of any outstanding Preferred Stock.
Rights and Preferences
Holders of Common Stock have no preemptive, subscription, redemption or conversion rights. There will be no sinking funds provisions applicable to our Common Stock. The rights, preferences and privileges of holders of Common Stock are subject to and may be adversely affected by the rights of the holders of shares of any series of Preferred Stock that we may designate and issue in the future.
Fully Paid and Nonassessable
All of our outstanding shares of Common Stock are, and the shares of Common Stock to be issued in this offering will be, fully paid and nonassessable.
218
Table of Contents
Preferred Stock
We do not currently have any Preferred Stock outstanding. However, our amended and restated certificate of incorporation will authorize our board of directors to establish one or more series of Preferred Stock (including convertible Preferred Stock). Unless required by law or by the NYSE, the authorized shares of Preferred Stock will be available for issuance without further action by you. Our board of directors will be able to determine, with respect to any series of Preferred Stock, the terms and rights of that series, including:
| | the designation of the series; |
| | the number of shares of the series, which our board of directors may, except where otherwise provided in the Preferred Stock designation, increase (but not above the total number of authorized shares of the class) or decrease (but not below the number of shares then-outstanding); |
| | whether dividends, if any, will be cumulative or non-cumulative and the dividend rate of the series; |
| | the dates at which dividends, if any, will be payable; |
| | the redemption rights and price or prices, if any, for shares of the series; |
| | the terms and amounts of any sinking fund provided for the purchase or redemption of shares of the series; |
| | the amounts payable on shares of the series in the event of any voluntary or involuntary liquidation, dissolution or winding-up of the affairs of the Company; |
| | whether the shares of the series will be convertible into shares of any other class or series, or any other security, of the Company or any other corporation and, if so, the specification of the other class or series or other security, the conversion price or prices or rate or rates, any rate adjustments, the date or dates as of which the shares will be convertible and all other terms and conditions upon which the conversion may be made; |
| | restrictions on the issuance of shares of the same series or of any other class or series; and |
| | the voting rights, if any, of the holders of the series. |
We will be able to issue a series of Preferred Stock that could, depending on the terms of the series, impede or discourage an acquisition attempt or other transaction that some, or a majority, of the holders of our Common Stock might believe to be in their best interests or in which the holders of our Common Stock might receive a premium for their Common Stock over the market price of the Common Stock. In addition, the issuance of Preferred Stock may adversely affect the holders of our Common Stock by restricting dividends on the Common Stock, diluting the voting power of the Common Stock or subordinating the liquidation rights of the Common Stock. As a result of these or other factors, the issuance of Preferred Stock may have an adverse impact on the market price of our Common Stock.
Dividends
Declaration and payment of any dividend will be subject to the discretion of our board of directors. The time and amount of dividends will depend upon, among other things, general and economic conditions, our financial condition and results of operations, our available cash and current and anticipated cash needs, capital requirements, contractual and tax implications on the payment of dividends by us to our stockholders or by our subsidiaries to us, including restrictions and subject to the covenants under our Credit Facilities, the indenture governing the 2029 Notes and any other future indebtedness or preferred securities we may incur or issue, and such other factors as our board of directors may deem relevant. Our ability to pay dividends will be limited by covenants in our existing indebtedness and may be limited by the agreements governing other indebtedness that we or our subsidiaries incur in the future. See Dividend Policy and Description of Material Indebtedness. In addition, because we are a holding company and have no direct operations, we will only be able to pay dividends from funds we receive from our subsidiaries.
219
Table of Contents
Nomination Rights of Platinum
Our amended and restated certificate of incorporation and the Investor Rights Agreement will grant the Platinum Stockholder the right to nominate for election to our board of directors no fewer than that number of directors that would constitute: (i) a majority of the total number of directors so long as the Platinum Stockholder and Platinum collectively beneficially own at least 50% of the then-outstanding capital stock of the Company; (ii) 40% of the total number of directors so long as the Platinum Stockholder and Platinum collectively beneficially own at least 40% but less than 50% of the then-outstanding capital stock of the Company; (iii) 30% of the total number of directors so long as the Platinum Stockholder and Platinum collectively beneficially own at least 30% but less than 40% of the then-outstanding capital stock of the Company; (iv) 20% of the total number of directors so long as the Platinum Stockholder and Platinum collectively beneficially own at least 20% but less than 30% of the then-outstanding capital stock of the Company; and (v) 10% of the total number of directors so long as the Platinum Stockholder and Platinum collectively beneficially own at least 5% but less than 20% of the then-outstanding capital stock of the Company. For purposes of calculating the number of directors that the Platinum Stockholder will be entitled to nominate pursuant to the formula outlined above, any fractional amounts shall automatically be rounded up to the nearest whole number. Unless otherwise agreed by the Platinum Stockholder, for so long as the Platinum Stockholder retains the right to nominate a person to our board of directors, each committee of the board of directors will include at least one of the director candidates designated by the Platinum Stockholder, except to the extent such membership would violate applicable securities laws or stock exchange or stock market rules or where the sole purpose of such committee is to address actual or potential conflicts of interest between us and Platinum.
Registration Rights
The following description of the terms of the Investor Rights Agreement is intended as a summary only and is qualified in its entirety by reference to the Investor Rights Agreement filed as an exhibit to the registration statement of which this prospectus is a part.
Demand and Short-Form Registration Rights
At any time following the consummation of this offering, Platinum may request that we register its registrable securities on one or more occasions in the future, which registrations may be shelf registrations.
Piggyback Registration Rights
At any time that we propose to register any of our securities under the Securities Act (other than a registration relating to employee benefit plans, or solely relating to shares to be sold under Rule 145 or a similar provision under the Securities Act), Platinum will be entitled to certain piggyback registration rights allowing it to include its registrable securities in such registration.
Expenses of Registration, Restriction and Indemnification
We will pay all registration expenses, including the legal fees of counsel selected by Platinum, under the Investor Rights Agreement. The demand and piggyback registration rights are subject to customary restrictions such as limitations on the number of shares to be included in the underwritten offering imposed by the managing underwriter. The Investor Rights Agreement also contains customary indemnification and contribution provisions.
Anti-Takeover Effects of Our Certificate of Incorporation and By-Laws and Provisions of Delaware Law
General
Our amended and restated certificate of incorporation, amended and restated bylaws and the DGCL, which are summarized in the following paragraphs, contain or will contain provisions that are intended to enhance the likelihood of continuity and stability in the composition of our board of directors. These provisions are intended
220
Table of Contents
to avoid costly takeover battles, reduce our vulnerability to a hostile change of control and enhance the ability of our board of directors to maximize stockholder value in connection with any unsolicited offer to acquire us. However, these provisions may have an anti-takeover effect and may delay, deter or prevent a merger or acquisition of the Company by means of a tender offer, a proxy contest or other takeover attempt that a stockholder might consider is in its best interest, including those attempts that might result in a premium over the prevailing market price for the shares of Common Stock held by stockholders.
Classified Board
Our amended and restated certificate of incorporation will provide that our board of directors will be divided into three classes of directors, with the classes to be as nearly equal in number as possible and with the directors serving three-year terms. As a result, approximately one-third of our board of directors will be elected each year. The classification of directors will have the effect of making it more difficult for stockholders to change the composition of our board of directors. Our amended and restated certificate of incorporation and amended and restated bylaws will provide that the number of directors will be fixed from time to time exclusively pursuant to a resolution adopted by the board of directors, provided that, in the event that the number of directors nominated by the Platinum Stockholder is less than the number that the Platinum Stockholder is entitled to nominate under our amended and restated certificate of incorporation or the Investor Rights Agreement and there are no vacancies on our board of directors, then, upon our receipt of a written request of Platinum, the size of our board shall be increased automatically such that Platinum shall have the right, at any time, to nominate any such additional nominees under our amended and restated certificate of incorporation.
No Cumulative Voting
Under Delaware law, the right to vote cumulatively does not exist unless the certificate of incorporation specifically authorizes cumulative voting. Our amended and restated certificate of incorporation will not authorize cumulative voting. Therefore, stockholders holding a majority in voting power of the shares of our stock entitled to vote generally in the election of directors will be able to elect all our directors.
Removal of Directors; Vacancies
Under the DGCL, unless otherwise provided in our certificate of incorporation, directors serving on a classified board may be removed by the stockholders only for cause. Our amended and restated certificate of incorporation will provide that, directors may be removed with or without cause upon the affirmative vote of a majority in voting power of all outstanding shares of stock entitled to vote thereon, voting together as a single class; provided, however, that from and after the time Platinum and its affiliates cease to beneficially own, in the aggregate, at least a majority of the voting power of our outstanding Common Stock, directors may only be removed for cause, and only by the affirmative vote of holders of at least 66 and 2/3% in voting power of all the then-outstanding shares of stock of the Company entitled to vote thereon, voting together as a single class. Subject to the rights granted to Platinum under our amended and restated certificate of incorporation and the Investor Rights Agreement, any vacancy on our board of directors, including a vacancy resulting from an enlargement of our board of directors, may be filled only by vote of a majority of our directors then in office. In the event that (i) a vacancy is created at any time by the death, resignation, removal (with or without cause) or by any other cause of a Platinum Stockholder nominee and (ii) the number of directors nominated by the Platinum Stockholder is less than the number that the Platinum Stockholder is entitled to nominate under our amended and restated certificate of incorporation and the Investor Rights Agreement, then such vacancy may be filled only the Platinum Stockholder unless otherwise agreed by the Platinum Stockholder.
Advance Notice for Raising Business or Making Nominations at Meetings
Our amended and restated bylaws will establish advance notice procedures with respect to stockholder proposals and the nomination of candidates for election as directors, other than nominations made by or at the direction of the board of directors or a committee of the board of directors. In order for any matter to be
221
Table of Contents
properly brought before a meeting, a stockholder will have to comply with advance notice requirements and provide us with certain information. Generally, to be timely, a stockholders notice must be received at our principal executive offices not less than 90 days nor more than 120 days prior to the first anniversary date of the immediately preceding annual meeting of stockholders. Our amended and restated bylaws will also specify requirements as to the form and content of a stockholders notice. Our amended and restated bylaws will allow the chairperson of the meeting at a meeting of the stockholders to adopt rules and regulations for the conduct of meetings which may have the effect of precluding the conduct of certain business at a meeting if the rules and regulations are not followed. These notice requirements will not limit Platinum or its affiliates rights under our amended and restated certificate of incorporation or the Investor Rights Agreement. These provisions may defer, delay or discourage a potential acquirer from conducting a solicitation of proxies to elect the acquirers own slate of directors or otherwise attempting to influence or obtain control of the Company.
Actions by Written Consent; Special Meetings of Stockholders
Pursuant to Section 228 of the DGCL, any action required to be taken at any annual or special meeting of the stockholders may be taken without a meeting, without prior notice and without a vote if a consent or consents in writing, setting forth the action to be so taken, is signed by the holders of outstanding stock having not less than the minimum number of votes that would be necessary to authorize or take such action at a meeting at which all shares of our stock entitled to vote thereon were present and voted, unless our amended and restated certificate of incorporation provides otherwise. Our amended and restated certificate of incorporation will preclude stockholder action by written consent once Platinum and its affiliates beneficially own, in the aggregate, less than a majority of the voting power of all outstanding shares of our Common Stock.
Our amended and restated certificate of incorporation will also provide that special meetings of our stockholders may be called at any time only by or at the direction of the board of directors or the chairperson of the board of directors; provided, however, that Platinum and its affiliates are permitted to call special meetings of our stockholders for so long as they hold, in the aggregate, at least a majority of the voting power of all outstanding shares of our Common Stock. Our amended and restated bylaws will prohibit the conduct of any business at a special meeting other than as specified in the notice for such meeting. These provisions may have the effect of deferring, delaying or discouraging hostile takeovers or changes in control or management of the Company.
Amendments to the Companys Certificate of Incorporation and Bylaws
The DGCL provides generally that the affirmative vote of a majority of the outstanding shares entitled to vote thereon, voting together as a single class, is required to amend a corporations certificate of incorporation, unless the certificate of incorporation requires a greater percentage.
Our amended and restated certificate of incorporation will provide that once Platinum and its affiliates beneficially own, in the aggregate, less than 50% of the voting power of all outstanding shares of stock entitled to vote generally in the election of directors, the following provisions in our amended and restated certificate of incorporation may be amended, altered, repealed or rescinded only by the affirmative vote of the holders of at least 66 and 2/3% in the voting power of all outstanding shares of stock entitled to vote generally in the election of directors, voting together as a single class:
| | the provision requiring a 66 and 2/3% supermajority vote for stockholders to amend our amended and restated bylaws; |
| | the provisions providing for a classified board of directors (the election and term of our directors); |
| | the provisions regarding resignation and removal of directors; |
| | the provisions regarding entering into business combinations with interested stockholders; |
| | the provisions regarding stockholder action by written consent; |
222
Table of Contents
| | the provisions regarding calling special meetings of stockholders; |
| | the provisions regarding filling vacancies on our board of directors and newly created directorships; |
| | the provisions eliminating monetary damages for breaches of fiduciary duty by a director; |
| | the provisions regarding competition and corporate opportunities; and |
| | the amendment provision requiring that the above provisions may be amended only with a 66 and 2/3% supermajority vote. |
In addition, our amended and restated certificate of incorporation may not be amended, altered or repealed without the prior written consent of Platinum if such amendment, alteration or repeal would adversely affect the rights of Platinum under our amended and restated certificate of incorporation.
The combination of the classification of our board of directors, the lack of cumulative voting and the supermajority voting requirements will make it more difficult for our existing stockholders to replace our board of directors, as well as for another party to obtain control of us by replacing our board of directors. Because our board of directors has the power to retain and discharge our officers, these provisions could also make it more difficult for existing stockholders or another party to effect a change in management.
Dissenters Rights of Appraisal and Payment
Under the DGCL, with certain exceptions, our stockholders will have appraisal rights in connection with a merger or consolidation of us. Pursuant to the DGCL, stockholders who properly request and perfect appraisal rights in connection with such merger or consolidation will have the right to receive payment of the fair value of their shares as determined by the Delaware Court of Chancery.
Stockholders Derivative Actions
Under the DGCL, any of our stockholders may bring an action in our name to procure a judgment in our favor, also known as a derivative action, provided that the stockholder bringing the action is a holder of our shares at the time of the transaction to which the action relates or such stockholders stock thereafter devolved by operation of law.
Exclusive Jurisdiction of Certain Actions
Our amended and restated certificate of incorporation will provide, subject to limited exceptions, that unless we consent to the selection of an alternative forum, the Court of Chancery of the State of Delaware will, to the fullest extent permitted by law, be the sole and exclusive forum for any (i) derivative action or proceeding brought on behalf of the Company, (ii) action asserting a claim of breach of any fiduciary duty owed by, or other wrongdoing by, any director, officer or other employee of the Company to the Company or our stockholders, creditors or other constituents, or a claim of aiding and abetting any such breach of fiduciary duty, (iii) action asserting a claim against the Company or any director, officer or other employee of the Company arising pursuant to any provision of the DGCL or our amended and restated certificate of incorporation or our amended and restated bylaws, (iv) action to interpret, apply, enforce or determine the validity of the amended and restated certificate of incorporation, (v) action asserting a claim against the Company or any director, officer or other employee of the Company governed by the internal affairs doctrine or (vi) any other action asserting an internal corporate claim, as that term is defined in Section 115 of the DGCL; provided that, for the avoidance of doubt, the exclusive forum provision will not apply to suits brought to enforce any liability or duty created by the Securities Act, the Exchange Act, or any other claim for which the federal courts have exclusive jurisdiction. Our amended and restated certificate of incorporation also provides that, unless we consent in writing to the selection of an alternative forum, the U.S. federal district courts will be the exclusive forum for the resolution of any actions or proceedings asserting claims arising under the Securities Act. However, Section 22 of the Securities Act creates concurrent jurisdiction for federal and state courts over all suits brought to enforce a duty or liability created by the Securities Act or the rules
223
Table of Contents
and regulations thereunder. While the Delaware Supreme Court has upheld the validity of similar provisions under the DGCL, there is uncertainty as to whether a court in another state would enforce such a forum selection provision. Our exclusive forum provision will not relieve us of our duties to comply with the federal securities laws and the rules and regulations thereunder, and our stockholders will not be deemed to have waived our compliance with these laws, rules and regulations. Any person or entity purchasing or otherwise acquiring any interest in shares of capital stock of the Company will be deemed to have notice of and consented to the forum provisions in our amended and restated certificate of incorporation. For more information on the risks associated with our choice of forum provision, see Risk FactorsRisks Related to this Offering and Ownership of Our Common StockOur amended and restated certificate of incorporation will contain exclusive forum provisions for certain stockholder litigation matters, which would limit our stockholders ability to obtain a favorable judicial forum for disputes with us or our directors, officers, associates or stockholders.
Business Combinations
Upon completion of this offering, we will not be subject to the provisions of Section 203 of the DGCL. In general, Section 203 prohibits a publicly held Delaware corporation from engaging in a business combination with an interested stockholder for a three-year period following the time that the person becomes an interested stockholder, unless the business combination is approved in a prescribed manner. A business combination includes, among other things, a merger, asset or stock sale or other transaction resulting in a financial benefit to the interested stockholder. An interested stockholder is a person who, together with affiliates and associates, owns, or did own within three years prior to the determination of interested stockholder status, 15% or more of the corporations voting stock.
Under Section 203, a business combination between a corporation and an interested stockholder is prohibited unless it satisfies one of the following conditions:
| | before the stockholder became an interested stockholder, our board of directors approved either the business combination or the transaction that resulted in the stockholder becoming an interested stockholder; |
| | upon consummation of the transaction that resulted in the stockholder becoming an interested stockholder, the interested stockholder owned at least 85% of our voting stock outstanding at the time the transaction commenced, excluding certain shares; or |
| | at or after the time that the stockholder became an interested stockholder, the business combination was approved by our board of directors and by the affirmative vote of holders of at least two-thirds of our outstanding voting stock that was not owned by the interested stockholder. |
A Delaware corporation may opt out of these provisions with an express provision in its original certificate of incorporation or an express provision in its certificate of incorporation or bylaws resulting from a stockholders amendment approved by at least a majority of the outstanding voting shares.
We will opt out of Section 203; however, our certificate of incorporation will contain similar provisions providing that we may not engage in certain business combinations with any interested stockholder for a three-year period following the time that the stockholder became an interested stockholder, unless:
| | prior to such time, our board of directors approved either the business combination or the transaction which resulted in the stockholder becoming an interested stockholder; |
| | upon consummation of the transaction that resulted in the stockholder becoming an interested stockholder, the interested stockholder owned at least 85% of our voting stock outstanding at the time the transaction commenced, excluding certain shares; or |
| | at or subsequent to that time, the business combination was approved by our board of directors and by the affirmative vote of holders of at least 66 and 2/3% of our outstanding voting stock that was not owned by the interested stockholder. |
224
Table of Contents
Under certain circumstances, this provision will make it more difficult for a person who would be an interested stockholder to effect various business combinations with the Company for a three-year period. This provision may encourage companies interested in acquiring the Company to negotiate in advance with our board of directors because the stockholder approval requirement would be avoided if our board approves either the business combination or the transaction which results in the stockholder becoming an interested stockholder. These provisions also may have the effect of preventing changes in our board of directors and may make it more difficult to accomplish transactions which stockholders may otherwise deem to be in their best interests.
Our amended and restated certificate of incorporation will provide that Platinum and its affiliates, any of their respective direct or indirect transferees and any group as to which such persons are a party, do not constitute interested stockholders for purposes of this provision.
Limitations on Liability of Directors and Indemnification of Directors and Officers
The DGCL authorizes corporations to limit or eliminate the personal liability of directors or certain officers to the corporation and their stockholders for monetary damages for breaches of directors or officers fiduciary duties, subject to certain exceptions. Our amended and restated certificate of incorporation includes a provision that eliminates the personal liability of directors and certain officers for monetary damages for any breach of fiduciary duty as a director or officer, except to the extent such liability or limitation thereof is not permitted under the DGCL. The effect of these provisions is to eliminate (1) our rights, and the rights of our stockholders, through stockholders derivative suits on our behalf, to recover monetary damages from a director for breach of fiduciary duty as a director and (2) our rights to recover monetary damages from certain officers for breach of fiduciary duty as an officer. However, exculpation does not apply to (1) a director or officer for any breach of the directors or officers duty of loyalty to the corporation or its stockholders, (2) a director or officer for acts or omissions not in good faith or which involve intentional misconduct or a knowing violation of law, (3) a director or officer for any transaction from which the director or officer derived an improper personal benefit, (4) a director under Section 174 of the DGCL (regarding, among other things, the payment of unlawful dividends or unlawful stock purchases or redemptions) or (5) an officer in any action by or in the right of the corporation.
Our amended and restated bylaws will provide that we must indemnify and advance expenses to our directors and officers to the fullest extent authorized by the DGCL. We also are expressly authorized to carry directors and officers liability insurance providing indemnification for our directors, officers and certain associates for some liabilities. We believe that these indemnification and advancement provisions and insurance are useful to attract and retain qualified directors and executive officers.
The limitation of liability, indemnification and advancement provisions in our amended and restated certificate of incorporation and amended and restated bylaws may discourage stockholders from bringing a lawsuit against directors for breach of their fiduciary duty. These provisions may also have the effect of reducing the likelihood of derivative litigation against directors and officers, even though such an action, if successful, might otherwise benefit us and our stockholders. In addition, your investment may be adversely affected to the extent we pay the costs of settlement and damage awards against directors and officers pursuant to these indemnification provisions.
There is currently no pending material litigation or proceeding involving any of our directors, officers or associates for which indemnification is sought.
Corporate Opportunity
Delaware law permits corporations to adopt provisions renouncing any expectancy in or right to be offered an opportunity to participate in certain transactions or matters that may be investment, corporate or business opportunities and that are presented to a corporation or its officers, directors or stockholders. Our amended and restated certificate of incorporation will, to the maximum extent permitted from time to time by Delaware law, renounce any interest or expectancy that we have in, or right to be offered an opportunity to participate in,
225
Table of Contents
specified business opportunities that are from time to time presented to our officers, directors or stockholders or their respective affiliates, other than those officers, directors, stockholders or affiliates who are our or our subsidiaries associates. Our amended and restated certificate of incorporation will provide that, to the fullest extent permitted by law, Platinum or any of its affiliates or any director who is not employed by us (including any non-employee director who serves as one of our officers in both his or her director and officer capacities) or his or her affiliates will not have any duty to refrain from (i) engaging in a corporate opportunity in the same or similar lines of business in which we or our affiliates now engage or propose to engage or (ii) otherwise competing with us or our affiliates. In addition, to the fullest extent permitted by law, in the event that Platinum or any of its affiliates or any non-employee director acquires knowledge of a potential transaction or other business opportunity which may be a corporate opportunity for itself or himself or its or his affiliates or for us or our affiliates, such person will have no duty to communicate or offer such transaction or business opportunity to us or any of our affiliates and they may take any such opportunity for themselves or offer it to another person or entity. Our amended and restated certificate of incorporation will not renounce our interest in any business opportunity that is expressly offered to a non-employee director solely in his or her capacity as a director or officer of the Company. To the fullest extent permitted by law, no business opportunity will be deemed to be a potential corporate opportunity for us unless we would be permitted to undertake the opportunity under our amended and restated certificate of incorporation, we have sufficient financial resources to undertake the opportunity and the opportunity would be in line with our business.
Transfer Agent and Registrar
The transfer agent and registrar for our Common Stock are Computershare Inc. and Computershare Trust Company, N.A. (collectively, Computershare). Computershares address is 150 Royall Street, Canton, Massachusetts 02021.
Listing
We have applied to have our Common Stock approved for quotation on the New York Stock Exchange under the symbol INGM.
226
Table of Contents
SHARES ELIGIBLE FOR FUTURE SALE
Prior to this offering, there has been no public market for the shares of our Common Stock. We cannot predict the effect, if any, future sales of shares of Common Stock, or the availability for future sale of shares of Common Stock, will have on the market price of shares of our Common Stock prevailing from time to time. Future sales of substantial amounts of our Common Stock in the public market or the perception that such sales might occur may adversely affect market prices of our Common Stock prevailing from time to time and could impair our future ability to raise capital through the sale of our equity or equity-related securities at a time and price that we deem appropriate. Furthermore, there may be sales of substantial amounts of our Common Stock in the public market after the existing legal and contractual restrictions lapse. This may adversely affect the prevailing market price and our ability to raise equity capital in the future. See Risk FactorsRisks Related to this Offering and Ownership of Our Common Stock.
Upon completion of this offering, we will have a total of 235,495,185 shares of our Common Stock outstanding. Of the outstanding shares, all the shares sold in this offering, including the shares offered by the selling stockholder if the underwriters exercise in full their option to purchase additional shares, solely to cover over-allotments, if any) will be freely tradeable without restriction or further registration under the Securities Act, except that any shares held by our affiliates, as that term is defined under Rule 144, including our directors, executive officers and other affiliates (including our existing owners), may be sold only in compliance with the limitations described below and any shares purchased by our directors, officers, the selling stockholder or other existing stockholders and optionholders pursuant to our reserved share program will be subject to the lock-up agreements described below.
Rule 144
In general, under Rule 144, as currently in effect, once we have been subject to public company reporting requirements for at least 90 days, a person (or persons whose shares are aggregated) who is not deemed to be or have been one of our affiliates for purposes of the Securities Act at any time during 90 days preceding a sale and who has beneficially owned the shares proposed to be sold for at least six months, including the holding period of any prior owner other than an affiliate, is entitled to sell such shares without complying with the manner of sale, volume limitation or notice provisions of Rule 144, subject to compliance with the public information requirements of Rule 144. If such a person has beneficially owned the shares proposed to be sold for at least one year, including the holding period of a prior owner other than an affiliate, then such person is entitled to sell such shares without complying with any of the requirements of Rule 144.
In general, under Rule 144 as currently in effect, our affiliates or persons selling shares of our Common Stock on behalf of our affiliates, who have met the six-month holding period for beneficial ownership of restricted securities of our Common Stock, are entitled to sell upon the expiration of the lock-up agreements described above, within any three-month period beginning 90 days after the date of this prospectus, a number of shares that does not exceed the greater of:
| | 1% of the number of shares of our Common Stock then-outstanding, which will equal approximately 2,354,952 million shares immediately after this offering; or |
| | 1% of the average reported weekly trading volume of our Common Stock on the applicable stock exchange during the four calendar weeks preceding the filing of a notice on Form 144 with respect to such sale. |
Sales under Rule 144 by our affiliates or persons selling shares on behalf of our affiliates are also subject to certain manner of sale provisions and notice requirements and to the availability of current public information about us. The sale of these shares, or the perception that sales will be made, could adversely affect the price of our Common Stock after this offering because a great supply of shares would be, or would be perceived to be, available for sale in the public market.
227
Table of Contents
We are unable to estimate the number of shares that will be sold under Rule 144 since this will depend on the market price for our Common Stock, the personal circumstances of the stockholder and other factors.
Rule 701
In general, under Rule 701 under the Securities Act as currently in effect, any of our associates, directors, officers, consultants or advisors who received shares of our Common Stock from us in connection with a compensatory stock or option plan or other written agreement before the effective date of this offering are entitled to sell such shares 90 days after the effective date of this offering in reliance on Rule 144, in the case of affiliates, without having to comply with the holding period requirements of Rule 144 and, in the case of non-affiliates, without having to comply with the public information, holding period, volume limitation or notice filing requirements of Rule 144.
Registration Statement on Form S-8
Following this offering, we intend to file with the SEC a registration statement on Form S-8 under the Securities Act covering the shares of Common Stock that are subject to outstanding options and other awards issuable pursuant to the 2024 Plan that we intend to adopt in connection with this offering. Shares covered by such registration statement will be available for sale in the open market following its effective date, subject to certain Rule 144 limitations applicable to affiliates and the terms of lock-up agreements applicable to those shares.
Lock-up Agreements
In connection with this offering, we, all of our directors, executive officers, the selling stockholder and holders of substantially all of the outstanding Common Stock of Ingram Micro Holding Corporation immediately prior to this offering, have entered into lock-up agreements with the underwriters, pursuant to which, all such parties have agreed, subject to certain exceptions, not to sell, dispose of or hedge any shares of our Common Stock or securities convertible into or exchangeable for shares of our Common Stock, without, in each case, the prior written consent of any two of Morgan Stanley & Co. LLC, Goldman Sachs & Co. LLC and J.P. Morgan Securities LLC on behalf of the underwriters, for the duration of the Lock-Up Period. See UnderwritingNo Sale of Similar Securities. As a result of the foregoing, substantially all of our outstanding Common Stock and securities directly or indirectly convertible into or exchangeable or exercisable for our Common Stock are subject to a lock-up agreement during the Lock-Up Period. See Underwriting for information about exceptions to the lock-up agreements described above and a further description of these agreements. Upon the expiration of the Lock-Up Period, substantially all of the securities subject to such transfer restrictions will become eligible for sale, subject to the limitations discussed above.
Registration Rights
Pursuant to the Investor Rights Agreement, we will grant Platinum the right to cause us, in certain instances, at our expense, to file registration statements under the Securities Act covering resales of our Common Stock held by Platinum and to provide piggyback registration rights to Platinum, subject to certain limitations and priorities on registration detailed therein, on registered offerings. See Description of Capital StockRegistration Rights. These shares will represent 90.8% of our outstanding Common Stock after this offering, or 89.6% if the underwriters exercise their option to purchase additional shares (solely to cover over-allotments, if any).
228
Table of Contents
MATERIAL U.S. FEDERAL INCOME TAX CONSEQUENCES TO NON-U.S. HOLDERS
The following discussion is a summary of the material U.S. federal income tax consequences to Non-U.S. Holders (as defined below) of the purchase, ownership and disposition of our Common Stock issued or sold pursuant to this offering, but does not purport to be a complete analysis of all potential U.S. federal income tax effects.
The effects of U.S. federal tax laws other than U.S. federal income tax laws, such as estate and gift tax laws, and any applicable state, local or non-U.S. tax laws are not discussed. There may be adverse U.S. federal estate tax consequences to a Non-U.S. Holder of our Common Stock, and Non-U.S. Holders should consult their tax advisors regarding the application of U.S. federal estate tax laws to their particular situation.
This discussion is based on the U.S. Internal Revenue Code of 1986, as amended (the Code), Treasury Regulations promulgated thereunder, judicial decisions and published rulings and administrative pronouncements of the U.S. Internal Revenue Service (the IRS) in each case in effect as of the date hereof. These authorities may change or be subject to differing interpretations. Any such change or differing interpretation may be applied retroactively in a manner that could adversely affect a Non-U.S. Holder. We have not sought and will not seek any rulings from the IRS regarding the matters discussed below. There can be no assurance the IRS or a court will not take a contrary position to that discussed below regarding the tax consequences of the purchase, ownership and disposition of our Common Stock.
This discussion is limited to Non-U.S. Holders that hold our Common Stock as a capital asset within the meaning of Section 1221 of the Code (generally, property held for investment). This discussion does not address all U.S. federal income tax consequences relevant to a Non-U.S. Holders particular circumstances, including the impact of the Medicare contribution tax on net investment income or the alternative minimum tax. In addition, it does not address consequences relevant to Non-U.S. Holders subject to special rules, including, without limitation:
| | U.S. expatriates and former citizens or long-term residents of the United States; |
| | persons holding our Common Stock as part of a hedge, straddle or other risk reduction strategy or as part of a conversion transaction or other integrated investment; |
| | banks, insurance companies and other financial institutions; |
| | brokers, dealers or traders in securities; |
| | controlled foreign corporations, passive foreign investment companies, and corporations that accumulate earnings to avoid U.S. federal income tax; |
| | partnerships or other entities or arrangements treated as partnerships for U.S. federal income tax purposes (and investors therein); |
| | tax-exempt entities or governmental entities; |
| | persons deemed to sell our Common Stock under the constructive sale provisions of the Code; |
| | persons who hold or receive our Common Stock pursuant to the exercise of any employee stock option or otherwise as compensation; |
| | tax-qualified retirement plans; |
| | qualified foreign pension funds as defined in Section 897(l)(2) of the Code and entities all of the interests of which are held by qualified foreign pension funds; and |
| | persons subject to special tax accounting rules as a result of any item of gross income with respect to our Common Stock being taken into account in an applicable financial statement. |
229
Table of Contents
If an entity or arrangement treated as a partnership for U.S. federal income tax purposes holds our Common Stock, the tax treatment of a partner in the partnership will depend on the status of the partner, the activities of the partnership and certain determinations made at the partner level. Accordingly, partnerships considering an investment in our Common Stock and the partners in such partnerships should consult their tax advisors regarding the U.S. federal income tax consequences to them.
THIS DISCUSSION IS FOR INFORMATIONAL PURPOSES ONLY AND IS NOT TAX ADVICE. INVESTORS SHOULD CONSULT THEIR TAX ADVISORS WITH RESPECT TO THE APPLICATION OF THE U.S. FEDERAL INCOME TAX LAWS TO THEIR PARTICULAR SITUATIONS AS WELL AS ANY TAX CONSEQUENCES OF THE PURCHASE, OWNERSHIP AND DISPOSITION OF OUR COMMON STOCK ARISING UNDER THE OTHER U.S. FEDERAL TAX LAWS (INCLUDING ESTATE OR GIFT TAX LAWS) OR UNDER THE LAWS OF ANY STATE, LOCAL OR NON-U.S. TAXING JURISDICTION OR UNDER ANY APPLICABLE TAX TREATY.
Definition of a Non-U.S. Holder
For purposes of this discussion, a Non-U.S. Holder is a beneficial owner of our Common Stock that is neither a U.S. person nor an entity or arrangement treated as a partnership for U.S. federal income tax purposes. For purposes of this discussion, a U.S. person is any person that, for U.S. federal income tax purposes, is or is treated as any of the following:
| | an individual who is a citizen or resident of the United States; |
| | a corporation created or organized under the laws of the United States, any state thereof or the District of Columbia; |
| | an estate, the income of which is subject to U.S. federal income tax regardless of its source; or |
| | a trust that (1) is subject to the primary supervision of a U.S. court and all substantial decisions of which are subject to the control of one or more United States persons (within the meaning of Section 7701(a)(30) of the Code) or (2) has a valid election in effect to be treated as a United States person for U.S. federal income tax purposes. |
Distributions on Common Stock
If we make distributions of cash or property on our Common Stock, such distributions will generally constitute dividends for U.S. federal income tax purposes to the extent paid from our current or accumulated earnings and profits, as determined under U.S. federal income tax principles. Amounts not treated as dividends for U.S. federal income tax purposes because distributed amounts exceed our current and accumulated earnings and profits will constitute a return of capital and will first be applied against and reduce a Non-U.S. Holders adjusted tax basis in its Common Stock (determined separately for each share), but not below zero. Any remaining excess (determined separately for each share) will be treated as capital gain and will be treated as described below under Sale or Other Taxable Disposition. See Dividend Policy for more information on our current plans with respect to making distributions on our Common Stock.
Subject to the discussion below regarding backup withholding and FATCA (as defined below), dividends paid to a Non-U.S. Holder that are not effectively connected with the Non-U.S. Holders conduct of a trade or business within the United States will be subject to U.S. federal withholding tax at a rate of 30% of the gross amount of the dividends (or such lower rate specified by an applicable income tax treaty, provided the Non-U.S. Holder furnishes a valid IRS Form W-8BEN or W-8BEN-E (or other applicable documentation) certifying qualification for the lower treaty rate). A Non-U.S. Holder that does not timely furnish the required documentation, but that qualifies for a reduced treaty rate, may obtain a refund of any excess amounts withheld by timely filing an appropriate claim for refund with the IRS. Non-U.S. Holders should consult their tax advisors regarding their entitlement to benefits under any applicable income tax treaty.
230
Table of Contents
Unless an applicable income tax treaty provides otherwise, if dividends paid to a Non-U.S. Holder are effectively connected with the Non-U.S. Holders conduct of a trade or business within the United States, the Non-U.S. Holder will be exempt from the U.S. federal withholding tax described above. To claim the exemption, the Non-U.S. Holder generally must furnish to the applicable withholding agent a valid IRS Form W-8ECI, certifying that the dividends are effectively connected with the Non-U.S. Holders conduct of a trade or business within the United States.
Unless an applicable income tax treaty provides otherwise, any such effectively connected dividends generally will be subject to U.S. federal income tax on a net income basis at the regular rates generally applicable to a U.S. person. A Non-U.S. Holder that is a corporation also may be subject to a branch profits tax at a rate of 30% (or such lower rate specified by an applicable income tax treaty) on such Non-U.S. Holders effectively connected earnings and profits, as adjusted for certain items. Non-U.S. Holders should consult their tax advisors regarding any applicable tax treaties that may provide for different rules.
Sale or Other Taxable Disposition
A Non-U.S. Holder will not be subject to U.S. federal income tax on any gain recognized upon the sale or other taxable disposition of a share of our Common Stock unless:
| | the gain is effectively connected with the Non-U.S. Holders conduct of a trade or business within the United States; |
| | the Non-U.S. Holder is a nonresident alien individual present in the United States for 183 days or more during the taxable year of the disposition and certain other requirements are met; or |
| | our Common Stock constitutes a U.S. real property interest by reason of our status as a U.S. real property holding corporation (USRPHC) for U.S. federal income tax purposes at any time during the shorter of (i) the five-year period preceding the date of the disposition and (ii) the Non-U.S. Holders holding period with respect to the share of our Common Stock that is disposed (the Applicable USRPHC Period). |
Unless an applicable income tax treaty provides otherwise, any gain described in the first bullet point above generally will be subject to U.S. federal income tax on a net income basis at the regular rates generally applicable to a U.S. person. A Non-U.S. Holder that is a corporation also may be subject to a branch profits tax at a rate of 30% (or such lower rate specified by an applicable income tax treaty) on such Non-U.S. Holders effectively connected earnings and profits, as adjusted for certain items.
A Non-U.S. Holder described in the second bullet point above will be subject to U.S. federal income tax at a rate of 30% (or such lower rate specified by an applicable income tax treaty) on any gain recognized upon the sale or other taxable disposition of our Common Stock, which may be offset by certain U.S. source capital losses of the Non-U.S. Holder, if any (even though the individual is not considered a resident of the United States), provided the Non-U.S. Holder has timely filed U.S. federal income tax returns with respect to such losses.
With respect to the third bullet point above, we believe we currently are not, and do not anticipate becoming, a USRPHC. Because the determination of whether we are a USRPHC depends, however, on the fair market value of our U.S. real property interests relative to the fair market value of our non-U.S. real property interests and our other business assets, there can be no assurance that we currently are not a USRPHC or will not become one in the future. Even if we are or were to become a USRPHC, any gain recognized from the sale or other taxable disposition of our Common Stock by a Non-U.S. Holder will not be subject to U.S. federal income tax if our Common Stock is regularly traded, as defined by applicable Treasury Regulations, on an established securities market, and such Non-U.S. Holder owned, actually and constructively, no more than 5% of our Common Stock throughout the Applicable USRPHC Period.
Non-U.S. Holders should consult their tax advisors regarding potentially applicable income tax treaties that may provide for different rules.
231
Table of Contents
Information Reporting and Backup Withholding
Payments of dividends on our Common Stock to a Non-U.S. Holder will not be subject to backup withholding (currently at 24%) if either the holder certifies its non-U.S. status, such as by furnishing a valid IRS Form W-8BEN, W-8BEN-E or W-8ECI, or the holder otherwise establishes an exemption. However, information returns are required to be filed with the IRS in connection with any distributions on our Common Stock paid to the Non-U.S. Holder, regardless of whether such distributions constitute dividends or whether any tax was actually withheld. In addition, proceeds of the sale or other taxable disposition of our Common Stock within the United States or conducted through certain brokers that are U.S. persons or have a specified relationship with the United States generally will be subject to backup withholding or information reporting unless the applicable withholding agent receives the certification described above or the holder otherwise establishes an exemption. Proceeds of a disposition of our Common Stock conducted through a non-U.S. office of a non-U.S. broker that does not have a specified relationship with the United States generally will not be subject to backup withholding or information reporting.
Copies of information returns that are filed with the IRS may also be made available under the provisions of an applicable treaty or agreement to the tax authorities of the country in which the Non-U.S. Holder resides or is established.
Backup withholding is not an additional tax. Any amounts withheld under the backup withholding rules may be allowed as a refund or a credit against a Non-U.S. Holders U.S. federal income tax liability, if any, provided the required information is timely furnished to the IRS.
Additional Withholding Tax on Payments Made to Foreign Accounts
Withholding taxes may be imposed under Sections 1471 to 1474 of the Code (such Sections commonly referred to as the Foreign Account Tax Compliance Act (FATCA)) on certain types of payments made to non-U.S. financial institutions and certain other non-U.S. entities (whether such institutions or entities are beneficial owners or intermediaries). Specifically, a 30% withholding tax may be imposed on dividends on, or (subject to the proposed Treasury Regulations discussed below) gross proceeds from the sale or other disposition of, our Common Stock paid to a foreign financial institution or a non-financial foreign entity (each as defined in the Code), unless (1) the foreign financial institution undertakes certain diligence and reporting obligations, (2) the non-financial foreign entity either certifies it does not have any substantial U.S. owners (as defined in the Code) or furnishes identifying information regarding each substantial U.S. owner or (3) the foreign financial institution or non-financial foreign entity otherwise qualifies for an exemption from these rules. If the payee is a foreign financial institution and is subject to the diligence and reporting requirements in (1) above, it must enter into an agreement with the U.S. Department of the Treasury requiring, among other things, that it undertake to identify accounts held by certain specified United States persons or United States owned foreign entities (each as defined in the Code), annually report certain information about such accounts and withhold 30% on certain payments to noncompliant foreign financial institutions and certain other account holders. Foreign financial institutions located in jurisdictions that have an intergovernmental agreement with the United States governing FATCA may be subject to different rules.
Under the applicable Treasury Regulations and administrative guidance, withholding under FATCA generally applies to payments of dividends on our Common Stock. While withholding under FATCA also would have applied to payments of gross proceeds from the sale or other disposition of our Common Stock, proposed Treasury Regulations eliminate FATCA withholding on payments of gross proceeds entirely. Taxpayers generally may rely on these proposed Treasury Regulations until final Treasury Regulations are issued.
Prospective investors should consult their tax advisors regarding the potential application of withholding under FATCA to their investment in our Common Stock.
232
Table of Contents
Subject to the terms and conditions stated in the underwriting agreement dated the date of this prospectus, among us, the selling stockholder and the underwriters, each underwriter, for whom Morgan Stanley & Co. LLC, Goldman Sachs & Co. LLC and J.P. Morgan Securities LLC are acting as representatives (collectively, the representatives), named below has severally and not jointly agreed to purchase at the public offering price less the underwriting discounts and commissions set forth on the cover page of this prospectus, the number of shares of common stock listed next to its name in the following table, and we and the selling stockholder have agreed to sell to that underwriter, the number of shares set forth opposite the underwriters name.
| Name |
Number of Shares | |||
| Morgan Stanley & Co. LLC |
||||
| Goldman Sachs & Co. LLC |
||||
| J.P. Morgan Securities LLC |
||||
| BofA Securities, Inc. |
||||
| Deutsche Bank Securities Inc. |
||||
| Evercore Group L.L.C. |
||||
| Jefferies LLC |
||||
| RBC Capital Markets, LLC |
||||
| BNP Paribas Securities Corp. |
||||
| Guggenheim Securities, LLC |
||||
| Raymond James & Associates, Inc. |
||||
| Rothschild & Co US Inc. |
||||
| Stifel, Nicolaus & Company, Incorporated |
||||
| William Blair & Company, L.L.C |
||||
| Fifth Third Securities, Inc. |
||||
| Loop Capital Markets LLC |
||||
|
|
|
|||
| Total |
18,600,000 | |||
|
|
|
|||
The underwriters are committed to take and pay for all of the shares being offered by us and the selling stockholder, if any are taken, other than the shares covered by the option described below unless and until this option is exercised. The underwriting agreement also provides that if an underwriter defaults, the purchase commitments of non-defaulting underwriters may also be increased or the offering may be terminated.
Options to Purchase Additional Shares
The underwriters have an option to buy up to an additional 2,790,000 shares from the selling stockholder, solely for the purpose of covering over-allotments, if any, made in connection with the offering of the shares of Common Stock offered by this prospectus. They may exercise that option for 30 days following the date of this prospectus. If any shares are purchased pursuant to this over-allotment option, the underwriters will severally purchase shares in approximately the same proportion as set forth in the table above.
Commissions and Discounts
The representatives have advised us and the selling stockholder that the underwriters propose initially to offer the shares to the public at the public offering price set forth on the cover page of this prospectus and to dealers at that price less a concession not in excess of $ per share. Any such dealers may resell shares to certain other brokers or dealers at a discount of up to $ per share from the initial public offering price. After the initial offering, the public offering price, concession or any other term of the offering may be changed.
The following table shows the per share and total public offering price, total underwriting discounts and commissions to be paid to the underwriters by us and proceeds before expenses to us and to the selling
233
Table of Contents
stockholder. Such amounts are shown assuming both no exercise and full exercise of the underwriters option to purchase 2,790,000 additional shares of Common Stock from the selling stockholder as described herein.
| Total | ||||||||||||
| Per Share | Without option to purchase additional shares exercise |
With full option to purchase additional shares exercise |
||||||||||
| Public Offering Price |
$ | $ | $ | |||||||||
| Underwriting discounts and commissions to be paid by us |
$ | $ | $ | |||||||||
| Proceeds, before expenses, to us |
$ | $ | $ | |||||||||
| Proceeds, before expenses, to the selling stockholder |
$ | $ | $ | |||||||||
The expenses of the offering, not including the underwriting discounts and commissions, are estimated at approximately $8.0 million and are payable by us. We have agreed to reimburse the underwriters for certain expenses. The underwriters may offer and sell shares through certain of their affiliates or other registered broker-dealers or selling agents.
The underwriters are offering the shares of Common Stock, subject to prior sale, when, as and if issued to and accepted by them, subject to approval of legal matters by their counsel, including the validity of the shares of Common Stock, and other conditions contained in the underwriting agreement, such as the receipt by the underwriters of officers certificates and legal opinions. The underwriters reserve the right to withdraw, cancel or modify offers to the public and to reject orders in whole or in part.
We and the selling stockholder have agreed to indemnify the several underwriters against certain liabilities, including liabilities under the Securities Act, or to contribute to payments the underwriters may be required to make in respect of those liabilities.
The cornerstone investor has indicated an interest in purchasing up to an aggregate of $70 million in shares of Common Stock in this offering at the initial public offering price. The shares of Common Stock to be purchased by the cornerstone investor will not be subject to a lock-up agreement with the underwriters. Because indications of interest are not binding agreements or commitments to purchase, the cornerstone investor may determine to purchase more, less or no shares in this offering or the underwriters may determine to sell more, less or no shares to the cornerstone investor. The underwriters will receive the same discount on any of our shares of Common Stock purchased by the cornerstone investor as they will from any other shares of Common Stock sold to the public in this offering.
No Sales of Similar Securities
We have agreed with the underwriters from the date of this prospectus through the date that is 180 days after the date of this prospectus (the Lock-Up Period), not to (1) offer, pledge, sell, contract to sell, sell any option or contract to purchase, purchase any option or contract to sell, grant any option, right or warrant to purchase, lend, or otherwise transfer or dispose of, directly or indirectly, any shares of our Common Stock or any securities convertible into or exercisable or exchangeable for our Common Stock or (2) enter into any swap or other arrangement that transfers to another, in whole or in part, any of the economic consequences of ownership of our Common Stock, whether any such transaction described in clause (1) or (2) above is to be settled by delivery of our Common Stock or such other securities, in cash or otherwise or (3) file any registration statement with the SEC relating to the offering of any shares of our Common Stock or any securities convertible into or exercisable or exchangeable for our Common Stock, unless we obtain the prior written consent of any two of Morgan Stanley & Co. LLC, Goldman Sachs & Co. LLC and J.P. Morgan Securities LLC on behalf of the underwriters.
234
Table of Contents
The foregoing restrictions shall not apply to (A) the shares of our Common Stock contemplated by this prospectus, (B) the issuance by us of shares of our Common Stock, upon the exercise of an option or warrant, vesting or settlement of restricted stock or restricted stock units or the conversion of a security outstanding on the date hereof; provided that we shall cause each recipient, on or prior to the issuance, exercise, vesting or settlement of any such grants or shares of Common Stock, to sign and deliver a lock-up agreement for the balance of the Lock-Up Period, (C) certain grants of stock options, stock awards, restricted stock, restricted stock units or other equity awards and the issuance of Common Stock or securities convertible into or exercisable for Common Stock (whether upon the exercise of stock options or otherwise) to our employees, officers, directors, advisors or consultants of pursuant to the terms of a plan in effect on the date hereof; provided that we shall cause each recipient, on or prior to the issuance of any such grants or shares of Common Stock, to sign and deliver a lock-up agreement for the balance of the Lock-Up Period, (D) facilitating the establishment of a trading plan on behalf of any of our shareholders, officers or directors of pursuant to Rule 10b5-1 under the Exchange Act for the transfer of shares of Common Stock; provided that (i) such plan does not provide for the transfer of Common Stock during the Lock-Up Period and (ii) to the extent a public announcement or filing under the Exchange Act, if any, is required of or voluntarily made by or on our behalf regarding the establishment of such plan, such announcement or filing shall include a statement to the effect that no transfer of Common Stock may be made under such plan during the Lock-Up Period, (E) the filing of any registration statement on Form S-8 relating to certain securities (i) granted or to be granted pursuant to any plan in effect on the date hereof or (ii) otherwise eligible to be included on a registration statement on Form S-8, (F) the offer or issuance or agreement to issue by us of our Common Stock or securities convertible into, exercisable for or which are otherwise exchangeable for or represent the right to receive Common Stock in connection with an acquisition, merger, joint venture, strategic alliance, commercial or other collaborative relationship or the acquisition or license by us or any of our subsidiaries of the securities, business, property or other assets of another person or entity or pursuant to any employee benefit plan as assumed by us in connection with any such acquisition or transaction; provided that (i) the aggregate number of shares of Common Stock, securities convertible into, exercisable for or which are otherwise exchangeable for or represent the right to receive Common Stock that we may sell or issue or agree to sell or issue pursuant to this clause (F) shall not exceed 10.0% of the total number of shares of Common Stock outstanding immediately following the issuance of the shares to be issued under this prospectus, and (ii) we shall cause each recipient of such shares, on or prior to the issuance of any such shares of Common Stock, to sign and deliver a lock-up agreement for the balance of the Lock-Up Period or (G) the issuance of any shares of Common Stock in connection with the Offering Reorganization Transactions in accordance with our certificate of incorporation; provided that (i) we shall cause each recipient of such shares, on or prior to the issuance of any such shares of Common Stock, to sign and deliver a lock-up agreement for the balance of the Lock-Up Period and (ii) (a) to the extent any filing by, or on behalf of, any party shall be required to be made with respect to such receipt or such transfer pursuant to Section 16(a) of the Exchange Act, such filing shall clearly indicate in the footnotes thereto that such receipt or transfer is being made pursuant to the circumstances described in this clause (G), and (b) no other public announcement or filing shall be required or shall be voluntarily made with respect to such receipt or such transfer during the Lock-Up Period.
Additionally, all of our directors, executive officers, the selling stockholder and holders of substantially all of the outstanding Common Stock of Ingram Micro Holding Corporation immediately prior to this offering, have entered into lock-up agreements with the underwriters, pursuant to which the parties have agreed that, without the prior written consent of any two of Morgan Stanley & Co. LLC, Goldman Sachs & Co. LLC and J.P. Morgan Securities LLC on behalf of the underwriters, they will not, during the Lock-Up Period, (1) offer, pledge, sell, contract to sell, sell any option or contract to purchase, purchase any option or contract to sell, grant any option, right or warrant to purchase, lend, or otherwise transfer or dispose of, directly or indirectly, any shares of our Common Stock beneficially owned by the signatory that are convertible into or exercisable or exchangeable for Common Stock (such shares of Common Stock, options, rights, warrants or other securities, collectively, Lock-Up Securities) or (2) enter into any swap or other arrangement that transfers to another, in whole or in part, any of the economic consequences of ownership of the Common Stock, whether any such transaction described in clause (1) or (2) above is to be settled by delivery of Common Stock or such other securities, in cash or otherwise. The foregoing restrictions will not apply to (A) transactions relating to Lock-Up Securities +acquired
235
Table of Contents
in open market transactions after the completion of this offering; provided that no filing under Section 16(a) of the Exchange Act shall be required or shall be voluntarily made in connection with subsequent sales of Common Stock or other securities acquired in such open market transactions; (B) transfers of Lock-Up Securities (i) as a bona fide gift, (ii) to any member of the signatorys immediate family or to any trust for the direct or indirect benefit of the signatory or the immediate family of the signatory, (iii) upon death or by will, testamentary document or intestate succession to the legal representative, heir, beneficiary or a member of the immediate family of the signatory, (iv) by operation of law, pursuant to a qualified domestic order or in connection with a divorce settlement or (v) to a nominee or custodian of a person or entity to whom a disposition or transfer would be permissible under clauses (i) through (iv); provided that (a) each donee or transferee shall sign and deliver a lock-up agreement for the balance of the Lock-Up Period and (b) (1) if any filing under Section 16(a) of the Exchange Act, or other public filing or disclosure, is legally required, such filing or disclosure shall clearly indicate in the footnotes thereto that the filing relates to circumstances described in this clause, and (2) no other public announcement or filing shall be voluntarily made during the Lock-Up Period; (C) distributions, transfers or dispositions of Lock-Up Securities (i) to limited partners, general partners, members, stockholders or holders of similar equity interests of the signatory, or (ii) to another corporation, partnership, limited liability company, trust or other business entity that is an affiliate (as defined in Rule 405 promulgated under the Securities Act) of the signatory, or to any investment fund or other entity controlling, controlled by, managing or managed by or under common control or common investment management with the signatory or affiliates of the signatory; provided that in the case of any distribution, transfer or disposition pursuant to this clause, (a) each donee or transferee shall sign and deliver a lock-up agreement for the balance of the Lock-Up Period and (b) (1) if any filing under Section 16(a) of the Exchange Act, or other public filing or disclosure, is legally required, such filing or disclosure shall clearly indicate in the footnotes thereto that the filing relates to circumstances described in this clause, and (2) no other public announcement or filing shall be voluntarily made during the Lock-Up Period; (D) establishing of a trading plan on behalf of any of our shareholders, officers or directors pursuant to Rule 10b5 1 under the Exchange Act for the transfer of shares of Common Stock; provided that (i) such plan does not provide for the transfer of Common Stock during the Lock-Up Period and (ii) to the extent a public announcement or filing under the Exchange Act, if any, is required of or voluntarily made by or on behalf of the signatory or us regarding the establishment of such plan, such announcement or filing shall include a statement to the effect that no transfer of Common Stock may be made under such plan during the Lock-Up Period; (E) transfers or sales to us from an employee in connection with the repurchase of Lock-Up Securities in connection with the termination of the signatorys employment with us pursuant to contractual agreements with us that provides us with a right to purchase such shares; provided that (1) any filing required to be made during the Lock-Up Period pursuant to Section 16(a) of the Exchange Act or Item 703 of Regulation S-K shall clearly indicate in the footnotes thereto that such transfer is being made pursuant to the circumstances described in this clause, and (2) no other public announcement or filing shall be voluntarily made during the Lock-Up Period; (F) (i) the receipt by the signatory from us of Lock-Up Securities upon the exercise, vesting or settlement of options, restricted stock units or other equity awards granted under a stock incentive plan or other equity award plan, which plan is established prior to the date of this prospectus and is described in the preliminary prospectus relating to the shares included in the registration statement immediately prior to the time the underwriting agreement is executed and this prospectus, or warrants to purchase shares of Common Stock, insofar as such options, restricted stock units or warrants are outstanding as of the date of this prospectus and are disclosed in this prospectus or (ii) the transfer of shares of Lock-Up Securities to us upon a vesting or settlement event of our restricted stock units or Lock-Up Securities or upon the exercise of options to purchase our securities on a cashless or net exercise basis to the extent permitted by the instruments representing such options (and any transfer to us necessary in respect of such amount needed for the payment of taxes, including estimated taxes and withholding tax and remittance obligations, due as a result of such vesting, settlement or exercise whether by means of a net settlement or otherwise) so long as such vesting, settlement, cashless exercise or net exercise is effected solely by the surrender of outstanding options (or the Common Stock issuable upon the exercise thereof) or shares of Common Stock to us and our cancellation of all or a portion thereof to pay the exercise price and/or withholding tax and remittance obligations in connection with the vesting, settlement or exercise of the restricted stock unit, option or other equity award; provided that (a) the Lock-Up Securities that are so received upon such vesting, settlement or exercise of the restricted stock unit, option, warrants or other equity award will be subject to the terms of this
236
Table of Contents
agreement for the duration of the Lock-Up Period and (b) to the extent any filing by, or on behalf of, any party (donor, donee, transferor or transferee) shall be required to be made with respect to such receipt or such transfer pursuant to Section 16(a) of the Exchange Act, such filing shall clearly indicate in the footnotes thereto that such receipt or transfer is being made pursuant to the circumstances described in this clause; (G) transfers of shares of Lock-Up Securities pursuant to a bona fide third party tender offer, merger, consolidation or other similar transaction involving certain change of control events that are open to all holders of our capital stock and have been approved by our board of directors (including, without limitation, entering into any lock-up, voting or similar agreement pursuant to which the signatory may agree to transfer, sell, tender or otherwise dispose of the signatorys securities in connection with any such transaction, or vote securities in favor of any such transaction); provided that in the event that such third party tender offer, merger, consolidation or other such similar transaction is not completed, the Lock-Up Securities owned by the signatory shall remain subject to the restrictions contained in the lock-up agreement for the duration of the Lock-Up Period; and (H) transfers of Lock-Up Securities in connection with the Offering Reorganization Transactions as described in the registration statement, the preliminary prospectus relating to the shares included in the registration statement immediately prior to the time the underwriting agreement is executed and this prospectus; provided that (i) such shares of Common Stock received in the Offering Reorganization Transactions shall be subject to the terms of the lock-up agreement for the duration of the Lock-Up Period and (ii) (a) to the extent any filing by, or on behalf of, any party (donor, donee, transferor or transferee) shall be required to be made with respect to such receipt or such transfer pursuant to Section 16(a) of the Exchange Act, such filing shall clearly indicate in the footnotes thereto that such receipt or transfer is being made pursuant to the circumstances described in this clause, and (b) no other public announcement or filing shall be required or shall be voluntarily made with respect to such receipt or such transfer during the Lock-Up Period.
Listing
We have applied to have our Common Stock listed on the New York Stock Exchange (the NYSE) under the symbol INGM, and we expect that the shares will be approved for listing on the NYSE under such symbol.
Before this offering, there has been no public market for our Common Stock. The initial public offering price will be determined through negotiations among us, the selling stockholder and the representatives. In addition to prevailing market conditions, the factors to be considered in determining the initial public offering price are:
| | The recent market prices of, and the demand for, publicly traded common stock of generally comparable companies. |
| | The present state of our development, results of operations and our current financial condition. |
| | The history of, and prospects for, the industry in which we compete. |
| | The ability of our management. |
| | The prospects for our future earnings. |
| | The general condition of the securities markets at the time of this offering. |
| | Our historical performance, estimates of our business potential and earnings prospects, an assessment of our management and the consideration of the above factors in relation to the market valuation of companies in related businesses. |
We cannot assure you that the initial public offering price will correspond to the price at which our Common Stock will trade in the public market subsequent to this offering or that an active trading market for our Common Stock will develop and continue after this offering.
237
Table of Contents
Price Stabilization, Short Positions and Penalty Bids
In connection with the offering, the underwriters may purchase and sell shares of Common Stock in the open market. These transactions may include short sales, stabilizing transactions and purchases to cover positions created by short sales. Short sales involve the sale by the underwriters of a greater number of shares than they are required to purchase in the offering, and a short position represents the amount of such sales that have not been covered by subsequent purchases. A covered short position is a short position that is not greater than the amount of additional shares for which the underwriters option described above may be exercised. The underwriters may cover any covered short position by either exercising their option to purchase additional shares or purchasing shares in the open market. In determining the source of shares to cover the covered short position, the underwriters will consider, among other things, the price of shares available for purchase in the open market as compared to the price at which they may purchase additional shares pursuant to the option described above. Naked short sales are any short sales that create a short position greater than the amount of additional shares for which the option described above may be exercised. The underwriters must cover any such naked short position by purchasing shares in the open market. A naked short position is more likely to be created if the underwriters are concerned that there may be downward pressure on the price of our Common Stock in the open market after pricing that could adversely affect investors who purchase in the offering. Stabilizing transactions consist of various bids for or purchases of Common Stock made by the underwriters in the open market prior to the completion of the offering.
The underwriters may also impose a penalty bid. This occurs when a particular underwriter repays to the underwriters a portion of the underwriting discount received by it because the representatives have repurchased shares sold by or for the account of such underwriter in stabilizing or short covering transactions.
Purchases to cover a short position and stabilizing transactions, as well as other purchases by the underwriters for their own accounts, may have the effect of preventing or delaying a decline in the market price of our Common Stock, and together with the imposition of the penalty bid, may stabilize, maintain or otherwise affect the market price of our Common Stock. As a result, the price of our Common Stock may be higher than the price that otherwise might exist in the open market. The underwriters are not required to engage in these activities and may end any of these activities at any time. These transactions may be effected on Nasdaq, the NYSE, in the over-the-counter market or otherwise.
Neither we, the selling stockholder nor any of the underwriters make any representation or prediction as to the direction or magnitude of any effect that the transactions described above may have on the price of our common stock. In addition, neither we, the selling stockholder nor any of the underwriters make any representation that the representatives will engage in these transactions or that these transactions, once commenced, will not be discontinued without notice.
Electronic Distribution
In connection with the offering, certain of the underwriters or securities dealers may distribute prospectuses by electronic means, such as e-mail.
Other Relationships
The underwriters and their respective affiliates are full service financial institutions engaged in various activities, which may include sales and trading, commercial and investment banking, advisory, investment management, investment research, principal investment, hedging, market making, brokerage and other financial and non-financial activities and services. Certain of the underwriters and their respective affiliates have provided, and may in the future provide, a variety of these services to the issuer, the selling stockholder and to persons and entities with relationships with the issuer or the selling stockholder, for which they received or will receive customary fees and expenses.
238
Table of Contents
In the ordinary course of their various business activities, the underwriters and their respective affiliates, officers, directors and associates may purchase, sell or hold a broad array of investments and actively trade securities, derivatives, loans, commodities, currencies, credit default swaps and other financial instruments for their own account and for the accounts of their consumers, and such investment and trading activities may involve or relate to assets, securities and/or instruments of the issuer (directly, as collateral securing other obligations or otherwise) and/or persons and entities with relationships with the issuer. The underwriters and their respective affiliates may also communicate independent investment recommendations, market color or trading ideas and/or publish or express independent research views in respect of such assets, securities or instruments and may at any time hold, or recommend to clients that they should acquire, long and/or short positions in such assets, securities and instruments.
Some of the underwriters and their affiliates have engaged in, and may in the future engage in, investment banking and other commercial dealings in the ordinary course of business with us or our affiliates. They have received, or may in the future receive, customary fees and commissions for these transactions.
Furthermore, Morgan Stanley Bank, N.A., an affiliate of Morgan Stanley & Co. LLC, JPMorgan Chase Bank, N.A., an affiliate of J.P. Morgan Securities LLC, Bank of America, N.A., an affiliate of BofA Securities, Inc., Deutsche Bank AG New York Branch and Deutsche Bank AG Canada Branch, both affiliates of Deutsche Bank Securities Inc., and Stifel Bank & Trust, an affiliate of Stifel, Nicolaus & Company, Incorporated, each an underwriter of this offering, are lenders, issuing banks and joint lead arrangers and bookrunners under our ABL Credit Agreement and are lenders and joint lead arrangers and bookrunners under our Term Loan Credit Agreement, and accordingly have received and are entitled to receive fees and expenses in connection therewith. In addition, Goldman Sachs Bank USA, an affiliate of Goldman Sachs & Co. LLC, Royal Bank of Canada, an affiliate of RBC Capital Markets, LLC, BNP Paribas, an affiliate of BNP Paribas Securities Corp. and Fifth Third Bank, National Association, an affiliate of Fifth Third Securities, Inc., each an underwriter of this offering, are lenders, issuing banks and joint lead arrangers and bookrunners under our ABL Credit Agreement, and accordingly have received and are entitled to receive fees and expenses in connection therewith. In addition, JPMorgan Chase Bank, N.A., an affiliate of J.P. Morgan Securities LLC, an underwriter of this offering, serves as the swingline lender, administrative agent and collateral agent under our ABL Credit Agreement and as administrative agent and collateral agent under our Term Loan Credit Agreement, and accordingly has received and is entitled to fees and expenses in connection therewith. In addition, affiliates of certain of the underwriters may also be holders of our other debt. In addition, Morgan Stanley & Co. LLC, J.P. Morgan Securities LLC, BofA Securities, Inc., Deutsche Bank Securities Inc., RBC Capital Markets, LLC and Stifel, Nicolaus & Company, Incorporated also acted as initial purchasers and joint book-running managers of our 2029 Notes and may have received customary fees in connection therewith. Affiliates of Morgan Stanley & Co. LLC and J.P. Morgan Securities LLC also served as financial advisors to the Company with respect to the Imola Mergers and the CLS Sale, and have received and may receive in the future customary fees and expenses in connection therewith.
In addition, on or about October 1, 2024, JPMorgan Chase Bank, N.A. held approximately $51,015,900 of term loans outstanding under the Term Loan Credit Facility (which is approximately 4.40% of the outstanding borrowings thereunder). On or about October 1, 2024, Jefferies Finance LLC held approximately $6,262,700 of term loans outstanding under the Term Loan Credit Facility (which is approximately 0.54% of the outstanding borrowings thereunder). Raymond James Bank, an affiliate of Raymond James & Associates, Inc., an underwriter of this offering, is a lender under the Term Loan Credit Facility. On or about October 1, 2024, Raymond James Bank held approximately $25,000,000 of term loans outstanding under the Term Loan Credit Facility (which is approximately 2.16% of the outstanding borrowings thereunder). On or about October 1, 2024, Stifel Bank & Trust held approximately $7,897,600 of term loans outstanding under the Term Loan Credit Facility (which is approximately 0.68% of the outstanding borrowings thereunder). As a result of the foregoing, in the event we repay a portion of the outstanding borrowings under the Term Loan Credit Facility with the net proceeds of this offering as further described under Use of Proceeds, then neither J.P. Morgan Securities LLC, Jefferies LLC, Raymond James & Associates, Inc., Stifel, Nicolaus & Company, Incorporated nor any of the other underwriters will have a conflict of interest with us within the meaning of Rule 5121, as administered by FINRA, as none of
239
Table of Contents
the underwriters are expected to receive more than 5% of the proceeds of this offering. See Description of Material Indebtedness and Use of Proceeds.
In addition, following the primary closing of the CLS Sale, we used a portion of the proceeds therefrom to repay all of the outstanding borrowings under the ABL Term Loan Facility. See SummaryCLS Sale. Morgan Stanley Bank, N.A., an affiliate of Morgan Stanley & Co. LLC, JPMorgan Chase Bank, N.A., an affiliate of J.P. Morgan Securities LLC, Royal Bank of Canada, an affiliate of RBC Capital Markets, LLC, and Stifel Bank & Trust, an affiliate of Stifel, Nicolaus & Company, Incorporated each an underwriter of this offering, are lenders, agents and joint lead arrangers and bookrunners under the ABL Term Loan Facility. As a result of the use of proceeds from the CLS Sale, such affiliates of the underwriters received a portion of the proceeds from the CLS Sale. See SummaryCLS Sale and Description of Material Indebtedness.
Reserved Share Program
At our request, an affiliate of BofA Securities, Inc., a participating underwriter, has reserved for sale, at the initial public offering price, up to 5% of the shares of Common Stock offered by this prospectus for sale to some of our directors, officers and employees, as well as to certain employees of Platinum and/or Platinum Advisors. If these persons purchase reserved shares it will reduce the number of shares available for sale to the general public. Any reserved shares that are not so purchased will be offered by the underwriters to the general public on the same terms as the other shares of Common Stock offered by this prospectus. If any reserved shares are purchased by persons who are subject to lock-up restrictions, such shares of Common Stock will be subject to the lock-up restrictions pursuant to the lock-up agreements as further described herein.
Selling Restrictions
European Economic Area
This prospectus is not a prospectus for the purposes of the Prospectus Regulation (as defined below). This prospectus has been prepared on the basis that any offer of shares in any Member State of the EEA will be made pursuant to an exemption under the Prospectus Regulation from the requirement to publish a prospectus for offers of shares. Accordingly any person making or intending to make an offer in that Member State of shares which are the subject of the offering contemplated in this prospectus may only do so in circumstances in which no obligation arises for us or any of the underwriters to publish a prospectus pursuant to Article 3 of the Prospectus Regulation in relation to such offer. Neither we nor the underwriters have authorized, nor do they authorize, the making of any offer of shares in circumstances in which an obligation arises for us or the underwriters to publish or supplement a prospectus for such offer. The expression Prospectus Regulation means Regulation (EU) 2017/1129 as it forms part of domestic law by virtue of the European Union (Withdrawal) Act 2018.
No shares have been offered or will be offered pursuant to the offering to the public in any Member State of the EEA prior to the publication of a prospectus in relation to the shares other than:
| | to any legal entity which is a qualified investor as defined under Article 2 of the Prospectus Regulation; |
| | to fewer than 150 natural or legal persons (other than qualified investors as defined under Article 2 of the Prospectus Regulation), subject to obtaining the prior consent of the representative for any such offer; or |
| | in any other circumstances falling within Article 1(4) of the Prospectus Regulation, |
provided that no such offer of shares shall require us or any underwriters to publish a prospectus pursuant to Article 3 of the Prospectus Regulation. For the purposes of this provision, the expression an offer to the public in relation to any shares in any Member State means the communication in any form and by any means of sufficient information on the terms of the offer and the shares to be offered so as to enable an investor to decide to purchase or subscribe for the shares.
240
Table of Contents
Prohibition of Sales to United Kingdom Investors
In the United Kingdom, this prospectus is not a prospectus for the purposes of the UK version of Regulation (EU) No 2017/1129 as amended by The Prospectus (Amendment etc.) (EU Exit) Regulations 2019, which is part of UK law by virtue of the European Union (Withdrawal) Act 2018 (the UK Prospectus Regulation). This prospectus has been prepared on the basis that any offer of shares in the United Kingdom will be made pursuant to an exemption under the UK Prospectus Regulation from the requirement to publish a prospectus for offers of shares. Accordingly any person making or intending to make an offer in the United Kingdom of shares which are the subject of the offering contemplated in this prospectus may only do so in circumstances in which no obligation arises for us or any of the underwriters to publish a prospectus pursuant to Article 3 of the UK Prospectus Regulation in relation to such offer. Neither we nor the underwriters have authorized, nor do they authorize, the making of any offer of shares in circumstances in which an obligation arises for us or the underwriters to publish or supplement a prospectus for such offer.
Notice to Prospective Investors in the United Kingdom
No shares have been offered or will be offered pursuant to the offering to the public in the United Kingdom prior to the publication of a prospectus in relation to the shares which has been approved by the Financial Conduct Authority, except that the shares may be offered to the public in the United Kingdom at any time:
| | to any legal entity which is a qualified investor as defined under Article 2 of the UK Prospectus Regulation; |
| | to fewer than 150 natural or legal persons (other than qualified investors as defined under Article 2 of the UK Prospectus Regulation), subject to obtaining the prior consent of the representative for any such offer; or |
| | in any other circumstances falling within Section 86 of the Financial Services and Markets Act 2000 (the FSMA), |
provided that no such offer of the shares shall require us or any underwriter to publish a prospectus pursuant to Section 85 of the FSMA or supplement a prospectus pursuant to Article 23 of the UK Prospectus Regulation. For the purposes of this provision, the expression an offer to the public in relation to the shares in the United Kingdom means the communication in any form and by any means of sufficient information on the terms of the offer and any shares to be offered so as to enable an investor to decide to purchase or subscribe for any shares.
Any invitation or inducement to engage in investment activity (within the meaning of Section 21 of the FSMA) in connection with the issue or sale of the shares may only be communicated or caused to be communicated in circumstances in which Section 21(1) of the FSMA does not apply to us.
All applicable provisions of the FSMA must be complied with in respect to anything done by any person in relation to the shares of our common stock in, from or otherwise involving the United Kingdom.
Canada
The securities may be sold in Canada only to purchasers purchasing, or deemed to be purchasing, as principal that are accredited investors, as defined in National Instrument 45-106 Prospectus Exemptions or subsection 73.3(1) of the Securities Act (Ontario), and are permitted clients, as defined in National Instrument 31-103 Registration Requirements, Exemptions, and Ongoing Registrant Obligations. Any resale of the securities must be made in accordance with an exemption from, or in a transaction not subject to, the prospectus requirements of applicable securities laws.
Securities legislation in certain provinces or territories of Canada may provide a purchaser with remedies for rescission or damages if this offering memorandum (including any amendment thereto) contains a
241
Table of Contents
misrepresentation, provided that the remedies for rescission or damages are exercised by the purchaser within the time limit prescribed by the securities legislation of the purchasers province or territory. The purchaser should refer to any applicable provisions of the securities legislation of the purchasers province or territory of these rights or consult with a legal advisor.
Pursuant to section 3A.3 of National Instrument 33-105 Underwriting Conflicts (NI 33-105), the underwriters are not required to comply with the disclosure requirements of NI 33-105 regarding underwriter conflicts of interest in connection with this offering.
Singapore
This prospectus has not been registered as a prospectus with the Monetary Authority of Singapore. Accordingly, shares of our Common Stock were not offered or sold or caused to be made the subject of an invitation for subscription or purchase and will not be offered or sold or caused to be made the subject of an invitation for subscription or purchase, and this prospectus or any other document or material in connection with the offer or sale, or invitation for subscription or purchase, of shares of our Common Stock, has not been circulated or distributed, nor will it be circulated or distributed, whether directly or indirectly, to any person in Singapore other than (i) to an institutional investor (as defined in Section 4A of the Securities and Futures Act (Chapter 289) of Singapore, as modified or amended from time to time (the SFA)) pursuant to Section 274 of the SFA, (ii) to a relevant person (as defined in Section 275(2) of the SFA) pursuant to Section 275(1) of the SFA, or any person pursuant to Section 275(1A) of the SFA, and in accordance with the conditions specified in Section 275 of the SFA or (iii) otherwise pursuant to, and in accordance with the conditions of, any other applicable provision of the SFA.
Where shares of our Common Stock are subscribed or purchased under Section 275 of the SFA by a relevant person which is:
| | a corporation (which is not an accredited investor (as defined in Section 4A of the SFA)) the sole business of which is to hold investments and the entire share capital of which is owned by one or more individuals, each of whom is an accredited investor; or |
| | a trust (where the trustee is not an accredited investor) whose sole purpose is to hold investments and each beneficiary of the trust is an individual who is an accredited investor, |
securities or securities-based derivatives contracts (each term as defined in Section 2(1) of the SFA) of that corporation or the beneficiaries rights and interest (howsoever described) in that trust shall not be transferred within six months after that corporation or that trust has acquired the shares of our Common Stock pursuant to an offer made under Section 275 of the SFA, except:
| | to an institutional investor or to a relevant person, or to any person arising from an offer referred to in Section 275(1A) or Section 276(4)(i)(B) of the SFA; |
| | where no consideration is or will be given for the transfer; |
| | where the transfer is by operation of law; |
| | as specified in Section 276(7) of the SFA; or |
| | as specified in Regulation 32 of the Securities and Futures (Offers of Investments) (Shares and Debentures) Regulations 2005 of Singapore. |
Singapore SFA Product ClassificationIn connection with Section 309B of the SFA and the CMP Regulations 2018, unless otherwise specified before an offer of shares of our Common Stock, we have determined, and hereby notify, all relevant persons (as defined in Section 309A(1) of the SFA), that shares of our Common Stock are prescribed capital markets products (as defined in the CMP Regulations 2018) and Excluded Investment Products (as defined in MAS Notice SFA 04-N12: Notice on the Sale of Investment Products and MAS Notice FAA-N16: Notice on Recommendations on Investment Products).
242
Table of Contents
Australia
No placement document, prospectus, product disclosure statement or other disclosure document has been lodged with the Australian Securities and Investments Commission in relation to this offering. This prospectus does not constitute a prospectus, product disclosure statement or other disclosure document under the Corporations Act 2001 (the Corporations Act) and does not purport to include the information required for a prospectus, product disclosure statement or other disclosure document under the Corporations Act.
Any offer in Australia of our common stock may only be made to persons, or Exempt Investors, who are sophisticated investors (within the meaning of section 708(8) of the Corporations Act), professional investors (within the meaning of section 708(11) of the Corporations Act), or otherwise pursuant to one or more exemptions contained in section 708 of the Corporations Act so that it is lawful to offer our Common Stock without disclosure to investors under Chapter 6D of the Corporations Act.
The Common Stock applied for by Exempt Investors in Australia must not be offered for sale in Australia in the period of 12 months after the date of allotment under the offering, except in circumstances where disclosure to investors under Chapter 6D of the Corporations Act would not be required pursuant to an exemption under section 708 of the Corporations Act or otherwise or where the offer is pursuant to a disclosure document which complies with Chapter 6D of the Corporations Act. Any person acquiring securities must observe such Australian on-sale restrictions. This prospectus contains general information only and does not take account of the investment objectives, financial situation or particular needs of any particular person. It does not contain any securities recommendations or financial product advice. Before making an investment decision, investors need to consider whether the information in this prospectus is appropriate to their needs, objectives and circumstances, and, if necessary, seek expert advice on those matters.
Dubai International Financial Centre
This prospectus relates to an Exempt Offer in accordance with the Offered Securities Rules of the Dubai Financial Services Authority (the DFSA). This prospectus is intended for distribution only to persons of a type specified in the Offered Securities Rules of the DFSA. It must not be delivered to, or relied on by, any other person. The DFSA has no responsibility for reviewing or verifying any documents in connection with Exempt Offers. The DFSA has not approved this prospectus nor taken steps to verify the information set forth herein and has no responsibility for the prospectus. The Common Stock to which this prospectus relates may be illiquid or subject to restrictions on its resale. Prospective purchasers of the Common Stock offered should conduct their own due diligence on the Common Stock. If you do not understand the contents of this prospectus you should consult an authorized financial advisor.
Switzerland
The shares of Common Stock may not be publicly offered in Switzerland and will not be listed on the SIX Swiss Exchange (the SIX) or on any other stock exchange or regulated trading facility in Switzerland. This document has been prepared without regard to the disclosure standards for issuance prospectuses under art. 652a or art. 1156 of the Swiss Code of Obligations or the disclosure standards for listing prospectuses under art. 27 ff. of the SIX Listing Rules or the listing rules of any other stock exchange or regulated trading facility in Switzerland. Neither this document nor any other offering or marketing material relating to the shares of common stock or the offering may be publicly distributed or otherwise made publicly available in Switzerland.
Neither this document nor any other offering or marketing material relating to the offering, or the shares of Common Stock have been or will be filed with or approved by any Swiss regulatory authority. In particular, this document will not be filed with, and the offer of the shares of Common Stock will not be supervised by, the Swiss Financial Market Supervisory Authority, and the offer of the shares of Common Stock has not been and will not be authorized under the Swiss Federal Act on Collective Investment Schemes (the CISA).
243
Table of Contents
Accordingly, no public distribution, offering or advertising, as defined in the CISA, its implementing ordinances and notices, and no distribution to any non-qualified investor, as defined in the CISA, its implementing ordinances and notices, shall be undertaken in or from Switzerland, and the investor protection afforded to acquirers of interests in collective investment schemes under the CISA does not extend to acquirers of the shares of our Common Stock.
Notice to Prospective Investors in Hong Kong
The shares have not been offered or sold and will not be offered or sold in Hong Kong, by means of any document, other than (a) to professional investors as defined in the Securities and Futures Ordinance (Cap. 571) of Hong Kong and any rules made under that Ordinance; or (b) in other circumstances which do not result in the document being a prospectus as defined in the Companies Ordinance (Cap. 32) of Hong Kong or which do not constitute an offer to the public within the meaning of that Ordinance. No advertisement, invitation or document relating to the shares has been or may be issued or has been or may be in the possession of any person for the purposes of issue, whether in Hong Kong or elsewhere, which is directed at, or the contents of which are likely to be accessed or read by, the public of Hong Kong (except if permitted to do so under the securities laws of Hong Kong) other than with respect to shares which are or are intended to be disposed of only to persons outside Hong Kong or only to professional investors as defined in the Securities and Futures Ordinance and any rules made under that Ordinance.
Notice to Prospective Investors in Japan
The shares have not been and will not be registered under the Financial Instruments and Exchange Law of Japan (Law No. 25 of 1948, as amended) and, accordingly, will not be offered or sold, directly or indirectly, in Japan, or for the benefit of any Japanese Person or to others for re-offering or resale, directly or indirectly, in Japan or to any Japanese Person, except in compliance with all applicable laws, regulations and ministerial guidelines promulgated by relevant Japanese governmental or regulatory authorities in effect at the relevant time. For the purposes of this paragraph, Japanese Person shall mean any person resident in Japan, including any corporation or other entity organized under the laws of Japan.
Brazil
The offer and sale of the shares of Common Stock have not been and will not be registered with the Brazilian Securities Commission (Comissão de Valores Mobiliários, or CVM) and, therefore, will not be carried out by any means that would constitute a public offering in Brazil under CVM Resolution No 160, dated 13 July 2022, as amended (CVM Resolution 160) or unauthorized distribution under Brazilian laws and regulations. The shares of Common Stock will be authorized for trading on organized non-Brazilian securities markets and may only be offered to Brazilian professional investors (as defined by applicable CVM regulation), who may only acquire the shares through a non-Brazilian account, with settlement outside Brazil in non-Brazilian currency. The trading of these shares on regulated securities markets in Brazil is prohibited.
Austria
No prospectus has been or will be submitted for approval to any Austrian regulatory authority or any competent securities regulator in the European Union or the European Economic Area in connection with the offering of the shares of Common Stock as contemplated by this prospectus. This offering is being made in Austria by reliance on the self-executing small offering exemption to the prospectus and disclosure requirements of the EU Prospectus Regulation 2017/1129. As such, this prospectus and any other material relating to the offering of the shares of Common Stock are confidential and only for the intended recipient.
Belgium
No prospectus has been or will be submitted for approval to any Belgian regulatory authority or any competent securities regulator in the European Union or the European Economic Area in connection with the
244
Table of Contents
offering of the shares of Common Stock as contemplated by this prospectus. This offering is being made in Belgium by reliance on the self-executing small offering exemption to the prospectus and disclosure requirements of the EU Prospectus Regulation 2017/1129. As such, this prospectus and any other material relating to the offering of the shares of Common Stock are confidential and only for the intended recipient.
Bulgaria
No prospectus has been or will be submitted for approval to any Bulgarian regulatory authority or any competent securities regulator in the European Union or the European Economic Area in connection with the offering of the shares of Common Stock as contemplated by this prospectus. This offering is being made in Bulgaria by reliance on the self-executing small offering exemption to the prospectus and disclosure requirements of the EU Prospectus Regulation 2017/1129. As such, this prospectus and any other material relating to the offering of the shares of Common Stock are confidential and only for the intended recipient.
Chile
This offering of the shares of Common Stock as contemplated by this prospectus conforms to general ruling N°336 of the Chilean Financial Market Commission (the CFMC), and deals with securities that are not registered in the registry of securities or in the registry of foreign securities of the CFMC. Accordingly, the shares offered for purchase under this offering are not subject to oversight by the CFMC, and the Company is not obligated to provide public information in Chile regarding the shares to be offered. Further, the shares offered for purchase under this offering will not be subject to any public offering requirements as long as such shares are not registered with the corresponding registry of securities in Chile. This prospectus and any other material relating to the offering of the shares of Common Stock are confidential and only for the intended recipient.
Colombia
This prospectus and any other material relating to the offering of the shares of Common Stock should not be interpreted as a public offer of securities in Colombia. Accordingly, shares of Common Stock are not and will not be registered with the Colombian registry of publicly traded securities (Registro Nacional de Valores y Emisores).
Denmark
No prospectus has been or will be submitted for approval to any Danish regulatory authority or any competent securities regulator in the European Union or the European Economic Area in connection with the offering of the shares of Common Stock as contemplated by this prospectus. This offering is being made in Denmark by reliance on the self-executing small offering exemption to the prospectus and disclosure requirements of the EU Prospectus Regulation 2017/1129. As such, this prospectus and any other material relating to the offering of the shares of Common Stock are confidential and only for the intended recipient.
France
No prospectus has been or will be submitted for approval to any French regulatory authority or any competent securities regulator in the European Union or the European Economic Area in connection with the offering of the shares of Common Stock as contemplated by this prospectus. This offering is being made in France by reliance on the self-executing small offering exemption to the prospectus and disclosure requirements of the EU Prospectus Regulation 2017/1129. As such, this prospectus and any other material relating to the offering of the shares of Common Stock are confidential and only for the intended recipient.
Germany
No prospectus has been or will be submitted for approval to any German regulatory authority or any competent securities regulator in the European Union or the European Economic Area in connection with the
245
Table of Contents
offering of the shares of Common Stock as contemplated by this prospectus. This offering is being made in Germany by reliance on the self-executing small offering exemption to the prospectus and disclosure requirements of the EU Prospectus Regulation 2017/1129. As such, this prospectus and any other material relating to the offering of the shares of Common Stock are confidential and only for the intended recipient.
Hungary
No prospectus has been or will be submitted for approval to any Hungarian regulatory authority or any competent securities regulator in the European Union or the European Economic Area in connection with the offering of the shares of Common Stock as contemplated by this prospectus. This offering is being made in Hungary by reliance on the self-executing small offering exemption to the prospectus and disclosure requirements of the EU Prospectus Regulation 2017/1129. As such, this prospectus and any other material relating to the offering of the shares of Common Stock are confidential and only for the intended recipient.
Italy
No prospectus has been or will be submitted for approval to any Italian regulatory authority or any competent securities regulator in the European Union or the European Economic Area in connection with the offering of the shares of Common Stock as contemplated by this prospectus. This offering is being made in Italy by reliance on the self-executing small offering exemption to the prospectus and disclosure requirements of the EU Prospectus Regulation 2017/1129. As such, this prospectus and any other material relating to the offering of the shares of Common Stock are confidential and only for the intended recipient.
Mexico
The shares of Common Stock have not been registered with the Securities National Registry maintained by the Mexican National Banking and Securities Commission and may not be offered or sold publicly in Mexico. This prospectus and any other material relating to the offering of the shares of Common Stock are confidential and only for the intended recipient, and may not be publicly distributed in Mexico.
New Zealand
This prospectus has not been registered, filed with, or approved by any New Zealand regulatory authority under the Financial Markets Conduct Act 2013 (New Zealand). This prospectus and any other material relating to the offering of the shares of Common Stock are principally governed by the laws of the United States rather than New Zealand law. The laws of the United States and the rules of the NYSE will set out how this offering of the shares of Common Stock must be made. There are differences in how financial products, such as the shares of Common Stock, are regulated under United States law as compared to New Zealand law.
The offeror and issuer of the financial products may not be subject in all respects to New Zealand law. The rights, remedies, and compensation arrangements available to New Zealand investors in United States financial products may also differ from the rights, remedies, and compensation arrangements for New Zealand financial products.
The shares of Common Stock can be traded on the NYSE. If you wish to trade the shares of Common Stock through the NYSE, you will have to make arrangements for a participant in the NYSE to sell the financial products on your behalf. The way in which NYSE operates, the regulation of participants in the NYSE, and the information available to you about the shares of Common Stock and local trading practices may differ from financial product markets that operate in New Zealand.
A copy of the overseas offer document has been lodged with the Registrar of Financial Service Providers. The overseas offer document may not contain all the information that a New Zealand lodged product disclosure statement is required to contain.
246
Table of Contents
The financial reporting requirements applying in New Zealand and those applying to the Company may be different, and the financial statements of the issuer may not be comparable in all respects with financial statements prepared in accordance with New Zealand law.
The tax treatment of the shares of Common Stock may not be the same as for New Zealand financial products.
If you are uncertain about whether this investment is appropriate for you, you should seek the advice of an appropriately qualified financial adviser.
Currency exchange risk: The offer to participate in this offering of the shares as contemplated by this prospectus may involve currency exchange risk. The currency for the shares of Common Stock is not New Zealand dollars. The value of the shares of Common Stock will go up or down according to changes in the exchange rate between that currency and New Zealand dollars. These changes may be significant. If you expect the shares of Common Stock to pay any amounts in a currency that is not New Zealand dollars, you may incur significant fees in having the funds credited to a bank account in New Zealand in New Zealand dollars.
Poland
No prospectus has been or will be submitted for approval to any Polish regulatory authority or any competent securities regulator in the European Union or the European Economic Area in connection with the offering of the shares of Common Stock as contemplated by this prospectus. This offering is being made in Poland by reliance on the self-executing small offering exemption to the prospectus and disclosure requirements of the EU Prospectus Regulation 2017/1129. As such, this prospectus and any other material relating to the offering of the shares of Common Stock are confidential and only for the intended recipient.
Portugal
No prospectus has been or will be submitted for approval to any Portuguese regulatory authority or any competent securities regulator in the European Union or the European Economic Area in connection with the offering of the shares of Common Stock as contemplated by this prospectus. This offering is being made in Portugal by reliance on the self-executing small offering exemption to the prospectus and disclosure requirements of the EU Prospectus Regulation 2017/1129. As such, this prospectus and any other material relating to the offering of the shares of Common Stock are confidential and only for the intended recipient.
Spain
No prospectus has been or will be submitted for approval to any Spanish regulatory authority or any competent securities regulator in the European Union or the European Economic Area in connection with the offering of the shares of Common Stock as contemplated by this prospectus. This offering is being made in Spain by reliance on the self-executing small offering exemption to the prospectus and disclosure requirements of the EU Prospectus Regulation 2017/1129. As such, this prospectus and any other material relating to the offering of the shares of Common Stock are confidential and only for the intended recipient.
Sweden
No prospectus has been or will be submitted for approval to any Swedish regulatory authority or any competent securities regulator in the European Union or the European Economic Area in connection with the offering of the shares of Common Stock as contemplated by this prospectus. This offering is being made in Sweden by reliance on the self-executing small offering exemption to the prospectus and disclosure requirements of the EU Prospectus Regulation 2017/1129. As such, this prospectus and any other material relating to the offering of the shares of Common Stock are confidential and only for the intended recipient.
247
Table of Contents
United Arab Emirates
Participation in the offering of the shares of Common Stock as contemplated by this prospectus is being made only to select individuals in the United Arab Emirates. This prospectus and any other offering or marketing materials related to the the offering of the shares of Common Stock are intended for distribution only to such select individuals and must not be delivered to, or relied on by, any other person. Prospective purchasers of the securities offered should conduct their own due diligence on the securities.
If you do not understand the contents of the offering of the shares of Common Stock or this prospectus, you should consult an authorized financial adviser. The Emirates Securities and Commodities Authority has no responsibility for reviewing or verifying any documents in connection with the offering of the shares of Common Stock. Neither the Ministry of Economy nor the Dubai Department of Economic Development have approved the offering of the shares of Common Stock or this prospectus nor taken steps to verify the information set out therein and have no responsibility for such documents.
248
Table of Contents
Certain legal matters with respect to the legality of the issuance of the shares of Common Stock offered by us and the selling stockholder by this prospectus will be passed upon for us by Willkie Farr & Gallagher LLP, New York, New York. The underwriters are being represented by Cahill Gordon & Reindel LLP, in connection with the offering.
249
Table of Contents
The financial statements of Ingram Micro Inc. (Predecessor) for the period from January 3, 2021 to July 2, 2021 included in this prospectus have been so included in reliance on the report of PricewaterhouseCoopers LLP (PwC), an independent registered public accounting firm, given on the authority of said firm as experts in auditing and accounting.
The financial statements of Ingram Micro Holding Corporation (Successor) (the Company) as of December 30, 2023 and December 31, 2022 and for each of the two years in the period ended December 30, 2023 and the period from July 3, 2021 to January 1, 2022 included in this prospectus have been so included in reliance on the report of PwC, an independent registered public accounting firm, given on the authority of said firm as experts in auditing and accounting.
PwC identified non-audit services impacting the period from January 2023 to August 2024. A member firm of PricewaterhouseCoopers International Limited (PwC Member Firm) and an unrelated third party jointly provided services, which included management functions at an immaterial branch of a wholly owned subsidiary of an entity under common control with the Company. These services were permissible under the applicable independence standards at the time the services were rendered but are inconsistent with SEC and Public Company Accounting Oversight Board (United States) independence rules. The services included remitting payments and filing documents with non-tax authorities on behalf of the branch.
PwC provided an overview of the facts and circumstances surrounding the non-audit services to the Audit Committee and the management team of the Company, including the entity involved, the nature of the non-audit services, the period over which they were provided, an approximation of the fees related to the non-audit services and other relevant factors.
The non-audit services were provided to an affiliate of the Company and not to the Company itself. None of the PwC Member Firms service engagement team members that performed the non-audit services have been or are members of the Companys PwC audit engagement team. The non-audit services did not place PwC in a position of auditing its own work, did not result in PwC performing any decision-making or supervisory functions for the Company, and did not place PwC in a position of being an advocate for the Company. The fees received in connection with the non-audit services were approximately $5,500 and are immaterial to PwC, the PwC Member Firm and the entity to which the non-audit services were provided.
Considering the facts presented, the Audit Committee of the Company and PwC have concluded (i) that the non-audit services noted above did not and would not impair PwC application of objective and impartial judgment on any matter encompassed within PwCs audit of the financial statements as of and for the year ended December 30, 2023, and (ii) that no reasonable investor would conclude otherwise.
250
Table of Contents
WHERE YOU CAN FIND MORE INFORMATION
We have filed with the SEC a registration statement on Form S-1 under the Securities Act with respect to the shares of Common Stock offered hereby. This prospectus, which constitutes a part of the registration statement, does not contain all of the information set forth in the registration statement or the exhibits filed therewith, certain portions of which are omitted as permitted by the rules and regulations of the SEC. For further information with respect to us and our Common Stock offered hereby, please refer to the registration statement and the exhibits filed therewith. Statements contained in this prospectus regarding the contents of any contract or any other document that is filed as an exhibit to the registration statement are not necessarily complete, and each such statement is qualified in all respects by reference to the full text of such contract or other document filed as an exhibit to the registration statement. Each of these statements is qualified in all respects by this reference.
Following the completion of this offering, we will become subject to the information and periodic reporting requirements of the Exchange Act and, in accordance therewith, we will file periodic reports, proxy statements and other information with the SEC. Our filings with the SEC will be available to the public on the SECs website at http://www.sec.gov. Those filings will also be available to the public on, or accessible through, our website (www.ingrammicro.com) under the heading Investor Relations. The information we file with the SEC or contained on or accessible through our corporate website or any other website that we may maintain is not part of this prospectus or the registration statement of which this prospectus is a part.
251
Table of Contents
| Page | ||||
| Audited Consolidated Financial Statements |
||||
| Report of Independent Registered Public Accounting Firm (Successor) |
F-2 | |||
| Report of Independent Registered Public Accounting Firm (Predecessor) |
F-4 | |||
| Consolidated Balance Sheets as of December 30, 2023 (Successor) and December 31, 2022 (Successor) |
F-5 | |||
| F-6 | ||||
| F-7 | ||||
| F-8 | ||||
| F-9 | ||||
| F-11 | ||||
| Schedules to the Audited Consolidated Financial Statements |
||||
| F-57 | ||||
| Unaudited Condensed Consolidated Financial Statements |
||||
| F-58 | ||||
| F-59 | ||||
| F-60 | ||||
| F-61 | ||||
| F-62 | ||||
| Notes to Unaudited Condensed Consolidated Financial Statements |
F-63 | |||
F-1
Table of Contents
Report of Independent Registered Public Accounting Firm
To the Board of Directors and Stockholders of Ingram Micro Holding Corporation
Opinion on the Financial Statements
We have audited the accompanying consolidated balance sheets of Ingram Micro Holding Corporation and its subsidiaries (Successor) (the Company) as of December 30, 2023 and December 31, 2022, and the related consolidated statements of income, comprehensive income, stockholders equity and cash flows for each of the two years in the period ended December 30, 2023 and for the period from July 3, 2021 to January 1, 2022, including the related notes and schedule of valuation and qualifying accounts for the each of the two years in the period ended December 30, 2023 and for the period from July 3, 2021 to January 1, 2022 listed in the index appearing on page F-1 (collectively referred to as the consolidated financial statements). In our opinion, the consolidated financial statements present fairly, in all material respects, the financial position of the Company as of December 30, 2023 and December 31, 2022, and the results of its operations and its cash flows for each of the two years in the period ended December 30, 2023 and for the period from July 3, 2021 to January 1, 2022 in conformity with accounting principles generally accepted in the United States of America.
Basis for Opinion
These consolidated financial statements are the responsibility of the Companys management. Our responsibility is to express an opinion on the Companys consolidated financial statements based on our audits. We are a public accounting firm registered with the Public Company Accounting Oversight Board (United States) (PCAOB) and are required to be independent with respect to the Company in accordance with the U.S. federal securities laws and the applicable rules and regulations of the Securities and Exchange Commission and the PCAOB.
We conducted our audits of these consolidated financial statements in accordance with the standards of the PCAOB. Those standards require that we plan and perform the audit to obtain reasonable assurance about whether the consolidated financial statements are free of material misstatement, whether due to error or fraud.
Our audits included performing procedures to assess the risks of material misstatement of the consolidated financial statements, whether due to error or fraud, and performing procedures that respond to those risks. Such procedures included examining, on a test basis, evidence regarding the amounts and disclosures in the consolidated financial statements. Our audits also included evaluating the accounting principles used and significant estimates made by management, as well as evaluating the overall presentation of the consolidated financial statements. We believe that our audits provide a reasonable basis for our opinion.
Critical Audit Matters
The critical audit matter communicated below is a matter arising from the current period audit of the consolidated financial statements that was communicated or required to be communicated to the audit committee and that (i) relates to accounts or disclosures that are material to the consolidated financial statements and (ii) involved our especially challenging, subjective, or complex judgments. The communication of critical audit matters does not alter in any way our opinion on the consolidated financial statements, taken as a whole, and we are not, by communicating the critical audit matter below, providing a separate opinion on the critical audit matter or on the accounts or disclosures to which it relates.
Distribution Services Revenue Recognition
As described in Note 2 to the consolidated financial statements, the Companys net sales was $48,040 million for the year ended December 30, 2023, of which a significant portion relates to distribution services revenue. In a distribution services model, the Company buys, holds title to, and sells technology products and provides
F-2
Table of Contents
services to resellers, referred to subsequently as customers, while also providing resellers with multi-vendor solutions, integration services, electronic commerce tools, marketing, financing, training and enablement, technical support, and inventory management. Revenue is recognized when the control of products is transferred to customers, which generally happens at the point of shipment or point of delivery.
The principal consideration for our determination that performing procedures relating to distribution services revenue recognition is a critical audit matter is a high degree of auditor effort in performing procedures related to distribution services revenue recognition.
Addressing the matter involved performing procedures and evaluating audit evidence in connection with forming our overall opinion on the consolidated financial statements. These procedures included, among others, evaluating, on a test basis, revenue recognized for distribution services transactions by obtaining and inspecting customer contracts, invoices, purchase orders, shipping documentation, cash receipts, and trade accounts receivable confirmations from customers, where applicable.
/s/ PricewaterhouseCoopers LLP
Irvine, California
March 13, 2024, except for the effects of the revision to the consolidated financial statements as of and for the fiscal year ended December 30, 2023 discussed in Note 2, as to which the date is September 6, 2024
We have served as the Companys auditor since at least 1994. We have not been able to determine the specific year we began serving as auditor of the Company.
F-3
Table of Contents
Report of Independent Registered Public Accounting Firm
To the Board of Directors and Stockholders of Ingram Micro Holding Corporation
Opinion on the Financial Statements
We have audited the accompanying consolidated statements of income, comprehensive income, stockholders equity and cash flows of Ingram Micro Inc. and its subsidiaries (Predecessor) (the Company) for the period from January 3, 2021 to July 2, 2021, including the related notes and schedule of valuation and qualifying accounts for the period from January 3, 2021 to July 2, 2021 listed in the index appearing on page F-1 (collectively referred to as the consolidated financial statements). In our opinion, the consolidated financial statements present fairly, in all material respects, the results of operations and cash flows of the Company for the period from January 3, 2021 to July 2, 2021 in conformity with accounting principles generally accepted in the United States of America.
Basis for Opinion
These consolidated financial statements are the responsibility of the Companys management. Our responsibility is to express an opinion on the Companys consolidated financial statements based on our audit. We are a public accounting firm registered with the Public Company Accounting Oversight Board (United States) (PCAOB) and are required to be independent with respect to the Company in accordance with the U.S. federal securities laws and the applicable rules and regulations of the Securities and Exchange Commission and the PCAOB.
We conducted our audit of these consolidated financial statements in accordance with the standards of the PCAOB and in accordance with auditing standards generally accepted in the United States of America. Those standards require that we plan and perform the audit to obtain reasonable assurance about whether the consolidated financial statements are free of material misstatement, whether due to error or fraud.
Our audit included performing procedures to assess the risks of material misstatement of the consolidated financial statements, whether due to error or fraud, and performing procedures that respond to those risks. Such procedures included examining, on a test basis, evidence regarding the amounts and disclosures in the consolidated financial statements. Our audit also included evaluating the accounting principles used and significant estimates made by management, as well as evaluating the overall presentation of the consolidated financial statements. We believe that our audit provides a reasonable basis for our opinion.
/s/ PricewaterhouseCoopers LLP
Irvine, California
April 12, 2022, except for the additional entity-wide disclosure of net sales by product category included in Note 12 to the consolidated financial statements, as to which the date is September 19, 2022, and except for the effects of the restatement discussed in Note 3 (not presented herein) to the consolidated financial statements appearing in the Companys seventh amendment to the draft registration statement on Form S-1, as to which the date is September 15, 2023
We have served as the Companys auditor since at least 1994. We have not been able to determine the specific year we began serving as auditor of the Company.
F-4
Table of Contents
INGRAM MICRO HOLDING CORPORATION
(Amounts in thousands, except par value and share data)
| Successor | Successor | |||||||
| December 31, 2022 | December 30, 2023 | |||||||
| ASSETS |
||||||||
| Current assets: |
||||||||
| Cash and cash equivalents |
$ | 1,320,137 | $ | 948,490 | ||||
| Trade accounts receivable (less allowances of $140,328 and $163,727, respectively) |
8,782,988 | 8,988,799 | ||||||
| Inventory |
5,357,929 | 4,659,624 | ||||||
| Other current assets |
713,631 | 757,404 | ||||||
|
|
|
|
|
|||||
| Total current assets |
16,174,685 | 15,354,317 | ||||||
| Property and equipment, net |
349,450 | 452,613 | ||||||
| Operating lease right-of-use assets |
372,648 | 430,705 | ||||||
| Goodwill |
844,736 | 851,780 | ||||||
| Intangible assets, net |
957,471 | 880,433 | ||||||
| Other assets |
388,985 | 450,466 | ||||||
|
|
|
|
|
|||||
| Total assets |
$ | 19,087,975 | $ | 18,420,314 | ||||
|
|
|
|
|
|||||
| LIABILITIES AND STOCKHOLDERS EQUITY |
||||||||
| Current liabilities: |
||||||||
| Accounts payable |
$ | 9,846,717 | $ | 9,230,439 | ||||
| Accrued expenses and other |
1,172,433 | 1,061,409 | ||||||
| Short-term debt and current maturities of long-term debt |
200,327 | 265,719 | ||||||
| Short-term operating lease liabilities |
88,258 | 105,564 | ||||||
|
|
|
|
|
|||||
| Total current liabilities |
11,307,735 | 10,663,131 | ||||||
| Long-term debt, less current maturities |
4,174,027 | 3,657,889 | ||||||
| Long-term operating lease liabilities, net of current portion |
322,671 | 366,139 | ||||||
| Other liabilities |
225,474 | 226,866 | ||||||
|
|
|
|
|
|||||
| Total liabilities |
16,029,907 | 14,914,025 | ||||||
|
|
|
|
|
|||||
| Commitments and contingencies (Note 10) |
||||||||
| Stockholders equity: |
||||||||
| Class A Common Stock, par value $0.01, 30,000 shares authorized at December 31, 2022 and December 30, 2023, and 26,382 shares issued and outstanding at December 31, 2022 and December 30, 2023 |
| | ||||||
| Class B Common Stock, par value $0.01, 300 shares authorized at December 31, 2022 and December 30, 2023, and 198 shares issued and outstanding at December 31, 2022 and December 30, 2023 |
| | ||||||
| Additional paid-in capital |
2,658,000 | 2,658,000 | ||||||
| Retained earnings |
737,526 | 1,079,776 | ||||||
| Accumulated other comprehensive loss |
(337,458 | ) | (231,487 | ) | ||||
|
|
|
|
|
|||||
| Total stockholders equity |
3,058,068 | 3,506,289 | ||||||
|
|
|
|
|
|||||
| Total liabilities and stockholders equity |
19,087,975 | 18,420,314 | ||||||
|
|
|
|
|
|||||
See accompanying notes to these consolidated financial statements.
F-5
Table of Contents
INGRAM MICRO HOLDING CORPORATION
CONSOLIDATED STATEMENTS OF INCOME
(Amounts in thousands, except per share data)
| Predecessor | Successor | Successor | Successor | |||||||||||||
| Period from January 3, 2021 to July 2, 2021 |
Period from July 3, 2021 to January 1, 2022 |
Fiscal Year Ended | Fiscal Year Ended | |||||||||||||
| 2022 | 2023 | |||||||||||||||
| Net sales |
$ | 26,406,869 | $ | 28,048,703 | $ | 50,824,490 | $ | 48,040,364 | ||||||||
| Cost of sales |
24,419,489 | 25,925,610 | 47,131,098 | 44,493,227 | ||||||||||||
|
|
|
|
|
|
|
|
|
|||||||||
| Gross profit |
1,987,380 | 2,123,093 | 3,693,392 | 3,547,137 | ||||||||||||
|
|
|
|
|
|
|
|
|
|||||||||
| Operating expenses (income): |
||||||||||||||||
| Selling, general and administrative |
1,459,364 | 1,684,170 | 2,716,234 | 2,583,993 | ||||||||||||
| Merger-related costs |
2,314 | 114,332 | 1,910 | | ||||||||||||
| Restructuring costs |
202 | 831 | 10,138 | 18,797 | ||||||||||||
| Gain on CLS Sale |
| | (2,283,820 | ) | | |||||||||||
|
|
|
|
|
|
|
|
|
|||||||||
| Total operating expenses |
1,461,880 | 1,799,333 | 444,462 | 2,602,790 | ||||||||||||
|
|
|
|
|
|
|
|
|
|||||||||
| Income from operations |
525,500 | 323,760 | 3,248,930 | 944,347 | ||||||||||||
|
|
|
|
|
|
|
|
|
|||||||||
| Other (income) expense: |
||||||||||||||||
| Interest income |
(11,744 | ) | (6,306 | ) | (22,911 | ) | (34,977 | ) | ||||||||
| Interest expense |
44,281 | 183,208 | 320,230 | 380,191 | ||||||||||||
| Net foreign currency exchange loss |
1,419 | 17,473 | 69,597 | 42,070 | ||||||||||||
| Other (income) expense |
(13,410 | ) | 12,628 | 67,473 | 34,562 | |||||||||||
|
|
|
|
|
|
|
|
|
|||||||||
| Total other (income) expense |
20,546 | 207,003 | 434,389 | 421,846 | ||||||||||||
|
|
|
|
|
|
|
|
|
|||||||||
| Income before income taxes |
504,954 | 116,757 | 2,814,541 | 522,501 | ||||||||||||
| Provision for income taxes |
126,479 | 20,023 | 420,052 | 169,789 | ||||||||||||
|
|
|
|
|
|
|
|
|
|||||||||
| Net income |
$ | 378,475 | $ | 96,734 | $ | 2,394,489 | $ | 352,712 | ||||||||
|
|
|
|
|
|
|
|
|
|||||||||
| Basic and diluted earnings per share for Class A and Class B shares |
$ | | $ | 3,654 | $ | 90,086 | $ | 13,270 | ||||||||
|
|
|
|
|
|
|
|
|
|||||||||
| Basic and diluted earnings per share for Common Stock |
$ | 3,784,750 | $ | | $ | | $ | | ||||||||
|
|
|
|
|
|
|
|
|
|||||||||
See accompanying notes to these consolidated financial statements.
F-6
Table of Contents
INGRAM MICRO HOLDING CORPORATION
CONSOLIDATED STATEMENTS OF COMPREHENSIVE INCOME
(Amounts in thousands)
| Predecessor | Successor | Successor | Successor | |||||||||||||
| Period from January 3, 2021 to July 2, 2021 |
Period from July 3, 2021 to January 1, 2022 |
Fiscal Year Ended | Fiscal Year Ended | |||||||||||||
| 2022 | 2023 | |||||||||||||||
| Net income |
$ | 378,475 | $ | 96,734 | $ | 2,394,489 | $ | 352,712 | ||||||||
|
|
|
|
|
|
|
|
|
|||||||||
| Other comprehensive (loss) income, net of tax |
||||||||||||||||
| Foreign currency translation adjustment |
(17,749 | ) | (61,305 | ) | (270,685 | ) | 103,596 | |||||||||
| Other |
| | (5,468 | ) | 2,375 | |||||||||||
|
|
|
|
|
|
|
|
|
|||||||||
| Other comprehensive (loss) income, net of tax |
(17,749 | ) | (61,305 | ) | (276,153 | ) | 105,971 | |||||||||
|
|
|
|
|
|
|
|
|
|||||||||
| Comprehensive income |
$ | 360,726 | $ | 35,429 | $ | 2,118,336 | $ | 458,683 | ||||||||
|
|
|
|
|
|
|
|
|
|||||||||
See accompanying notes to these consolidated financial statements.
F-7
Table of Contents
INGRAM MICRO HOLDING CORPORATION
CONSOLIDATED STATEMENTS OF STOCKHOLDERS EQUITY
(Amounts in thousands, except share data)
| Class A Common Stock |
Class B Common Stock |
Common Stock |
Additional Paid-in Capital |
Retained Earnings |
Accumulated Other Comprehensive Loss |
Total | ||||||||||||||||||||||||||||||||||
| Shares | Amount | Shares | Amount | Shares | Amount | |||||||||||||||||||||||||||||||||||
| Balance at January 2, 2021 (Predecessor) |
| | | | 100 | | 783,850 | 4,413,072 | (185,234 | ) | 5,011,688 | |||||||||||||||||||||||||||||
| Dividends declared |
| | | | | | | (215,182 | ) | | (215,182 | ) | ||||||||||||||||||||||||||||
| Net income |
| | | | | | | 378,475 | | 378,475 | ||||||||||||||||||||||||||||||
| Foreign currency translation adjustment |
| | | | | | | | (17,749 | ) | (17,749 | ) | ||||||||||||||||||||||||||||
| Equity contribution from Former Parent of Ingram Micro Inc. |
| | | | | | 3,913 | | | 3,913 | ||||||||||||||||||||||||||||||
|
|
|
|
|
|
|
|
|
|
|
|
|
|
|
|
|
|
|
|
|
|||||||||||||||||||||
| Balance at July 2, 2021 (Predecessor) |
| $ | | | $ | | 100 | $ | | $ | 787,763 | $ | 4,576,365 | $ | (202,983 | ) | $ | 5,161,145 | ||||||||||||||||||||||
|
|
||||||||||||||||||||||||||||||||||||||||
| Balance at July 3, 2021 (Successor) |
26,380 | $ | | | $ | | | $ | | $ | | $ | | $ | | $ | | |||||||||||||||||||||||
| Net income |
| | | | | | | 96,734 | | 96,734 | ||||||||||||||||||||||||||||||
| Foreign currency translation adjustment |
| | | | | | | | (61,305 | ) | (61,305 | ) | ||||||||||||||||||||||||||||
| Issuance of Class B shares |
| | 198 | | | | 20,000 | | | 20,000 | ||||||||||||||||||||||||||||||
| Equity contribution from Platinum |
| | | | | | 2,638,000 | | | 2,638,000 | ||||||||||||||||||||||||||||||
|
|
|
|
|
|
|
|
|
|
|
|
|
|
|
|
|
|
|
|
|
|||||||||||||||||||||
| Balance at January 1, 2022 (Successor) |
26,380 | $ | | 198 | $ | | | $ | | $ | 2,658,000 | $ | 96,734 | $ | (61,305 | ) | $ | 2,693,429 | ||||||||||||||||||||||
| Dividends declared |
| | | | | | | (1,753,697 | ) | | (1,753,697 | ) | ||||||||||||||||||||||||||||
| Net income |
| | | | | | | 2,394,489 | | 2,394,489 | ||||||||||||||||||||||||||||||
| Foreign currency translation adjustment |
| | | | | | | | (270,685 | ) | (270,685 | ) | ||||||||||||||||||||||||||||
| Issuance of Class A shares |
2 | | | | | | | | | | ||||||||||||||||||||||||||||||
| Other |
| $ | | | $ | | | $ | | $ | | $ | | $ | (5,468 | ) | $ | (5,468 | ) | |||||||||||||||||||||
|
|
|
|
|
|
|
|
|
|
|
|
|
|
|
|
|
|
|
|
|
|||||||||||||||||||||
| Balance at December 31, 2022 (Successor) |
26,382 | $ | | 198 | $ | | | $ | | $ | 2,658,000 | $ | 737,526 | $ | (337,458 | ) | $ | 3,058,068 | ||||||||||||||||||||||
| Dividends declared |
| | | | | | | (10,462 | ) | | (10,462 | ) | ||||||||||||||||||||||||||||
| Net income |
| | | | | | | 352,712 | | 352,712 | ||||||||||||||||||||||||||||||
| Foreign currency translation adjustment |
| | | | | | | | 103,596 | 103,596 | ||||||||||||||||||||||||||||||
| Other |
| $ | | | $ | | | $ | | $ | | $ | | $ | 2,375 | $ | 2,375 | |||||||||||||||||||||||
|
|
|
|
|
|
|
|
|
|
|
|
|
|
|
|
|
|
|
|
|
|||||||||||||||||||||
| Balance at December 30, 2023 (Successor) |
26,382 | $ | | 198 | $ | | | $ | | $ | 2,658,000 | $ | 1,079,776 | $ | (231,487 | ) | $ | 3,506,289 | ||||||||||||||||||||||
|
|
|
|
|
|
|
|
|
|
|
|
|
|
|
|
|
|
|
|
|
|||||||||||||||||||||
See accompanying notes to these consolidated financial statements.
F-8
Table of Contents
INGRAM MICRO HOLDING CORPORATION
CONSOLIDATED STATEMENTS OF CASH FLOWS
(Amounts in thousands)
| Predecessor | Successor | Successor | Successor | |||||||||||||
| Period from January 3, 2021 to July 2, 2021 |
Period from July 3, 2021 to January 1, 2022 |
Fiscal Year Ended |
Fiscal Year Ended |
|||||||||||||
| 2022 | 2023 | |||||||||||||||
| Cash flows from operating activities: |
||||||||||||||||
| Net income |
$ | 378,475 | $ | 96,734 | $ | 2,394,489 | $ | 352,712 | ||||||||
| Adjustments to reconcile net income to cash provided by operating activities: |
||||||||||||||||
| Depreciation and amortization |
99,542 | 137,484 | 197,111 | 184,148 | ||||||||||||
| (Gain) loss on marketable securities, net |
(6,606 | ) | (2,686 | ) | 14,340 | (10,941 | ) | |||||||||
| Loss on sale of property and equipment |
417 | 380 | 3,435 | 458 | ||||||||||||
| Gain on CLS Sale |
| | (2,283,820 | ) | | |||||||||||
| Gain on sale leaseback of German warehouse |
| | (7,050 | ) | | |||||||||||
| Loss on sale of subsidiary |
| | | 3,068 | ||||||||||||
| Revaluation of other consideration for acquisitions |
| 76,144 | 3,538 | 312 | ||||||||||||
| Noncash charges for interest and bond discount amortization |
1,326 | 37,433 | 33,419 | 31,424 | ||||||||||||
| Loss on repayment of term loans |
| | 10,724 | 4,872 | ||||||||||||
| Amortization of operating lease asset |
78,628 | 75,432 | 101,263 | 108,644 | ||||||||||||
| Deferred income taxes |
2,754 | (116,237 | ) | 16,573 | (55,164 | ) | ||||||||||
| (Gain) loss on foreign exchange |
(69,329 | ) | (55,104 | ) | (143,335 | ) | 1,989 | |||||||||
| Other |
| | | 967 | ||||||||||||
| Changes in operating assets and liabilities, net of effects of acquisitions: |
||||||||||||||||
| Trade accounts receivable |
893,132 | (1,620,221 | ) | (590,576 | ) | (299,833 | ) | |||||||||
| Inventory |
(209,276 | ) | (566,127 | ) | (210,215 | ) | 772,396 | |||||||||
| Other assets |
(24,720 | ) | (32,822 | ) | (30,322 | ) | (75,597 | ) | ||||||||
| Accounts payable |
(1,266,524 | ) | 1,763,852 | 349,744 | (738,389 | ) | ||||||||||
| Change in book overdrafts |
(222,776 | ) | 237,698 | 10,411 | (34,367 | ) | ||||||||||
| Operating lease liabilities |
(55,494 | ) | (11,835 | ) | (63,799 | ) | (104,897 | ) | ||||||||
| Accrued expenses and other |
(213,613 | ) | 211,638 | (167,039 | ) | (82,978 | ) | |||||||||
|
|
|
|
|
|
|
|
|
|||||||||
| Cash (used in) provided by operating activities |
(614,064 | ) | 231,763 | (361,109 | ) | 58,824 | ||||||||||
|
|
|
|
|
|
|
|
|
|||||||||
| Cash flows from investing activities: |
||||||||||||||||
| Capital expenditures |
(63,160 | ) | (86,584 | ) | (135,785 | ) | (201,535 | ) | ||||||||
| Proceeds from deferred purchase price of factored receivables |
50,429 | 60,304 | 145,003 | 162,622 | ||||||||||||
| (Purchase) sale of marketable securities, net |
(4,110 | ) | 195 | 148 | (1,126 | ) | ||||||||||
| Proceeds from sale of property and equipment |
743 | 529 | 1,981 | 1,579 | ||||||||||||
| Proceeds from CLS Sale, net of cash sold |
| | 2,977,825 | 23,977 | ||||||||||||
| Proceeds from sale leaseback of German warehouse |
| | 43,691 | | ||||||||||||
| Cash outflow from sale of subsidiary, net of proceeds |
| | | (1,945 | ) | |||||||||||
| Acquisitions, net of cash acquired |
(14,625 | ) | (4,303 | ) | (4,095 | ) | (1,006 | ) | ||||||||
F-9
Table of Contents
| Predecessor | Successor | Successor | Successor | |||||||||||||
| Period from January 3, 2021 to July 2, 2021 |
Period from July 3, 2021 to January 1, 2022 |
Fiscal Year Ended |
Fiscal Year Ended |
|||||||||||||
| 2022 | 2023 | |||||||||||||||
| Cash paid for share capital of Ingram Micro |
| (8,044,012 | ) | | | |||||||||||
| Cash received in Imola Mergers |
| 351,632 | | | ||||||||||||
| Other |
| | | (280 | ) | |||||||||||
|
|
|
|
|
|
|
|
|
|||||||||
| Cash (used in) provided by investing activities |
(30,723 | ) | (7,722,239 | ) | 3,028,768 | (17,714 | ) | |||||||||
|
|
|
|
|
|
|
|
|
|||||||||
| Cash flows from financing activities: |
||||||||||||||||
| Payment of contingent consideration related to Imola Mergers |
| | (250,000 | ) | | |||||||||||
| Other consideration for acquisitions |
(2,967 | ) | | (7,048 | ) | (466 | ) | |||||||||
| Dividends paid to stockholders |
(215,182 | ) | | (1,753,697 | ) | (10,462 | ) | |||||||||
| Change in unremitted cash collections from servicing factored receivables |
(13,656 | ) | (1,985 | ) | 17,831 | (18,413 | ) | |||||||||
| Issuance of Class B shares |
| 20,000 | | | ||||||||||||
| Equity contribution by Platinum |
| 2,638,000 | | | ||||||||||||
| Net proceeds from debt issued in Imola Mergers |
| 5,550,086 | | | ||||||||||||
| Repayment of term loans |
| (12,500 | ) | (517,500 | ) | (560,000 | ) | |||||||||
| Gross proceeds from other debt |
24,097 | 45,987 | 50,116 | 72,351 | ||||||||||||
| Gross repayments of other debt |
(10,748 | ) | (20,166 | ) | (94,300 | ) | (92,417 | ) | ||||||||
| Net proceeds (repayments) from revolving and other credit facilities |
1,016,844 | (961,568 | ) | 89,285 | 131,467 | |||||||||||
|
|
|
|
|
|
|
|
|
|||||||||
| Cash provided by (used in) financing activities |
798,388 | 7,257,854 | (2,465,313 | ) | (477,940 | ) | ||||||||||
|
|
|
|
|
|
|
|
|
|||||||||
| Effect of exchange rate changes on cash and cash equivalents |
(10,415 | ) | (68,849 | ) | (133,817 | ) | 65,183 | |||||||||
| Cash and cash equivalents classified within held for sale |
| (23,729 | ) | 23,729 | | |||||||||||
|
|
|
|
|
|
|
|
|
|||||||||
| Increase (decrease) in cash and cash equivalents |
143,186 | (325,200 | ) | 92,258 | (371,647 | ) | ||||||||||
| Cash and cash equivalents, beginning of year |
1,409,893 | 1,553,079 | 1,227,879 | 1,320,137 | ||||||||||||
|
|
|
|
|
|
|
|
|
|||||||||
| Cash and cash equivalents, end of year |
$ | 1,553,079 | $ | 1,227,879 | $ | 1,320,137 | $ | 948,490 | ||||||||
|
|
|
|
|
|
|
|
|
|||||||||
| Supplemental disclosures of cash flow information: |
||||||||||||||||
| Cash payments during the year: |
||||||||||||||||
| Interest |
$ | 18,074 | $ | 174,389 | $ | 320,025 | $ | 378,554 | ||||||||
| Income taxes |
$ | 94,590 | $ | 90,490 | $ | 442,564 | $ | 271,541 | ||||||||
|
|
|
|
|
|
|
|
|
|||||||||
| Supplemental disclosure of non-cash investing and financing information: |
||||||||||||||||
| Contingent consideration related to Imola Mergers |
$ | | $ | 250,000 | $ | | $ | | ||||||||
| Contribution from Former Parent of Ingram Micro Inc. |
$ | 3,913 | $ | | $ | | $ | | ||||||||
| Proceeds not yet received from CLS sale |
$ | | $ | | $ | 23,997 | $ | | ||||||||
| Amounts obtained as a beneficial interest in exchange for transferring trade receivables in factoring arrangements |
$ | 47,232 | $ | 69,288 | $ | 147,882 | $ | 171,114 | ||||||||
See accompanying notes to these consolidated financial statements.
F-10
Table of Contents
INGRAM MICRO HOLDING CORPORATION
NOTES TO CONSOLIDATED FINANCIAL STATEMENTS
(Amounts in thousands, except share, unit and per share data)
Note 1 Organization and Basis of Presentation
Ingram Micro Holding Corporation and its subsidiaries (Ingram Micro) are primarily engaged in the distribution of information technology (IT) products, cloud and other services worldwide. Ingram Micro operates in North America; Europe, Middle East and Africa (EMEA); Asia-Pacific; and Latin America. Unless the context otherwise requires, the use of the terms Ingram Micro, we, us and our in these notes to the consolidated financial statements refers to Ingram Micro Holding Corporation together with its consolidated subsidiaries in the successor periods as described herein and Ingram Micro Inc. together with its consolidated subsidiaries in the predecessor period as described herein. The use of the term Platinum means Platinum Equity, LLC together with its affiliated investment vehicles.
Platinum formed Ingram Micro Holding Corporation on September 28, 2020, and on December 9, 2020, Imola Acquisition Corporation, an investment vehicle of certain private investment funds sponsored and ultimately controlled by Platinum, entered into a definitive agreement with HNA Technology Co., Ltd. (HNA Tech or Former Parent of Ingram Micro Inc.) to acquire 100% of the share capital of Ingram Micro Inc. The acquisition was consummated on July 2, 2021 (Acquisition Closing Date). As part of the acquisition, Imola Merger Corporation (Escrow Issuer) merged with and into GCL Investment Management Inc., an affiliate of HNA Tech, which immediately thereafter merged with and into GCL Investment Holdings, Inc., which subsequently and immediately then merged with and into Ingram Micro Inc., with Ingram Micro Inc. as the surviving entity (collectively, the Imola Mergers).
The accompanying consolidated financial statements present separately the balance sheets, results of operations, cash flows and changes in equity for Ingram Micro on a successor basis, reflecting ownership by Platinum since July 3, 2021, and on a predecessor basis, reflecting ownership of Ingram Micro Inc. by HNA Tech for the period from January 3, 2021 to July 2, 2021. The financial information of Ingram Micro has been separated by a line on the face of the respective consolidated financial statements to distinguish the successor and predecessor periods. These consolidated financial statements have been prepared by us pursuant to accounting principles generally accepted in the United States of America (U.S. GAAP).
Sale of a Substantial Portion of our Commerce & Lifecycle Services (CLS) Business
On December 6, 2021, we entered into a Purchase Agreement with CMA CGM Group to sell a substantial portion of our CLS businesses (CLS Sale), which comprises our other services offerings defined as Other herein. The sale included Shipwire and our e-commerce and other forward logistics businesses in North America, Europe, Latin America and Asia-Pacific at an initial cash purchase price of $3,000,000 subject to certain adjustments. On April 4, 2022, we completed the main closing of the sale of most of our CLS business in Europe, U.S., Canada, Peru, Colombia, Chile, and Argentina. We also closed the sale of our CLS businesses in Australia, India, Mexico and Costa Rica at the end of April 2022, New Zealand at the end of June 2022, and China in November 2022. These deferred closings of the CLS Sale were all completed between the primary closing date and November 16, 2022. As a result of the CLS Sale, we recorded a gain of $2,283,820 during the Fiscal Year Ended December 31, 2022 (Successor), which had an income tax provision of $246,450, or an effective tax rate of 10.8 percentage points. The CLS Sale effective tax rate is lower than statutory rates primarily due to the gain on sale of European subsidiaries being tax exempt due to the participation exemption in Europe.
Note 2 Significant Accounting Policies
Basis of Consolidation
The consolidated financial statements include the accounts of Ingram Micro Holding Corporation and its subsidiaries. All significant intercompany accounts and transactions have been eliminated in consolidation.
F-11
Table of Contents
INGRAM MICRO HOLDING CORPORATION
NOTES TO CONSOLIDATED FINANCIAL STATEMENTS
(Amounts in thousands, except share, unit and per share data)
Fiscal Year
Our fiscal year is a 52- or 53-week period ending on the Saturday nearest to December 31.
Predecessor Period
The period from January 3, 2021 to July 2, 2021 reflects the historical cost basis of accounting of Ingram Micro that existed prior to the acquisition by Platinum. This period is referred to as the Period from January 3, 2021 to July 2, 2021 (Predecessor) and as the Predecessor Period.
Successor Periods
The period from July 3, 2021 to January 1, 2022 and the fiscal years ended December 31, 2022 and December 30, 2023 are referred to as the Period from July 3, 2021 to January 1, 2022 (Successor), the Fiscal Year Ended 2022 (Successor) and the Fiscal Year Ended 2023 (Successor), respectively, and collectively referred to as the Successor Periods. Certain costs incurred by the Successor entity prior to the Acquisition Closing Date are reflected in the Period from July 3, 2021 to January 1, 2022 (Successor).
Use of Estimates
The preparation of financial statements in conformity with U.S. GAAP requires us to make estimates and assumptions that affect the reported amounts of assets and liabilities, disclosure of contingent assets and liabilities at the financial statement date, and reported amounts of revenue and expenses during the reporting period. We review our estimates and assumptions on an on-going basis. Significant estimates primarily relate to the realizable value of accounts receivable, vendor programs, inventory, goodwill, intangible and other long-lived assets, income taxes, the contingent consideration provided in the Imola Mergers, and contingencies and litigation. Actual results could differ significantly from these estimates.
Revenue Recognition
Revenue Streams
In our distribution services model, we buy, hold title to, and sell technology products and provide services to resellers, referred to subsequently as our customer, while also providing resellers with multi-vendor solutions, integration services, electronic commerce tools, marketing, financing, training and enablement, technical support, and inventory management. In both Technology Solutions, which consists of Commercial & Consumer and Advanced Solutions, and Cloud, we generally sell products and services to our customers (resellers) based on purchase orders instead of long-term contracts. Our agreements are generally not subject to minimum purchase requirements. Our customers place purchase orders with us for each transaction. Generally, our customers may cancel, delay or modify their purchase orders. In order to set up an account to trade with us, our customers generally have to accept our standard terms and conditions of sale which, together with the purchase order, form a binding contract on each individual order to which the purchase order applies. Our pricing varies greatly and depends on many factors including costs, competitive pressure, availability of inventory, seasonality and vendor promotional programs, among others. We may offer early payment discounts or volume incentive rebates to our customers. The customer contracts relating to our Other services generally provide for an initial term of three to five years, subject to extension by the mutual agreement of the parties, allow for termination for convenience by either party after the second year and the pricing is fixed by discrete type of service and typically varies depending on the volume of the relevant services. We do not believe any contract related to our Other services has a material impact on our business or financial condition. Products are delivered via shipment from our
F-12
Table of Contents
INGRAM MICRO HOLDING CORPORATION
NOTES TO CONSOLIDATED FINANCIAL STATEMENTS
(Amounts in thousands, except share, unit and per share data)
facilities, drop-shipment directly from the vendor, or by electronic delivery of keys for software products. We recognize revenue when the control of products is transferred to our customers, which generally happens at the point of shipment or point of delivery.
Any supplemental distribution services we provide are typically recognized over time as the services are performed. Service contracts may be based on a fixed price or on a fixed unit-price per transaction or other objective measure of output. Additionally, we offer services related to our supply chain management and CloudBlue platform. Our fee-based commerce and supply chain services are billed and recognized on a per-item service fee arrangement at the point when the service is provided. Our CloudBlue platform generates revenue through licensing the right to use the intellectual property (on-premise license), which is recognized at a point in time, providing the right to access (platform as a service), which is recognized over time across the term of the contract, or through our cloud marketplace, which is recognized in the amount of the net fee associated with serving as an agent when the services are provided. Service revenues represented less than 10% of total net sales for the Period from January 3, 2021 to July 2, 2021 (Predecessor), the Period from July 3, 2021 to January 1, 2022 (Successor), the Fiscal Year Ended 2022 (Successor) and the Fiscal Year Ended 2023 (Successor). Related contract liabilities were not material for the periods presented.
Agency Services
We have contracts with certain customers where our performance obligation is to arrange for the products or services to be provided by another party. In these arrangements, as we assume an agency relationship in the transaction, revenue is recognized in the amount of the net fee associated with serving as an agent when the services are completed. These arrangements primarily relate to certain fulfillment contracts, as well as sales of certain software products, and extended vendor services, such as vendor warranties.
Variable Consideration
We, under specific conditions, permit our customers to return or exchange products. The provision for estimated sales returns is recorded concurrently with the recognition of revenue. A liability is recorded within accrued expenses and other on the Consolidated Balance Sheets for estimated product returns based upon historical experience and an asset is recorded within Inventory on the Consolidated Balance Sheets for the amount expected to be recorded for inventory upon product return.
We also provide volume discounts, early payment discounts, and other discounts to certain customers which are considered variable consideration. A provision for such discounts is recorded as a reduction of revenue at the time of sale based on an evaluation of the contract terms and historical experience.
Practical Expedients
We account for shipping and handling activities that occur after the customer has obtained control of a good as fulfillment activities rather than a promised service. Accordingly, we accrue all fulfillment costs related to the shipping and handling of goods at the time of shipment. Additionally, we exclude the amount of certain taxes collected concurrent with revenue-producing activities from revenue.
We disaggregate revenue by geography, which we believe provides a meaningful depiction of the nature of our revenue (see Note 12, Segment Information).
F-13
Table of Contents
INGRAM MICRO HOLDING CORPORATION
NOTES TO CONSOLIDATED FINANCIAL STATEMENTS
(Amounts in thousands, except share, unit and per share data)
Vendor Programs
Funds received from vendors for price protection, product rebates, promotions and marketing, infrastructure reimbursement and meet-competition programs are recorded as adjustments to product costs, revenue, or selling, general and administrative (SG&A) expenses, according to the nature of the program. Some of these programs may extend over multiple reporting periods. We accrue rebates or other vendor incentives as earned based on sales of qualifying products or as services are provided in accordance with the terms of the related program.
We sell products purchased from many vendors, but generated approximately 15%, 12%, 15% and 16% of our consolidated net sales in the Predecessor Period from January 3, 2021 to July 2, 2021 and the Successor Periods from July 3, 2021 to January 1, 2022, the Fiscal Year Ended 2022 and the Fiscal Year Ended 2023, respectively, from products purchased from Apple Inc. Additionally, we generated approximately 11%, 10%, 10% and 10% of our consolidated net sales in Predecessor Period from January 3, 2021 to July 2, 2021 and the Successor Periods from July 3, 2021 to January 1, 2022, the Fiscal Year Ended 2022 and the Fiscal Year Ended 2023, respectively, from products purchased from HP Inc. We also generated approximately 11% of our consolidated net sales during the Fiscal Year Ended 2023 (Successor) from products purchased from Cisco. There were no other vendors whose products represented 10% or more of our net sales for the aforementioned periods.
Warranties
Our suppliers generally warrant the products distributed by us and allow returns of defective products, including those that have been returned to us by our customers. We generally do not independently warrant the products we distribute; however, local laws might impose warranty obligations upon distributors (such as in the case of supplier liquidation). We are obligated to provide warranty protection for sales of certain IT products within the European Union (EU) for up to two years as required under the EU directive where vendors have not affirmatively agreed to provide pass-through protection. In addition, we warrant the services we provide, products that we build-to-order from components purchased from other sources, and our own branded products. Provision for estimated warranty costs is recorded at the time of sale and periodically adjusted to reflect actual experience. Warranty expense and the related obligations are not material to our consolidated financial statements.
Foreign Currency Translation and Remeasurement
Financial statements of our foreign subsidiaries, for which the functional currency is the local currency, are translated into U.S. dollars using the exchange rate at each balance sheet date for assets and liabilities and an average exchange rate for each period for statement of income items. Translation adjustments are recorded in accumulated other comprehensive loss, a component of stockholders equity. The functional currency of certain operations within our EMEA, Asia-Pacific, and Latin America regions is the U.S. dollar; accordingly, the monetary assets and liabilities of these subsidiaries are remeasured into U.S. dollars at the exchange rate in effect at the balance sheet date. Revenues, expenses, gains or losses are remeasured at the average exchange rate for the period. The remeasurement gains and losses of these operations as well as gains and losses from foreign currency transactions are included in the Consolidated Statements of Income.
Cash and Cash Equivalents
We consider all highly liquid investments with original maturities of three months or less from the date of purchase to be cash equivalents. We had $10,349 and $11,971 of cash equivalents as of December 31, 2022 and December 30, 2023, respectively.
F-14
Table of Contents
INGRAM MICRO HOLDING CORPORATION
NOTES TO CONSOLIDATED FINANCIAL STATEMENTS
(Amounts in thousands, except share, unit and per share data)
Book overdrafts of $443,687 and $409,420 as of December 31, 2022 and December 30, 2023, respectively, represent checks issued on disbursement bank accounts but not yet paid by such banks. These amounts are classified as accounts payable in our Consolidated Balance Sheets. We typically fund these overdrafts through normal collections of funds or transfers from other bank balances at other financial institutions. Under the terms of our facilities with the banks, the respective financial institutions are not legally obligated to honor the book overdraft balances as of December 31, 2022 and December 30, 2023, nor any balance on any given date.
Trade Accounts Receivable
We maintain an allowance for doubtful accounts receivable for expected losses in accordance with Accounting Standards Codification (ASC) 326, Financial Instruments Credit Losses. In estimating the required allowance, we take into consideration the overall quality and aging of the receivable portfolio, the large number of customers and their dispersion across wide geographic areas, the existence of credit insurance where applicable, specifically identified customer risks, historical write-off experience and the current economic environment, reasonable and supportable forecasts of future economic conditions, and other factors that may affect our ability to collect from customers.
Factoring Programs
We have several uncommitted factoring programs under which trade accounts receivable of several customers may be sold, without recourse, to financial institutions. Available capacity under these programs is dependent on the level of our trade accounts receivable eligible to be sold into these programs and the financial institutions willingness to purchase such receivables. The receivables under these factoring programs are sold at face value and are excluded from our Consolidated Balance Sheets. We account for these transactions as sales of receivables because control of the underlying asset is transferred and subsequent to the date of transfer, we typically do not have any continuing involvement in the transferred asset, except as discussed below.
For certain of our factoring programs in EMEA, there is a deferred purchase price (DPP) which is paid to us at a later time once the customer pays the factored invoices. Subsequent to the sale, the DPP represents a beneficial interest in the transferred trade accounts receivable and is disclosed as a non-cash investing activity in our Consolidated Statements of Cash Flows. Accordingly, cash proceeds from the payments of DPPs are presented as investing activities in our Consolidated Statements of Cash Flows. At December 31, 2022 and December 30, 2023, there were $39,637 and $48,532, respectively, of DPP within other current assets on our Consolidated Balance Sheets. In arrangements where we collect the customer payments on behalf of the factor, the net cash flows related to these collections are reported as financing activities in the Consolidated Statements of Cash Flows. At December 31, 2022 and December 30, 2023, we recorded unremitted cash within accrued expenses and other of $33,772 and $16,066, respectively.
We also had two factoring programs in EMEA that did not meet the criteria for derecognition and sale accounting under ASC 860 and therefore were accounted for as debt. In the fourth quarter of 2023, both of these agreements were amended and receivables sold under these programs are now excluded from our Consolidated Balance Sheets on a prospective basis. At December 31, 2022 and December 30, 2023, we had $57,256 and $15,339, respectively, recorded within short-term debt and current maturities of long-term debt on our Consolidated Balance Sheets.
At December 31, 2022 and December 30, 2023 we had a total of $698,903 and $738,714, respectively, of trade accounts receivable sold to and held by financial institutions under these programs. Factoring fees of $2,242, $2,541, $16,075 and $27,292 were incurred in the Predecessor Period from January 3, 2021 to July 2,
F-15
Table of Contents
INGRAM MICRO HOLDING CORPORATION
NOTES TO CONSOLIDATED FINANCIAL STATEMENTS
(Amounts in thousands, except share, unit and per share data)
2021 and the Successor Periods from July 3, 2021 to January 1, 2022, the Fiscal Year Ended 2022 and the Fiscal Year Ended 2023, respectively, related to the sale of trade accounts receivable under the facilities and are included in other (income) expense in the other (income) expense section of our Consolidated Statements of Income.
Supplier Finance Programs
As part of our ongoing efforts to manage our working capital, we have worked with our vendors to optimize our terms and conditions, which include the terms of payment to the vendor. We are party to agreements, initiated either by the vendor or us, which allow vendors, at their discretion, to determine invoices that they want to sell to participating financial institutions. We are not a party to the agreements between the participating financial institutions and the vendors in connection with these programs, and the financial institutions do not provide us with incentives such as rebates. There are no assets pledged under these agreements and no interest is charged by the financial institutions as balances are typically paid when they are due. Certain agreements may require a parent guarantee, although parent guarantees are also required in certain vendor agreements that do not involve financial institutions. The payment terms under these arrangements typically range from 30 to 90 days. Certain programs provide for extended payment terms, which are within standard industry practice and consistent with the range of payment terms we negotiate with our vendors, regardless of whether they have an agreement with a financial institution. At December 31, 2022 and December 30, 2023, the outstanding payment obligations under these arrangements included in accounts payable in the Consolidated Balance Sheets were $2,645,907 and $2,373,913 respectively.
In situations where amounts are not paid within the specified payment terms and interest is incurred, we reclassify the amount from accounts payable to debt. The outstanding payment obligations under these programs included in short-term debt and current maturities of long-term debt in the Consolidated Balance Sheets were $15,345 and $0 at December 31, 2022 and December 30, 2023, respectively.
Inventory
Our inventory consists of finished goods purchased from various vendors for resale. We value our inventory at the lower of its cost or net realizable value, cost being determined on a moving average cost basis, which approximates the first-in, first out method. We write down our inventory for estimated excess or obsolescence equal to the difference between the cost of inventory and the net realizable value based upon an aging analysis of the inventory on hand, specifically known inventory-related risks (such as technological obsolescence and the nature of vendor terms surrounding price protection and product returns), foreign currency fluctuations for foreign-sourced products, and assumptions about future demand. Market conditions or changes in terms and conditions by our vendors that are less favorable than those projected by management may require additional inventory write-downs, which could have an adverse effect on our consolidated financial results. Inventory is determined from the price we pay vendors, including freight and duties; we do not include labor, overhead, or other general or administrative costs in our inventory.
Property and Equipment
Property and equipment are recorded at cost and depreciated using the straight-line method over the estimated useful lives noted below. We also capitalize computer software costs that meet both the definition of internal-use software and defined criteria for capitalization. Leasehold improvements are amortized over the shorter of the lease term or the estimated useful life.
F-16
Table of Contents
INGRAM MICRO HOLDING CORPORATION
NOTES TO CONSOLIDATED FINANCIAL STATEMENTS
(Amounts in thousands, except share, unit and per share data)
Depreciable lives of property and equipment are as follows:
| Buildings |
30-40 years | |||
| Leasehold improvements |
Shorter of the lease term or 3-17 years | |||
| Distribution equipment |
5-10 years | |||
| Computer equipment and software |
4-10 years |
Maintenance, repairs, and minor renewals are charged to expense as incurred. Additions, major renewals, and betterments to property and equipment are capitalized.
Operating Leases
Our leased physical properties are operating leases and we recognize rent expense on a straight-line basis. We recognize a right-of-use asset and lease liability within our Consolidated Balance Sheets for operating leases with terms greater than twelve months. The initial measurement of the lease liability is measured at the present value of lease payments not yet paid discounted using our incremental borrowing rate at the lease commencement date. Leases with an initial term of twelve months or less are not recorded on our Consolidated Balance Sheets, and we do not separate nonlease components from lease components. Upon adoption of ASC 842 we did not apply hindsight in the determination of the lease term and assessing impairment of right-of-use assets for existing leases.
Long-Lived and Intangible Assets
We assess potential impairments to our long-lived and intangible assets when events or changes in circumstances indicate that the carrying amount may not be fully recoverable. If required, an impairment loss is recognized to the extent the carrying value exceeds the fair value of the assets. As a result of the Imola Mergers, our long-lived and intangible assets were revalued as of the acquisition date (see Note 3, Purchase Price Allocation). The gross carrying amounts of finite-lived identifiable intangible assets of $1,094,702 and $1,106,751 at December 31, 2022 and December 30, 2023, respectively, are amortized over their remaining estimated lives ranging up to 13 years with the predominant amounts having lives of 10 to 13 years. The net carrying amount was $957,471 and $880,433 at December 31, 2022 and December 30, 2023, respectively. Amortization expense was $31,799, $50,462, $91,039 and $87,003 for the Predecessor Period from January 3, 2021 to July 2, 2021 and the Successor Periods from July 3, 2021 to January 1, 2022, the Fiscal Year Ended 2022 and the Fiscal Year Ended 2023, respectively.
Intangible assets consist of the following:
| December 31, 2022 (Successor) |
December 30, 2023 (Successor) |
|||||||
| Customer and vendor relationships |
$ | 518,234 | $ | 474,080 | ||||
| Tradename and trademarks |
382,362 | 358,228 | ||||||
| Software and developed technology |
56,875 | 48,125 | ||||||
|
|
|
|
|
|||||
| Total Intangible assets, net |
$ | 957,471 | $ | 880,433 | ||||
|
|
|
|
|
|||||
F-17
Table of Contents
INGRAM MICRO HOLDING CORPORATION
NOTES TO CONSOLIDATED FINANCIAL STATEMENTS
(Amounts in thousands, except share, unit and per share data)
Future minimum amortization expense of finite-lived identifiable intangible assets that we expect to recognize over the next five years and thereafter are as follows:
| 2024 |
$ | 94,953 | ||
| 2025 |
86,819 | |||
| 2026 |
86,737 | |||
| 2027 |
86,729 | |||
| 2028 |
86,729 | |||
| Thereafter |
438,466 | |||
|
|
|
|||
| $ | 880,433 | |||
|
|
|
There were no material impairments to our long-lived and intangible assets in any of the periods presented herein.
Goodwill
Goodwill represents the excess of the purchase price over the fair value of the identifiable net assets acquired in an acquisition and is reviewed annually for potential impairment, or when circumstances warrant.
As a result of applying the acquisition method of accounting in connection with the Imola Mergers, historical goodwill was eliminated. Goodwill at December 30, 2023 primarily represents the excess of the consideration paid over the fair value of net assets acquired in connection with the Imola Mergers (see Note 3, Purchase Price Allocation).
Goodwill is required to be tested for impairment at least annually or sooner whenever events or changes in circumstances indicate that goodwill may be impaired. Goodwill impairment tests require judgment, including the identification of reporting units, assignment of assets and liabilities to reporting units, assignment of goodwill to reporting units, and determination of the fair value of each reporting unit. We perform our annual goodwill impairment assessment during our fiscal fourth quarter as of the date of our November month end. We have the option of first assessing qualitative factors to determine whether it is more likely than not that the fair value of a reporting unit is less than its carrying value. Such review includes an evaluation of whether events and circumstances have occurred that may indicate a potential change in recoverability of goodwill, including the impacts of a deterioration in general economic conditions, an increased competitive environment, a change in management, key personnel, strategy, vendors, or customers, negative or declining cash flows, or a decline in actual or planned revenue or earnings compared with actual and projected results of relevant prior periods.
If, based on a review of qualitative factors, it is more likely than not that the fair value of a reporting unit is less than its carrying value, we perform a quantitative analysis by comparing the fair value of a reporting unit with its carrying amount. If the carrying value exceeds the fair value, we measure the amount of impairment loss, if any, by comparing the fair value of the reporting unit goodwill to its carrying amount.
We performed a qualitative analysis in the Predecessor Period from January 3, 2021 to July 2, 2021 and in the Successor Period from July 3, 2021 to January 1, 2022, utilizing several qualitative factors to assess for any potential impairment indicators. Such review indicated that we had no impairment indicators present as it was more likely than not that the fair value of the reporting units was greater than their carrying value. In the Fiscal Year Ended 2022 (Successor), and in the Fiscal Year Ended 2023 (Successor) for our North America and EMEA regions, we performed a quantitative analysis of goodwill. In determining the fair value of our reporting units, we
F-18
Table of Contents
INGRAM MICRO HOLDING CORPORATION
NOTES TO CONSOLIDATED FINANCIAL STATEMENTS
(Amounts in thousands, except share, unit and per share data)
assessed general economic conditions, industry and market considerations, the impact of recent events to financial performance, and other relevant events. Based on the valuations prepared, it was determined that the estimated fair values of our reporting units were greater than their carrying values and no impairment of goodwill was identified in either period. In the Fiscal Year Ended 2023 (Successor), we performed a qualitative analysis of goodwill for our Asia-Pacific and Latin America regions. No goodwill impairment was recorded during any of the periods presented herein based on the result of the procedures performed.
The changes in the carrying amount of goodwill are as follows:
| North America | EMEA | Asia-Pacific | Latin America | Total | ||||||||||||||||
| Balance at January 1, 2022 (Successor) |
$ | 421,743 | $ | 242,356 | $ | 155,169 | $ | 45,589 | $ | 864,857 | ||||||||||
| Acquisitions |
4,624 | | | | 4,624 | |||||||||||||||
| Adjustments /reclassifications /foreign currency exchange |
(2,567 | ) | (11,996 | ) | (7,917 | ) | (2,265 | ) | (24,745 | ) | ||||||||||
|
|
|
|
|
|
|
|
|
|
|
|||||||||||
| Balance at December 31, 2022 (Successor) |
$ | 423,800 | $ | 230,360 | $ | 147,252 | $ | 43,324 | $ | 844,736 | ||||||||||
| Adjustments /reclassifications /foreign currency exchange |
$ | 1,365 | $ | 4,389 | $ | (1,538 | ) | $ | 2,828 | $ | 7,044 | |||||||||
|
|
|
|
|
|
|
|
|
|
|
|||||||||||
| Balance at December 30, 2023 (Successor) |
$ | 425,165 | $ | 234,749 | $ | 145,714 | $ | 46,152 | $ | 851,780 | ||||||||||
|
|
|
|
|
|
|
|
|
|
|
|||||||||||
Earn-outs and Holdbacks
We may be required to make earn-out payments upon the achievement of certain predefined targets attributable to acquisitions completed in recent years. At the acquisition date, the value of any earn-out is estimated using various valuation methodologies which include projections of future earnings as defined in each acquisition purchase agreement. Such projections are then discounted to reflect the risk in achieving the projected earnings, as well as the passage of time and time value of money. The fair value measurement of the earn-out is based primarily on significant inputs not observable in an active market and thus represents a Level 3 measurement as defined under U.S. GAAP. Changes in the fair value of the earn-out primarily reflect adjustments to the timing and amount of payments as well as the related accretion driven by the time value of money. These adjustments are recorded within SG&A expenses within the Consolidated Statements of Income, as applicable. The fair value of earn-out contingent consideration is presented within accrued expenses and other in our Consolidated Balance Sheets. For amounts currently recorded on the Consolidated Balance Sheets, see Note 14, Fair Value Measurements.
In connection with the acquisition by Platinum, part of the consideration for the share capital of Ingram Micro included additional payments, not to exceed $325,000 in the aggregate, on the achievement by Ingram Micro and its subsidiaries of certain adjusted EBITDA targets for fiscal years 2021, 2022, and 2023. Based upon adjusted EBITDA achieved following the Imola Mergers through January 1, 2022, this contingent consideration of $325,000 was fully earned in its entirety and was paid to HNA Tech on April 11, 2022.
In addition to earn-outs, we may be required to make additional payments associated with holdbacks in accordance with the applicable acquisition purchase agreement. Holdbacks are accrued for at the time of acquisition and cash outflows are recorded as additional purchase price at the time of payment.
F-19
Table of Contents
INGRAM MICRO HOLDING CORPORATION
NOTES TO CONSOLIDATED FINANCIAL STATEMENTS
(Amounts in thousands, except share, unit and per share data)
Concentration of Credit Risk
Financial instruments that potentially subject us to significant concentrations of credit risk consist principally of cash and cash equivalents, trade accounts receivable from customers and vendors, borrowings, and derivative financial instruments. Our cash and cash equivalents are deposited and/or invested with various financial institutions globally that are monitored by us regularly for credit quality. We are exposed to credit risk in the event of default by financial institutions to the extent that cash balances with financial institutions are in excess of amounts that are insured. We have not experienced any material credit losses on such deposits for the periods presented. Our trade accounts receivable reflect a large number of customers dispersed across wide geographic areas, none of which has accounted for 10% or more of our consolidated net sales in any of the periods presented herein and no customer accounts receivable balance was greater than 10% of our total trade accounts receivable at December 31, 2022 or December 30, 2023. We perform ongoing credit evaluations of our customers financial conditions, obtain credit insurance in many locations, and require collateral in certain circumstances. We maintain an allowance for estimated credit losses.
Derivative Financial Instruments
We operate in various locations around the world. We reduce our exposure to fluctuations in foreign exchange rates by creating offsetting positions through the use of derivative financial instruments in situations where there are significant exposures and there are not offsetting balances that create a natural hedge. The market risk related to the foreign exchange agreements is offset by changes in the valuation of the underlying items being hedged. In accordance with our policy, we do not use derivative financial instruments for trading or speculative purposes, nor are we a party to leveraged derivatives.
Foreign exchange risk is managed primarily by using forward contracts and spot transactions to hedge foreign currency-denominated receivables, payables, and intercompany loans and expenses. Interest rate swaps and forward contracts may be used to hedge foreign currency-denominated principal and interest payments related to intercompany loans.
All derivatives are recorded in our Consolidated Balance Sheets at fair value. The estimated fair value of derivative financial instruments represents the amount required to enter into similar offsetting contracts with similar remaining maturities based on market-derived prices. Changes in the fair value of derivatives not designated as hedging instruments are recorded in current earnings. Changes in the fair value of derivatives designated as hedging instruments are reflected in accumulated other comprehensive loss in our Consolidated Balance Sheets.
The notional amount of forward exchange contracts is the amount of foreign currency bought or sold at maturity. The notional amount of interest rate swaps is the underlying principal amount used in determining the interest payments exchanged over the life of the swap. Notional amounts are indicative of the extent of our involvement in the various types and uses of derivative financial instruments but are not a measure of our exposure to credit or market risks through our use of derivatives.
Credit exposure for derivative financial instruments is limited to the amounts, if any, by which the counterparties obligations under the contracts exceed our obligations to the counterparties. We manage the potential risk of credit losses through careful evaluation of counterparty credit standing, selection of counterparties from a limited group of financial institutions, and other contract provisions.
F-20
Table of Contents
INGRAM MICRO HOLDING CORPORATION
NOTES TO CONSOLIDATED FINANCIAL STATEMENTS
(Amounts in thousands, except share, unit and per share data)
Comprehensive Income
Comprehensive income consists primarily of our net income and foreign currency translation adjustments, net of tax.
Earnings Per Share
Basic and diluted earnings per share is presented in conformity with the two-class method required for multiple classes of common stock. We report a dual presentation of Basic Earnings Per Share (Basic EPS) and Diluted Earnings Per Share (Diluted EPS). Basic EPS excludes dilution and is computed by dividing net income by the weighted average number of common shares outstanding during the reported period. Diluted EPS is computed the same as Basic EPS as we do not have any participating securities for any of the periods presented.
The computation of Basic and Diluted EPS is as follows:
| Predecessor | Successor | Successor | Successor | |||||||||||||||||||||||||
| Period from January 3, 2021 to July 2, 2021 |
Period from July 3, 2021 to January 1, 2022 |
Fiscal Year Ended | Fiscal Year Ended | |||||||||||||||||||||||||
| 2022 | 2023 | |||||||||||||||||||||||||||
| Common Stock | Class A | Class B | Class A | Class B | Class A | Class B | ||||||||||||||||||||||
| Net income |
$ | 378,475 | $ | 96,394 | $ | 340 | $ | 2,376,652 | $ | 17,837 | $ | 350,085 | $ | 2,627 | ||||||||||||||
|
|
|
|
|
|
|
|
|
|
|
|
|
|
|
|||||||||||||||
| Weighted average shares |
100 | 26,380 | 93 | 26,382 | 198 | 26,382 | 198 | |||||||||||||||||||||
|
|
|
|
|
|
|
|
|
|
|
|
|
|
|
|||||||||||||||
| Basic EPS |
$ | 3,784,750 | $ | 3,654 | $ | 3,654 | $ | 90,086 | $ | 90,086 | $ | 13,270 | $ | 13,270 | ||||||||||||||
|
|
|
|
|
|
|
|
|
|
|
|
|
|
|
|||||||||||||||
| Diluted EPS |
$ | 3,784,750 | $ | 3,654 | $ | 3,654 | $ | 90,086 | $ | 90,086 | $ | 13,270 | $ | 13,270 | ||||||||||||||
|
|
|
|
|
|
|
|
|
|
|
|
|
|
|
|||||||||||||||
Income Taxes
We estimate income taxes in each of the taxing jurisdictions in which we operate. This process involves estimating our actual current tax expense together with assessing the future tax impact of any differences resulting from the different treatment of certain items, such as the timing for recognizing revenues and expenses for tax versus financial reporting purposes. These differences may result in deferred tax assets and liabilities, which are included in our Consolidated Balance Sheets. We are required to assess the likelihood that our deferred tax assets, which include net operating loss carryforwards, tax credits and temporary differences that are expected to be deductible in future years, will be recoverable from future taxable income. In making that assessment, we consider the nature of the deferred tax assets and related statutory limits on utilization, recent operating results, future market growth, forecasted earnings, future taxable income, the mix of earnings in the jurisdictions in which we operate and prudent and feasible tax planning strategies. If, based upon available evidence, recovery of the full amount of the deferred tax assets is not likely; we provide a valuation allowance on any amount not likely to be realized.
Our effective tax rate includes the impact of not providing taxes on undistributed foreign earnings considered indefinitely reinvested. Material changes in our estimates of cash, working capital and long-term investment requirements in the various jurisdictions in which we do business could impact our effective tax rate if we no longer consider our foreign earnings to be indefinitely reinvested.
F-21
Table of Contents
INGRAM MICRO HOLDING CORPORATION
NOTES TO CONSOLIDATED FINANCIAL STATEMENTS
(Amounts in thousands, except share, unit and per share data)
The provision for tax liabilities and recognition of tax benefits involves evaluations and judgments of uncertainties in the interpretation of complex tax regulations by various taxing authorities. In situations involving uncertain tax positions related to income tax matters, we do not recognize benefits unless their sustainability is deemed more likely than not. As additional information becomes available, or these uncertainties are resolved with the taxing authorities, revisions to these liabilities or benefits may be required, resulting in additional provision for or benefit from income taxes reflected in our Consolidated Statements of Income.
Accounting for Cash-Based Compensation
Since 2016, we have issued cash awards to certain employees, which include both time-vested and performance-vested awards. The time-vested cash awards vest over a time period of three years, and the performance-vested cash awards vest upon the achievement of certain performance targets measured after a time period of three years. The performance condition for the cash awards for grants to management is based on earnings growth. Cumulative compensation expense for cash awards is recognized as a liability. Each cash award has a fixed fair value of $1.00. We recognize these compensation costs, net of an estimated forfeiture rate, over the requisite service period of the award, which is the vesting term of the outstanding cash award. We estimate the forfeiture rate based on our historical experience.
Participation Plan for Certain Key Employees
In July 2021, we adopted the 2021 Participation Plan (the Plan) to provide incentive compensation to certain key management. Under the Plan, participants are granted units, the value of which are related to our financial performance. Half of the units vest over a period of time specified in the applicable award agreement, typically in annual tranches over five years. Once vested, certain qualifying events are required for any payment related to these units, with accelerated vesting in the event of certain change in control or public offering events, in each case subject to the participants continued employment through the applicable vesting date. The other half are payable to participants only upon the occurrence of certain qualifying events. Any payment to a participant under the time-based or performance-based units is conditioned on our reaching a minimum valuation at the time of a qualifying event or through a series of qualifying events. A qualifying event may be either a sale of some or all of our capital stock or a sale of all or substantially all of our assets. For the Successor period from July 3, 2021 to January 1, 2022, we issued 216,874,665 performance units with an initial grant date value of $1.00 to key management of which none are vested. As of December 30, 2023 there were 194,599,609 performance units outstanding. As of December 30, 2023, no qualifying events have occurred or are probable of occurring, no awards under the Plan have vested (i.e., upon reaching a minimum qualifying event value), and no liability or compensation expense has been recognized by us. Further, no amounts have been paid under the Plan.
Sale Leaseback of German Warehouse
In the second quarter of 2022, we sold one of our warehouses in Germany and leased it back from the buyer for an initial lease term of ten years. The net proceeds of the sale-leaseback transaction were $43,691 and it resulted in a gain of $7,050 which is included within SG&A expenses on the Consolidated Statements of Income for the Fiscal Year Ended 2022 (Successor).
Revision of Previously Issued Consolidated Financial Statements
In connection with our year-end reporting procedures, we identified errors related to the balance sheet presentation of our multi-period software license agreements, for which the unbilled amounts were incorrectly presented on a gross basis within accounts receivable, other current assets, other assets, accounts payable,
F-22
Table of Contents
INGRAM MICRO HOLDING CORPORATION
NOTES TO CONSOLIDATED FINANCIAL STATEMENTS
(Amounts in thousands, except share, unit and per share data)
accrued expenses and other, and other liabilities. These unbilled amounts should have been presented on a net basis as we serve as an agent in these transactions and do not have a present right to payment until we have the contractual right to bill and the vendor satisfies its performance obligations under the arrangement.
Management evaluated the impact of the errors on previously issued consolidated financial statements and concluded all impacted financial statements were not materially misstated. However, in order to present the Consolidated Balance Sheet as of December 31, 2022 (Successor) and Consolidated Statement of Cash Flows for the Fiscal Year Ended 2022 (Successor) correctly and consistent with the consolidated financial statements for the Fiscal Year Ended 2023, we have determined to revise these financial statements as follows:
| December 31, 2022 (Successor) | ||||||||||||
| As Reported | Adjustments | As Revised | ||||||||||
| Consolidated Balance Sheet: |
||||||||||||
| Trade accounts receivable |
$ | 8,892,419 | $ | (109,431 | ) | $ | 8,782,988 | |||||
| Other current assets |
$ | 830,357 | $ | (116,726 | ) | $ | 713,631 | |||||
| Total current assets |
$ | 16,400,842 | $ | (226,157 | ) | $ | 16,174,685 | |||||
| Other assets |
$ | 401,323 | $ | (12,338 | ) | $ | 388,985 | |||||
| Total assets |
$ | 19,326,470 | $ | (238,495 | ) | $ | 19,087,975 | |||||
| Accounts payable |
$ | 9,958,081 | $ | (111,364 | ) | $ | 9,846,717 | |||||
| Accrued expenses and other |
$ | 1,284,773 | $ | (112,340 | ) | $ | 1,172,433 | |||||
| Total current liabilities |
$ | 11,531,439 | $ | (223,704 | ) | $ | 11,307,735 | |||||
| Other liabilities |
$ | 240,265 | $ | (14,791 | ) | $ | 225,474 | |||||
| Total liabilities |
$ | 16,268,402 | $ | (238,495 | ) | $ | 16,029,907 | |||||
| Total liabilities and stockholders equity |
$ | 19,326,470 | $ | (238,495 | ) | $ | 19,087,975 | |||||
| Fiscal Year Ended 2022 (Successor) | ||||||||||||
| As Reported | Adjustments | As Revised | ||||||||||
| Consolidated Statement of Cash Flow |
||||||||||||
| Cash Flow from Operating Activities: |
||||||||||||
| Changes in operating assets and liabilities, net of effects of acquisitions: |
||||||||||||
| Trade accounts receivable |
$ | (700,007 | ) | $ | 109,431 | $ | (590,576 | ) | ||||
| Other assets |
$ | (159,386 | ) | $ | 129,064 | $ | (30,322 | ) | ||||
| Accounts payable |
$ | 461,108 | $ | (111,364 | ) | $ | 349,744 | |||||
| Accrued expenses and other |
$ | (39,908 | ) | $ | (127,131 | ) | $ | (167,039 | ) | |||
| Cash used in operating activities |
$ | (361,109 | ) | $ | | $ | (361,109 | ) | ||||
In the second quarter of 2024, we identified fraudulent activity within our India Professional Services business involving certain of our then-current employees (which employees were subsequently terminated or resigned) and a relatively small number of customers of our subsidiary in India dating back to 2023. As part of these activities and the collusion of these former employees and customers, our India Professional Services business hired providers and paid for professional services that were never performed and recognized revenue for the sale of professional services that were never provided by our customers to the end users. As a result, our net sales and cost of sales, selling, general and administrative expenses, and provision for income taxes were misstated on our Consolidated Statements of Income, and our accounts receivable, inventory, other assets, accounts payable, and accrued expenses and other were misstated on our Consolidated Balance Sheets. We are
F-23
Table of Contents
INGRAM MICRO HOLDING CORPORATION
NOTES TO CONSOLIDATED FINANCIAL STATEMENTS
(Amounts in thousands, except share, unit and per share data)
working to recover amounts paid to such customers and we intend to vigorously pursue all legal remedies available to us. We will record a benefit when and if any such amounts are deemed probable of recovery.
Management has determined that these misstatements were not material to the previously issued consolidated financial statements as of and for the Fiscal Year Ended December 30, 2023. However, in order to appropriately reflect the impacts of the identified misstatements in the appropriate period, management has determined to revise the financial statements as of and for the Fiscal Year Ended December 30, 2023. All misstatements related to the India Professional Services business are identified as (1) in the tables below. Additionally, other identified immaterial errors that have been corrected and revised are footnoted with a (2) in the tables below.
In addition, due to the misstatements discussed above we have revised the Earnings Per Share section presented within Note 2, Significant Accounting Policies, the outstanding debt table presented within Note 7, Debt, certain tables within Note 8, Income Taxes, and tables containing net sales and operating income information within Note 12, Segment Information.
The following tables present a summary of the impact of the corrections by financial statement line item:
| December 30, 2023 | ||||||||||||||||
| As Reported | Adjustment | As Revised | ||||||||||||||
| Consolidated Balance Sheet: |
||||||||||||||||
| Trade accounts receivable (1) (2) |
$ | 8,996,887 | $ | (8,088 | ) | $ | 8,988,799 | |||||||||
| (11,737 | ) | (1 | ) | |||||||||||||
| 3,649 | (2 | ) | ||||||||||||||
| Inventory (1) |
4,660,130 | (506 | ) | 4,659,624 | ||||||||||||
|
|
|
|
|
|
|
|||||||||||
| Total current assets |
15,362,911 | (8,594 | ) | 15,354,317 | ||||||||||||
| Other assets (1) |
447,997 | 2,469 | 450,466 | |||||||||||||
|
|
|
|
|
|
|
|||||||||||
| Total assets |
$ | 18,426,439 | $ | (6,125 | ) | $ | 18,420,314 | |||||||||
|
|
|
|
|
|
|
|||||||||||
| Accounts payable (1) |
$ | 9,230,685 | $ | (246 | ) | $ | 9,230,439 | |||||||||
| Accrued expenses and other (1) |
1,063,600 | (2,191 | ) | 1,061,409 | ||||||||||||
| Short-term debt and current maturities of long-term debt (2) |
262,070 | 3,649 | 265,719 | |||||||||||||
|
|
|
|
|
|
|
|||||||||||
| Total current liabilities |
10,661,919 | 1,212 | 10,663,131 | |||||||||||||
|
|
|
|
|
|
|
|||||||||||
| Total liabilities |
14,912,813 | 1,212 | 14,914,025 | |||||||||||||
| Retained earnings (1) |
1,087,113 | (7,337 | ) | 1,079,776 | ||||||||||||
|
|
|
|
|
|
|
|||||||||||
| Total stockholders equity |
3,513,626 | (7,337 | ) | 3,506,289 | ||||||||||||
|
|
|
|
|
|
|
|||||||||||
| Total liabilities and stockholders equity |
$ | 18,246,439 | $ | (6,125 | ) | $ | 18,240,314 | |||||||||
|
|
|
|
|
|
|
|||||||||||
F-24
Table of Contents
INGRAM MICRO HOLDING CORPORATION
NOTES TO CONSOLIDATED FINANCIAL STATEMENTS
(Amounts in thousands, except share, unit and per share data)
| Fiscal Year Ended 2023 | ||||||||||||
| As Reported | Adjustment | As Revised | ||||||||||
| Consolidated Statement of Income |
||||||||||||
| Net sales (1) |
$ | 48,053,046 | $ | (12,682 | ) | $ | 48,040,364 | |||||
| Cost of sales (1) |
44,504,074 | (10,847 | ) | 44,493,227 | ||||||||
|
|
|
|
|
|
|
|||||||
| Gross profit |
3,548,972 | (1,835 | ) | 3,547,137 | ||||||||
| Selling, general and administrative expenses (1) |
2,576,023 | 7,970 | 2,583,993 | |||||||||
|
|
|
|
|
|
|
|||||||
| Total operating expenses |
2,594,820 | 7,970 | 2,602,790 | |||||||||
|
|
|
|
|
|
|
|||||||
| Income from operations |
954,152 | (9,805 | ) | 944,347 | ||||||||
|
|
|
|
|
|
|
|||||||
| Income before income taxes |
532,306 | (9,805 | ) | 522,501 | ||||||||
| Provision for income taxes (1) |
172,257 | (2,468 | ) | 169,789 | ||||||||
|
|
|
|
|
|
|
|||||||
| Net income |
$ | 360,049 | $ | (7,337 | ) | $ | 352,712 | |||||
|
|
|
|
|
|
|
|||||||
| Basic and diluted earnings per share for Class A and Class B shares |
13,546 | (276 | ) | 13,270 | ||||||||
|
|
|
|
|
|
|
|||||||
| Fiscal Year Ended 2023 | ||||||||||||
| As Reported | Adjustment | As Revised | ||||||||||
| Consolidated Statement of Comprehensive Income |
||||||||||||
| Net income (1) |
$ | 360,049 | $ | (7,337 | ) | $ | 352,712 | |||||
|
|
|
|
|
|
|
|||||||
| Comprehensive income |
$ | 466,020 | $ | (7,337 | ) | $ | 458,683 | |||||
|
|
|
|
|
|
|
|||||||
| Fiscal Year Ended 2023 | ||||||||||||||||||||||||
| As Reported | Adjustment | As Revised | As Reported | Adjustment | As Revised | |||||||||||||||||||
| Retained Earnings | Total | |||||||||||||||||||||||
| Consolidated Statement of Stockholders Equity: |
||||||||||||||||||||||||
| Net income (1) |
$ | 360,049 | $ | (7,337 | ) | $ | 352,712 | $ | 360,049 | $ | (7,337 | ) | $ | 352,712 | ||||||||||
|
|
|
|
|
|
|
|
|
|
|
|
|
|||||||||||||
| Balance at December 30, 2023 |
$ | 1,087,113 | $ | (7,337 | ) | $ | 1,079,776 | $ | 3,513,626 | $ | (7,337 | ) | $ | 3,506,289 | ||||||||||
|
|
|
|
|
|
|
|
|
|
|
|
|
|||||||||||||
F-25
Table of Contents
INGRAM MICRO HOLDING CORPORATION
NOTES TO CONSOLIDATED FINANCIAL STATEMENTS
(Amounts in thousands, except share, unit and per share data)
| Fiscal Year Ended 2023 | ||||||||||||||||
| As Reported | Adjustment | As Revised | ||||||||||||||
| Consolidated Statement of Cash Flow |
||||||||||||||||
| Cash flows from operating activities: |
||||||||||||||||
| Net income (1) |
$ | 360,049 | $ | (7,337 | ) | $ | 352,712 | |||||||||
| Changes in operating assets and liabilities, net of effects of acquisitions: |
||||||||||||||||
| Trade accounts receivable (1) (2) |
(311,690 | ) | 11,857 | (299,833 | ) | |||||||||||
| 11,737 | (1 | ) | ||||||||||||||
| 120 | (2 | ) | ||||||||||||||
| Inventory (1) |
771,890 | 506 | 772,396 | |||||||||||||
| Other assets (1) |
(73,128 | ) | (2,469 | ) | (75,597 | ) | ||||||||||
| Accounts payable (1) |
(738,143 | ) | (246 | ) | (738,389 | ) | ||||||||||
| Accrued expenses and other (1) |
(80,787 | ) | (2,191 | ) | (82,978 | ) | ||||||||||
|
|
|
|
|
|
|
|||||||||||
| Cash provided by operating activities |
58,704 | 120 | 58,824 | |||||||||||||
|
|
|
|
|
|
|
|||||||||||
| Cash flows from financing activities: |
||||||||||||||||
| Net proceeds from revolving and other credit facilities (2) |
131,587 | (120 | ) | 131,467 | ||||||||||||
|
|
|
|
|
|
|
|||||||||||
| Cash used in financing activities |
(477,820 | ) | (120 | ) | (477,940 | ) | ||||||||||
|
|
|
|
|
|
|
|||||||||||
Reclassifications
Restructuring costs in the prior period have been reclassified from SG&A expenses to restructuring costs to conform with the current period presentation.
Recently Adopted Accounting Standards
In October 2021, the Financial Accounting Standards Board (FASB) issued Accounting Standards Update (ASU) 2021-08, Business Combinations (Topic 805): Accounting for Contract Assets and Contract Liabilities from Contracts with Customers, which requires an acquirer to recognize and measure contract assets and liabilities assumed in a business combination in accordance with Revenue from Contracts with Customers (Topic 606) rather than adjust them to fair value at the acquisition date. The amendments also allow for election of certain practical expedients, which are applied on an acquisition-by-acquisition basis. The adoption of this guidance during the first quarter of 2023 did not have a material impact on our consolidated financial statements.
In September 2022, the FASB issued ASU 2022-04, Liabilities: Supplier Finance Programs (Subtopic 405-50) to enhance the transparency of supplier finance programs used by an entity in connection with the purchase of goods and services. The standard requires entities that use supplier finance programs to disclose the key terms, including a description of payment terms, the confirmed amount outstanding under the program at the end of each reporting period, a description of where those obligations are presented on the balance sheet and an annual rollforward, including the amount of obligations confirmed and the amount paid during the period. The guidance does not affect the recognition, measurement, or financial statement presentation of obligations covered by supplier finance programs. We adopted the guidance under this amendment in the first quarter of 2023, except for the requirement on rollforward information, which is effective for fiscal years beginning after December 15, 2023. See section Supplier Finance Programs within Note 2, Significant Accounting Policies for further discussion of these programs.
F-26
Table of Contents
INGRAM MICRO HOLDING CORPORATION
NOTES TO CONSOLIDATED FINANCIAL STATEMENTS
(Amounts in thousands, except share, unit and per share data)
In March 2020, the FASB issued ASU 2020-04, Reference Rate Reform (Topic 848): Facilitation of the Effects of Reference Rate Reform on Financial Reporting. In December 2022, the FASB issued ASU 2022-05 to extend the adoption date to December 31, 2024. This guidance can be applied at our discretion when or if it becomes applicable until the amended adoption date December 31, 2024. In the second quarter of 2023, the ABL Credit Facility and Term Loan Credit Facility were amended to replace LIBOR with the Secured Overnight Financing Rate (SOFR) as its benchmark rate. The adoption of this guidance did not have a material impact on our consolidated financial statements.
New Accounting Standards
In November 2023, the FASB issued ASU 2023-07, Segment Reporting (Topic 280) Improvements to Reportable Segment Disclosures, which requires public entities to disclose information about their reportable segments significant expenses on an interim and annual basis. This update is effective for annual periods beginning after December 15, 2023, and interim periods within fiscal years beginning after December 15, 2024, and requires retrospective application to all prior periods presented in the financial statements. We are currently evaluating the adoption impact of this ASU will have on our segment reporting disclosures in the notes to our consolidated financial statements.
In December 2023, the FASB issued ASU 2023-09, Income Taxes (Topic 740) Improvements to Income Tax Disclosures, which requires public entities to disclose specific categories in the rate reconciliation and provide additional information for reconciling items that meet a quantitative threshold on an annual basis in order to enhance the transparency and decision usefulness of income tax disclosures. This update is effective for annual periods beginning after December 15, 2024, with early adoption permitted. We are currently evaluating the adoption impact of this ASU will have on our income tax disclosures in the notes to our consolidated financial statements.
Note 3 Purchase Price Allocation
The final purchase price of the Imola Mergers discussed above in Note 1, Organization and Basis of Presentation, was calculated as follows:
| Calculation of merger consideration: |
(in thousands) | |||
| Cash consideration for the share capital of Ingram Micro |
$ | 8,044,012 | ||
| Fair value of contingent consideration(1) |
250,000 | |||
|
|
|
|||
| Total merger consideration |
$ | 8,294,012 | ||
|
|
|
| (1) | The remaining contingent consideration of $75,000 relating to the earn-out was earned and accrued in the fourth quarter of 2021 and was recognized within SG&A expenses in the Consolidated Statements of Income. The resulting total contingent consideration of $325,000 was paid in April 2022. |
Allocation of Purchase Price
The acquisition was financed through borrowings under a new Term Loan Facility of $2,000,000 (the Term Loan Credit Facility), $2,000,000 in proceeds from the issuance of our Senior Secured Notes due May 2029 (the 2029 Notes), borrowings under a new ABL Credit Facility consisting of an ABL revolving credit facility of $3,500,000 (the ABL Revolving Credit Facility), of which $1,270,000 was drawn on the Acquisition Closing
F-27
Table of Contents
INGRAM MICRO HOLDING CORPORATION
NOTES TO CONSOLIDATED FINANCIAL STATEMENTS
(Amounts in thousands, except share, unit and per share data)
Date, and a senior secured asset-based term loan facility of $500,000 (the ABL Term Loan Facility), see Note 7, Debt, and an equity contribution of $2,638,000 by Platinum. The total purchase price was allocated to the assets acquired and liabilities assumed based on their fair values at the acquisition date. In valuing acquired assets and assumed liabilities, fair values are based on, but are not limited to, quoted market prices, expected future cash flows, current replacement costs, market rate assumptions and appropriate discount and growth rates.
The acquisition resulted in a new basis of accounting for Ingram Micro as on the Acquisition Closing Date we applied the acquisition method of accounting based upon the guidance in ASC 805, Business Combinations. In accordance with ASC 805, all of our identifiable assets and liabilities were measured at and adjusted to their estimated fair values as of the Acquisition Closing Date. The difference between the fair value of net assets acquired, including the value of intangible assets acquired, and the consideration was recorded as goodwill.
The final purchase price allocation is as follows:
| (in thousands) | ||||
| Cash and cash equivalents |
$ | 1,904,711 | ||
| Trade accounts receivable |
7,484,011 | |||
| Inventory |
4,841,664 | |||
| Other current assets |
707,085 | |||
|
|
|
|||
| Total current assets |
14,937,471 | |||
| Property and equipment, net |
563,658 | |||
| Operating lease right-of-use assets |
522,709 | |||
| Intangible assets, net |
1,173,129 | |||
| Other assets |
275,587 | |||
|
|
|
|||
| Total identifiable assets acquired |
17,472,554 | |||
| Accounts payable |
8,116,507 | |||
| Accrued expenses and other |
1,033,300 | |||
| Short-term debt and current maturities of long-term debt |
149,234 | |||
| Short-term operating lease liabilities |
142,216 | |||
|
|
|
|||
| Total current liabilities |
9,441,257 | |||
| Long-term debt, less current maturities |
7,687 | |||
| Long-term operating lease liabilities, net of current portion |
369,629 | |||
| Other liabilities |
296,789 | |||
|
|
|
|||
| Net identifiable assets acquired / liabilities assumed |
7,357,192 | |||
| Goodwill |
936,820 | |||
|
|
|
|||
| Total gross considerations |
$ | 8,294,012 | ||
|
|
|
|||
We recorded goodwill of $936,820, which is not deductible for tax purposes.
The fair value of the acquired intangible assets was estimated using the relief-from-royalty method for our trade names and developed technology. Under the relief-from-royalty method, the fair value estimate of the acquired trade name and developed technology was determined based on the present value of the economic royalty savings associated with the ownership or possession of the trade name and developed technology based on an estimated royalty rate applied to the cash flows to be generated by the business. The fair value of the trade name and developed technology acquired as a result of the acquisition was $550,000.
F-28
Table of Contents
INGRAM MICRO HOLDING CORPORATION
NOTES TO CONSOLIDATED FINANCIAL STATEMENTS
(Amounts in thousands, except share, unit and per share data)
The fair value of customer relationships acquired in the acquisition was estimated using the excess earnings method. Under the excess earnings method, the value of the intangible asset is equal to the present value of the after-tax cash flows attributable solely to the subject intangible asset. The fair value of customer relationships acquired as a result of the acquisition was $615,000 (see section Long-Lived and Intangible Assets in Note 2 Significant Accounting Policies).
Pro Forma
Our unaudited pro forma net income had the Imola Mergers occurred on January 2, 2021, the beginning of our fiscal year 2021, would be $366,111 for the year ended January 1, 2022. There would be no impact to net sales for the year ended January 1, 2022.
Note 4 Acquisitions, Goodwill and Intangible Assets
2023 Acquisitions
There were no material acquisitions during the Fiscal Year Ended 2023 (Successor).
2022 Acquisitions
There were no material acquisitions during the Fiscal Year Ended 2022 (Successor).
2021 Acquisitions
On January 28, 2021, we completed the acquisition of Canal Digital S.A, a wholesaler of computer and hardware products in Colombia, for a total consideration of $3,622, net of cash acquired. The goodwill recognized in connection with this acquisition is primarily attributable to the enhancement of our Cloud platforms.
On January 28, 2021, we acquired 51% of the outstanding shares of Colsof, a cloud services provider in Latin America, for a total consideration of $8,919, net of cash acquired. The goodwill recognized in connection with this acquisition is primarily attributable to assembled workforce and the enhancement of our IT distribution business in Colombia. The identifiable intangible assets have estimated useful lives of five years. We have the option to acquire all of the remaining shares of Colsof at specified times beginning on the third anniversary of the transaction close.
Each of these acquisitions have been included in our consolidated results of operations since their respective acquisition dates. As a result of the Imola Mergers, all goodwill and intangible assets recognized as a result of these acquisitions has been eliminated. None of the goodwill recorded for financial statement purposes for each of these acquisitions was deductible for tax purposes.
Pro forma results of operations have not been presented for these acquisitions because the effects of the business combination for these acquisitions were not material to our consolidated financial statements.
Earn-outs and Holdbacks
Earn-out liabilities for the Fiscal Year Ended 2022 (Successor) decreased by $330,708 to $4,307, primarily due to the payment of the contingent consideration related to the Imola Mergers of $325,000. Earn-out liabilities for the Fiscal Year Ended 2023 (Successor) increased by $84 to $4,391. Holdback liabilities for the Fiscal Year Ended 2022 (Successor) and the Fiscal Year Ended 2023 (Successor) decreased by $2,097 to $1,099 and $988 to $111, respectively.
F-29
Table of Contents
INGRAM MICRO HOLDING CORPORATION
NOTES TO CONSOLIDATED FINANCIAL STATEMENTS
(Amounts in thousands, except share, unit and per share data)
Note 5 Property and Equipment
Property and equipment consist of the following:
| December 31, 2022 (Successor) |
December 30, 2023 (Successor) |
|||||||
| Land |
$ | 4,102 | $ | 4,251 | ||||
| Buildings and leasehold improvements |
70,010 | 87,088 | ||||||
| Distribution equipment |
119,553 | 161,424 | ||||||
| Computer equipment and software |
268,099 | 357,630 | ||||||
|
|
|
|
|
|||||
| 461,764 | 610,393 | |||||||
| Accumulated depreciation |
(158,384 | ) | (247,596 | ) | ||||
|
Construction-in-progress |
46,070 | 89,816 | ||||||
|
|
|
|
|
|||||
| Property and equipment, net |
$ | 349,450 | $ | 452,613 | ||||
|
|
|
|
|
|||||
Depreciation expense was $67,743, $87,022, $106,072 and $97,145 for the Predecessor Period from January 3, 2021 to July 2, 2021 and the Successor Periods from July 3, 2021 to January 1, 2022, the Fiscal Year Ended 2022 and the Fiscal Year Ended 2023, respectively.
Note 6 Leases
Our leasing portfolio includes lease arrangements for our warehouses, distribution centers, corporate offices and equipment. We lease substantially all our facilities on varying terms which often include one or more options to renew. We include options to extend in the lease term if they are reasonably certain of being exercised. We do not have residual value guarantees associated with our leases.
The following table includes the components of our rent expense recorded in SG&A expense:
| Predecessor | Successor | Successor | Successor | |||||||||||||
| Period from January 3, 2021 to July 2, 2021 |
Period from July 3, 2021 to January 1, 2022 |
Fiscal Year Ended |
Fiscal Year Ended |
|||||||||||||
| 2022 | 2023 | |||||||||||||||
| Operating lease cost |
$ | 78,628 | $ | 75,432 | $ | 101,263 | $ | 108,644 | ||||||||
| Variable lease cost |
31,109 | 33,123 | 46,804 | 42,110 | ||||||||||||
| Short-term lease cost |
5,639 | 5,251 | 7,129 | 5,640 | ||||||||||||
|
|
|
|
|
|
|
|
|
|||||||||
| Total |
$ | 115,376 | $ | 113,806 | $ | 155,196 | $ | 156,394 | ||||||||
|
|
|
|
|
|
|
|
|
|||||||||
Certain leases contain variable payments, which are expensed as incurred and not included in our operating lease right-of-use assets and operating lease liabilities. These amounts primarily include payments for maintenance, utilities, taxes, and insurance on our office and fulfillment center leases. Operating lease right-of-use assets and operating lease liabilities are recognized based on the present value of future minimum lease payments at lease commencement. Certain adjustments to our operating lease right-of-use assets may be required for items such as initial direct costs paid or incentives received. We calculate the present value of our leases using an estimated incremental borrowing rate, which requires judgment. Our incremental borrowing rate is based upon an estimate of our regional secured borrowing rates. The estimated secured borrowing rates used at the date of adoption for each lease varies in accordance with the term as well as geographical region of the lease.
F-30
Table of Contents
INGRAM MICRO HOLDING CORPORATION
NOTES TO CONSOLIDATED FINANCIAL STATEMENTS
(Amounts in thousands, except share, unit and per share data)
As of December 30, 2023, annual scheduled lease payments were as follows:
| 2024 |
$ | 123,847 | ||
| 2025 |
107,343 | |||
| 2026 |
94,273 | |||
| 2027 |
67,923 | |||
| 2028 |
46,761 | |||
| Thereafter |
129,488 | |||
|
|
|
|||
| Total lease payments |
569,635 | |||
| Less: imputed interest |
(97,932 | ) | ||
|
|
|
|||
| Present value of lease liabilities |
$ | 471,703 | ||
|
|
|
The weighted average remaining term for our leases as of December 31, 2022 and December 30, 2023 was 6.7 years and 6.0 years, respectively. The weighted average discount rate for our leases as of December 31, 2022 and December 30, 2023 was 4.9% and 6.1%, respectively.
Supplemental cash flow information related to our leases is as follows:
| Predecessor | Successor | Successor | Successor | |||||||||||||
| Period from January 3, 2021 to July 2, 2021 |
Period from July 3, 2021 to January 1, 2022 |
Fiscal Year Ended | Fiscal Year Ended | |||||||||||||
| 2022 | 2023 | |||||||||||||||
| Cash paid for amounts included in the measurement of operating lease liabilities |
$ | 80,635 | $ | 80,981 | $ | 108,728 | $ | 115,933 | ||||||||
| Operating lease right-of-use assets obtained in exchange for operating lease liabilities |
$ | 14,543 | $ | 79,900 | $ | 145,854 | $ | 154,925 | ||||||||
Note 7 Debt
The carrying value of our outstanding debt consists of the following:
| Successor | Successor | |||||||
| December 31, 2022 |
December 30, 2023 |
|||||||
| Senior secured notes, 4.75% due 2029, net of unamortized deferred financing costs of $44,268 and $37,250, respectively |
$ | 1,955,732 | $ | 1,962,750 | ||||
| Term loan credit facility, net of unamortized discount of $15,714 and $11,733, respectively, and unamortized deferred financing costs of $46,545 and $35,780, respectively |
1,907,741 | 1,362,487 | ||||||
| ABL revolving credit facility |
| 30,000 | ||||||
| Revolving trade accounts receivable-backed financing programs |
327,056 | 331,920 | ||||||
| Lines of credit and other debt |
183,825 | 236,451 | ||||||
|
|
|
|
|
|||||
| 4,374,354 | 3,923,608 | |||||||
| Short-term debt and current maturities of long-term debt |
(200,327 | ) | (265,719 | ) | ||||
|
|
|
|
|
|||||
| $ | 4,174,027 | $ | 3,657,889 | |||||
|
|
|
|
|
|||||
F-31
Table of Contents
INGRAM MICRO HOLDING CORPORATION
NOTES TO CONSOLIDATED FINANCIAL STATEMENTS
(Amounts in thousands, except share, unit and per share data)
Predecessor Debt
In December 2014, we issued through a public offering $500,000 of 4.95% senior unsecured notes due 2024 (2024 Notes), resulting in cash proceeds of $494,995, net of discount and issuance costs of $1,755 and $3,250, respectively. Interest on the notes was payable semiannually on June 15 and December 15. In December 2016, pursuant to the coupon step-up provisions, the interest rate increased 0.50% to 5.45%.
In August 2012, we issued through a public offering $300,000 of 5.00% senior unsecured notes due 2022 (2022 Notes), resulting in cash proceeds of approximately $296,256, net of discount and issuance costs of $1,794 and $1,950, respectively. Interest on the notes was payable semiannually in arrears on February 10 and August 10.
In connection with the Imola Mergers, on July 2, 2021, we provided irrevocable notice to early redeem our 2024 Notes and our 2022 Notes. As the notes were deemed to be legally extinguished, we were required to pay a breakage fee of $94,851 which was included as part of the purchase price consideration, and wrote off deferred financing costs and unamortized discount of $2,641 to interest expense for the Predecessor Period from January 3, 2021 to July 2, 2021.
On July 2, 2021, also in connection with the Imola Mergers, we terminated the following revolving trade accounts receivable-backed financing program in North America and Asia-Pacific.
| i) | A North-America program which provided for up to $1,100,000 in borrowing capacity, originally maturing in September 2022. The interest rate of this program was dependent on designated commercial paper rates (or, in certain circumstances, an alternate rate) plus a predetermined margin. |
| ii) | An Asia-Pacific program which provided for a maximum borrowing capacity of up to 225,000 Australian dollars, originally maturing in June 2022 |
We have a revolving trade accounts receivable-backed financing program in Europe which provided for a borrowing capacity of up to 300,000 and £120,000, originally maturing in September 2023. In the fourth quarter of 2022, the facility was modified providing for a borrowing capacity of up to 375,000, or approximately $414,900 at December 30, 2023 exchange rates. This program, which matures in October 2026, requires certain commitment fees, and borrowings under this program incurred financing costs based on the local short-term bank indicator rate for the currency in which the drawing is made plus a predetermined margin. At December 31, 2022 and December 30, 2023, we had borrowings of $327,056 and $331,920, respectively, under this financing program in Europe. The weighted average interest rate on the outstanding borrowings under this facility, as amended, was 1.3% and 4.4% per annum at December 31, 2022 and December 30, 2023, respectively.
We had a $1,350,000 revolving unsecured credit facility from a syndicate of multinational banks, originally maturing in October 2023, that was terminated as part of the Imola Mergers. The interest rate on this facility was based on LIBOR, plus a predetermined margin that was based on our debt ratings and leverage ratio.
As a result of terminating our revolving trade accounts receivable-based financing programs in North America and Asia-Pacific, and our $1,350,000 revolving unsecured credit facility, we wrote off, in total, $3,122 of unamortized deferred financing costs in the Predecessor Period from January 3, 2021 to July 2, 2021.
On October 13, 2020, we secured a $200,000 uncommitted line of credit with a term of five years. Applicable interest rates are determined at the time of borrowing using the banks money market rate. In the
F-32
Table of Contents
INGRAM MICRO HOLDING CORPORATION
NOTES TO CONSOLIDATED FINANCIAL STATEMENTS
(Amounts in thousands, except share, unit and per share data)
second quarter of 2022, we expanded the capacity of this facility to $300,000. As of December 31, 2022 and December 30, 2023, there were no borrowings outstanding.
Successor Debt
As a result of the Imola Mergers, we entered into the following financing transactions.
On April 22, 2021, in anticipation of the acquisition of Ingram Micro by Platinum, Escrow Issuer offered $2,000,000 Senior Secured Notes due May 2029. Prior to the acquisition, the 2029 Notes were the sole obligation of the Escrow Issuer. Upon consummation of the acquisition on July 2, 2021, the proceeds from the notes were used, in part, to finance the acquisition and repay existing indebtedness. The notes bear interest at a rate of 4.75% per annum, which is payable semi-annually on May 15 and November 15 of each year, beginning on November 15, 2021. On July 2, 2021, we recognized $1,945,205, net of debt issuance costs of $54,795.
On July 2, 2021, we entered into the Term Loan Credit Facility for $2,000,000, the proceeds of which were also used to, among other things, finance a portion of the Imola Mergers and repay certain of our existing indebtedness. We recognized $1,920,761 net of debt issuance costs and discount of $59,239 and $20,000, respectively, related to this facility. The Term Loan Credit Facility will mature on July 2, 2028 and amortizes in equal quarterly installments aggregating to 1.00% per annum. On September 27, 2023, we refinanced our Term Loan Credit Facility, reducing the interest rate spread over SOFR by 50 basis points. Borrowings under the Term Loan Credit Facility, as amended, bear interest at a rate per annum equal to, at our option, either (1) the base rate (which is the highest of (a) the then-current federal funds rate set by the Federal Reserve Bank of New York, plus 0.50%, (b) the prime rate on such day and (c) the one-month SOFR rate published on such date plus 1.11%) plus a margin of 2.0% or (2) SOFR (subject to a 0.50% floor) plus the applicable margin, which may range from 3.11% to 3.43%, based on interest period. In June 2023, we paid down $500,000 of the principal balance of our Term Loan Credit Facility over and above normal quarterly installments, which, as a result of this prepayment, are no longer mandatory. We also amended our interest rate cap agreements (See Note 13, Derivative Financial Instruments) to reflect the updated notional amount of the Term Loan Credit Facility, with the 5.317% upper limit on the SOFR interest rate remaining unchanged under the amended interest rate cap agreements. In connection with the refinancing, we paid down an incremental $50,000 of the principal balance of our Term Loan Credit Facility and recognized a loss of $4,872 related to the recognition of certain unamortized debt issuance costs. Following such repayments, as of December 30, 2023, $1,362,487 remained outstanding under the Term Loan Credit Facility.
On July 2, 2021, we entered into new ABL Credit Facilities providing for senior secured asset-based, multi-currency revolving loans and letter of credit availability in an aggregate amount of up to $3,500,000 (the ABL Revolving Credit Facility), subject to borrowing base capacity and a senior secured asset-based term loan facility of $500,000 (the ABL Term Loan Facility and, together with the ABL Revolving Credit Facility, ABL Credit Facilities), both of which have contractual maturity dates in July 2026. The ABL Term Loan Facility amortizes in equal quarterly installments aggregating to 1.00% per annum. We may borrow under the ABL Revolving Credit Facility only up to our available borrowing base capacity. Borrowings under the ABL Revolving Credit Facility bear interest at a rate per annum equal to, at our option, either (1) the base rate plus a margin ranging (based on the availability under the ABL Revolving Credit Facility) from 0.25% to 0.75% or (2) SOFR (subject to a 0% floor) plus a margin ranging (based on the availability under the ABL Revolving Credit Facility) from 1.25% to 1.75%. Borrowings under the ABL Term Loan Facility bear interest at a rate per annum equal to, at our option, either (1) the base rate plus a margin of 2.50% or (2) SOFR (subject to a 0% floor) plus a margin of 3.50%. We capitalized $84,350 of debt issuance costs on July 2, 2021. As of December 31, 2022 and December 30, 2023, respectively, we had borrowings of $0 and $30,000 under our ABL Revolving Credit
F-33
Table of Contents
INGRAM MICRO HOLDING CORPORATION
NOTES TO CONSOLIDATED FINANCIAL STATEMENTS
(Amounts in thousands, except share, unit and per share data)
Facility. On April 4, 2022, we repaid in full the outstanding borrowings on our ABL Term Loan Facility of $496,250, including $10,724 of unamortized debt issuance costs which was recognized to interest expense in the Fiscal Year Ended December 31, 2022 (Successor), and following such prepayment, there were no borrowings outstanding under our ABL Term Loan Facility.
At December 30, 2023, our actual aggregate capacity under our ABL Revolving Credit Facility and other receivable-backed programs was approximately $3,914,900, of which $361,920 was used. Even if we do not borrow or choose not to borrow to the full available capacity of certain programs, most of our trade accounts receivable-backed financing programs are subject to certain restrictions outlined in our ABL Credit Facilities. These restrictions generally prohibit us from assigning or transferring the underlying eligible receivables as collateral for other financing programs, unless the underlying eligible receivables are sold in conjunction with a dedicated, non-recourse facility.
We also have additional lines of credit, short-term overdraft facilities and other credit facilities with various financial institutions worldwide, which provide for borrowing capacity aggregating $1,331,813 at December 30, 2023. Most of these arrangements are on an uncommitted basis and are reviewed periodically for renewal. At December 31, 2022 and December 30, 2023, respectively, we had $111,224 and $217,463 outstanding under these facilities. The weighted average interest rate on the outstanding borrowings under these facilities, which may fluctuate depending on geographic mix, was 7.9% per annum at December 31, 2022 and December 30, 2023. At December 31, 2022 and December 30, 2023, letters of credit totaling $165,735 and $108,690, respectively, were issued to various customs agencies and landlords to support our subsidiaries. The issuance of these letters of credit reduces our available capacity under the corresponding agreements by the same amount.
We are subject to certain customary affirmative covenants, including reporting and cash management requirements, and certain customary negative covenants that limit our and our subsidiaries ability to incur additional indebtedness or liens, to dispose of assets, to make certain fundamental changes, to enter into restrictive agreements, to make certain investments, loans, advances, guarantees and acquisitions, to prepay certain indebtedness, to pay dividends or other distributions in respect of our and our subsidiaries equity interests and to engage in transactions with affiliates. At December 31, 2022 and December 30, 2023, we were in compliance with all covenants and other requirements in all of our credit facilities.
Note 8 Income Taxes
We account for income taxes under the asset and liability method, which requires the recognition of deferred tax assets and liabilities for the expected future tax consequences of events that have been included in the consolidated financial statements. Under this method, deferred tax assets and liabilities are determined based on the differences between the financial statement and tax bases of assets and liabilities using enacted tax rates in effect for the year in which the differences are expected to reverse. The effect of a change in tax rates on deferred tax assets and liabilities is recognized in income in the period that includes the enactment date. We record adjustments based on filed returns as such returns are finalized and resultant adjustments are identified. The Company has made an accounting policy election to treat Global Intangible Low Tax Income (GILTI) as a current year tax expense in the period in which it is incurred.
F-34
Table of Contents
INGRAM MICRO HOLDING CORPORATION
NOTES TO CONSOLIDATED FINANCIAL STATEMENTS
(Amounts in thousands, except share, unit and per share data)
The components of income before income taxes consist of the following:
| Predecessor | Successor | Successor | Successor | |||||||||||||
| Period from January 3, 2021 to July 2, 2021 |
Period from July 3, 2021 to January 1, 2022 |
Fiscal Year Ended | Fiscal Year Ended | |||||||||||||
| 2022 | 2023 | |||||||||||||||
| United States |
$ | 88,226 | $ | (291,906 | ) | $ | 651,446 | $ | (205,969 | ) | ||||||
| Foreign |
416,728 | 408,663 | 2,163,095 | 728,470 | ||||||||||||
|
|
|
|
|
|
|
|
|
|||||||||
| Total |
$ | 504,954 | $ | 116,757 | $ | 2,814,541 | $ | 522,501 | ||||||||
|
|
|
|
|
|
|
|
|
|||||||||
The provision for income taxes consists of the following:
| Predecessor | Successor | Successor | Successor | |||||||||||||
| Period from January 3, 2021 to July 2, 2021 |
Period from July 3, 2021 to January 1, 2022 |
Fiscal Year Ended | Fiscal Year Ended | |||||||||||||
| 2022 | 2023 | |||||||||||||||
| Current: |
||||||||||||||||
| Federal |
$ | 10,045 | $ | 166 | $ | 133,866 | $ | (8,220 | ) | |||||||
| State |
967 | 6,231 | 25,242 | 2,828 | ||||||||||||
| Foreign |
115,486 | 122,246 | 243,688 | 233,705 | ||||||||||||
|
|
|
|
|
|
|
|
|
|||||||||
| $ | 126,498 | $ | 128,643 | $ | 402,796 | $ | 228,313 | |||||||||
|
|
|
|
|
|
|
|
|
|||||||||
| Deferred: |
||||||||||||||||
| Federal |
$ | 11,909 | $ | (23,287 | ) | $ | 10,380 | $ | (29,113 | ) | ||||||
| State |
510 | (6,499 | ) | 13,371 | (9,818 | ) | ||||||||||
| Foreign |
(12,438 | ) | (78,834 | ) | (6,495 | ) | (19,593 | ) | ||||||||
|
|
|
|
|
|
|
|
|
|||||||||
| (19 | ) | (108,620 | ) | 17,256 | (58,524 | ) | ||||||||||
|
|
|
|
|
|
|
|
|
|||||||||
| Provision for income taxes |
$ | 126,479 | $ | 20,023 | $ | 420,052 | $ | 169,789 | ||||||||
|
|
|
|
|
|
|
|
|
|||||||||
F-35
Table of Contents
INGRAM MICRO HOLDING CORPORATION
NOTES TO CONSOLIDATED FINANCIAL STATEMENTS
(Amounts in thousands, except share, unit and per share data)
The reconciliation of the statutory U.S. federal income tax rate to our effective tax rate is as follows:
| Predecessor | Successor | Successor | Successor | |||||||||||||
| Period from January 3, 2021 to July 2, 2021 |
Period from July 3, 2021 to January 1, 2022 |
Fiscal Year Ended | Fiscal Year Ended | |||||||||||||
| 2022 | 2023 | |||||||||||||||
| U.S. statutory rate |
21.0 | % | 21.0 | % | 21.0 | % | 21.0 | % | ||||||||
| State income taxes, net of federal income tax benefit |
0.3 | (0.2 | ) | | (1.3 | ) | ||||||||||
| U.S. tax on foreign earnings, net of foreign tax credits |
0.3 | 22.0 | | 1.4 | ||||||||||||
| Effect of international operations |
4.7 | 13.0 | 1.0 | 5.7 | ||||||||||||
| Effect of change in valuation allowances |
(2.3 | ) | (54.7 | ) | 0.4 | 1.2 | ||||||||||
| Effect of the CLS Sale |
| | (8.3 | ) | | |||||||||||
| Non-deductible contingent consideration |
| 13.4 | | | ||||||||||||
| Non-deductible transaction costs |
| 6.1 | | | ||||||||||||
| Basis difference in held for sale U.S. subsidiary |
| (8.8 | ) | | | |||||||||||
| Withholding tax |
0.7 | 5.4 | 0.9 | 4.8 | ||||||||||||
| Other |
0.3 | (0.1 | ) | (0.1 | ) | (0.3 | ) | |||||||||
|
|
|
|
|
|
|
|
|
|||||||||
| Effective tax rate |
25.0 | % | 17.1 | % | 14.9 | % | 32.5 | % | ||||||||
|
|
|
|
|
|
|
|
|
|||||||||
Deferred income taxes reflect the tax effect of temporary differences between the carrying amount of assets and liabilities for financial reporting purposes and the amounts used for income tax purposes. Net deferred tax assets and liabilities are classified as non-current in the Consolidated Balance Sheets.
F-36
Table of Contents
INGRAM MICRO HOLDING CORPORATION
NOTES TO CONSOLIDATED FINANCIAL STATEMENTS
(Amounts in thousands, except share, unit and per share data)
Significant components of our net deferred tax assets and liabilities are as follows:
| Successor | Successor | |||||||
| December 31, 2022 | December 30, 2023 | |||||||
| Deferred tax assets: |
||||||||
| Net operating loss carryforwards |
$ | 135,898 | $ | 140,981 | ||||
| Tax credit carryforwards |
25,552 | 52,653 | ||||||
| Interest expense carryforwards |
4,131 | 32,732 | ||||||
| Employee benefits |
59,436 | 57,735 | ||||||
| Inventory |
29,114 | 30,958 | ||||||
| Depreciation and amortization |
24,700 | 25,998 | ||||||
| Operating lease liabilities |
106,722 | 121,195 | ||||||
| Sales return reserve |
35,460 | 35,320 | ||||||
| Allowance on trade accounts receivable |
31,638 | 37,580 | ||||||
| Reserves and accruals not currently deductible for income tax purposes |
28,908 | 29,601 | ||||||
| Other |
34,992 | 44,059 | ||||||
|
|
|
|
|
|||||
| Total deferred tax assets |
516,551 | 608,812 | ||||||
| Valuation allowance |
(77,852 | ) | (106,379 | ) | ||||
|
|
|
|
|
|||||
| Subtotal |
438,699 | 502,433 | ||||||
|
|
|
|
|
|||||
| Deferred tax liabilities: |
||||||||
| Depreciation and amortization |
(249,770 | ) | (237,963 | ) | ||||
| Operating lease assets |
(102,759 | ) | (117,304 | ) | ||||
| Inventory rights |
(29,988 | ) | (30,651 | ) | ||||
| Other |
(46,355 | ) | (48,127 | ) | ||||
|
|
|
|
|
|||||
| Total deferred tax liabilities |
(428,872 | ) | (434,045 | ) | ||||
|
|
|
|
|
|||||
| Net deferred tax assets |
$ | 9,827 | $ | 68,388 | ||||
|
|
|
|
|
|||||
We record net deferred tax assets to the extent we believe these assets will more likely than not be realized. In making such determination, we consider all available positive and negative evidence, including the nature of the deferred tax assets and related statutory limits on utilization, recent operating results, future reversals of existing taxable temporary differences, projected future taxable income, tax planning strategies and recent financial operations. In the event we were to determine that we would be able to realize our deferred income tax assets in the future in excess of or less than the net recorded amount, we would make an adjustment to the valuation allowance which would reduce or increase the provision for income taxes.
We considered the positive and negative evidence related to our Luxembourg treasury operations and concluded its net deferred tax assets, consisting primarily of net operating losses (NOLs), a majority of which have an indefinite life and a smaller portion which have a 14-year remaining life, are more likely than not realizable. Positive evidence included a restructuring of certain intercompany debts that has resulted in significant increase to forecasted income that is objectively verifiable, which supports utilization of these NOLs prior to expiration. As a result, we reversed the full valuation allowance against Luxembourg treasury center deferred tax assets as of January 1, 2022. The release generated a non-cash income tax benefit of $63,519 during the 2021 Successor Period.
F-37
Table of Contents
INGRAM MICRO HOLDING CORPORATION
NOTES TO CONSOLIDATED FINANCIAL STATEMENTS
(Amounts in thousands, except share, unit and per share data)
At December 30, 2023, we had deferred tax assets related to NOL carryforwards of $140,981 along with a valuation allowance of $45,288. $60,290 of the remaining $95,693 of net deferred tax assets associated with NOL carryforwards have no expiration date. The NOL carryforwards with no expiration date are comprised of $44,890 in Luxembourg, $6,170 in Belgium and $9,230 in a number of other jurisdictions worldwide. The $35,403 of net deferred tax assets associated with NOL carryforwards that have an expiration date are comprised of $18,164 in Luxembourg with expirations beginning in 2035 and $17,239 in a number of different jurisdictions with various expiration dates. We monitor our other deferred tax assets for realizability in a similar manner to those described above and will record or release valuation allowances as required to reflect the amount more likely than not to be realized.
At December 30, 2023, our tax credit carryforwards for income tax purposes were $52,653. Foreign tax credit carryforwards in the U.S. represent $47,979 of that amount, and our total valuation allowance related to such credit carryforwards was $47,979. A number of different federal and state credits with various expiration dates comprised the remaining $4,674 of tax credit carryforwards.
As of December 30, 2023, the valuation allowance increased by a net of $28,527 as compared to December 31, 2022, which was driven primarily by an increase in both U.S. foreign tax credits and associated valuation allowances. The remaining change relates primarily to book operating losses in certain subsidiaries that are currently not expected to be realized through future taxable income in these entities, partially offset by previously reserved amounts that became realizable based on taxable income generated in the current year.
During Fiscal Year Ended December 31, 2022 (Successor), the valuation allowance increased by a net of $24,501 as compared to the Successor Period ended January 1, 2022, which was driven primarily by an increase in both U.S. foreign tax credits and associated valuation allowances. The remaining change relates primarily to book operating losses in certain subsidiaries that are currently not expected to be realized through future taxable income in these entities, partially offset by previously reserved amounts that became realizable based on taxable income generated in the current year.
During the Predecessor Period from January 3, 2021 to July 2, 2021, the valuation allowance decreased by a net $11,363 to $140,813, which was driven primarily by a decrease in valuation allowance on deferred tax assets related to NOLs in Belgium. During the Successor Period from July 3, 2021 to January 1, 2022, the valuation allowance decreased by a net $87,462 to $53,351, which was driven primarily by decreases in the valuation allowance on deferred tax assets related to NOLs in Luxembourg and a reduction in both U.S. foreign tax credits and associated valuation allowances. The remaining change in both the Successor and Predecessor Periods relates primarily to previously reserved amounts that became realizable based on taxable income generated in the current year, partially offset by book operating losses in certain subsidiaries that are currently not expected to be realized through future taxable income in these entities.
We have not provided tax on undistributed foreign earnings of approximately $3,700,000 and $3,400,000 as of December 31, 2022 and December 30, 2023, respectively, because such earnings are considered to be indefinitely reinvested. A determination of the deferred tax liability on such earnings is not practical due to the complexity of the hypothetical calculation.
F-38
Table of Contents
INGRAM MICRO HOLDING CORPORATION
NOTES TO CONSOLIDATED FINANCIAL STATEMENTS
(Amounts in thousands, except share, unit and per share data)
A reconciliation of the beginning and ending balances of the total amounts of gross unrecognized tax benefits is as follows:
| Predecessor | Successor | Successor | Successor | |||||||||||||
| Period from January 3, 2021 to July 2, 2021 |
Period from July 3, 2021 to January 1, 2022 |
Fiscal Year Ended | Fiscal Year Ended | |||||||||||||
| 2022 | 2023 | |||||||||||||||
| Gross unrecognized tax benefits at beginning of the year |
$ | 18,148 | $ | 20,113 | $ | 18,978 | $ | 14,339 | ||||||||
| Increases in tax positions for prior years |
2,676 | 503 | 465 | 1,048 | ||||||||||||
| Decreases in tax positions for prior years |
(1,107 | ) | (894 | ) | (315 | ) | (102 | ) | ||||||||
| Increases in tax positions for current year |
897 | 826 | 1,291 | 1,870 | ||||||||||||
| Settlements |
(501 | ) | (768 | ) | (935 | ) | | |||||||||
| Lapse in statute of limitations |
| (802 | ) | (5,145 | ) | (370 | ) | |||||||||
|
|
|
|
|
|
|
|
|
|||||||||
| Gross unrecognized tax benefits at end of the year |
$ | 20,113 | $ | 18,978 | $ | 14,339 | $ | 16,785 | ||||||||
|
|
|
|
|
|
|
|
|
|||||||||
The total amount of gross unrecognized tax benefits is $16,785 as of December 30, 2023, substantially all of which would impact the effective tax rate if recognized.
We recognize interest and penalties related to unrecognized tax benefits in income tax expense. Total accruals for interest and penalties on our unrecognized tax benefits were $8,956 and $9,282 as of December 31, 2022, and December 30, 2023, respectively.
We conduct business globally and, as a result, we and/or one or more of our subsidiaries file income tax returns in the U.S. federal and various state jurisdictions and in over fifty foreign jurisdictions. In the normal course of business, we are subject to examination by taxing authorities in many of the jurisdictions in which we operate. In our material tax jurisdictions, the statute of limitations is open, in general, for three to five years.
In the U.S., our federal tax returns for the 2019 and 2020 tax years are under audit by the IRS. It is possible that within the next twelve months, (1) ongoing tax examinations of our U.S. federal tax returns, individual states, and several of our foreign jurisdictions may be resolved, (2) new tax exams may commence, and (3) other issues may be effectively settled. However, we do not expect our assessment of unrecognized tax benefits to change significantly over that time.
Note 9 Restructuring Costs
In the third quarter of 2022, we elected to discontinue our operations in Russia, where we had an office that employed engineering and coding resources that supported the operation and maintenance of the Ingram Micro Cloud Marketplace. While our operations in Russia were not material to our overall operations or specifically Ingram Micro Cloud Marketplace for any period presented, nor were these operations generating revenue or driving go-to-market operations specific to the Russia market, operating in Russia for non-Russian companies has become increasingly challenging due to the various trade sanctions imposed by both Western governments and the Russian Federation. As a result of this decision, we incurred one-time termination costs of $11,377 during the Fiscal Year Ended 2022 (Successor), consisting of $4,585 related to employee termination benefits and $2,556 related to facility closure costs recognized within restructuring costs on the Consolidated Statements of Income, and $4,236 related to relocation expenses recognized within SG&A expenses on the Consolidated Statements of Income. In the third quarter of 2023, we sold our Russian subsidiary, recognizing a loss of $3,068 within SG&A expenses and leaving us with no remaining presence in Russia.
F-39
Table of Contents
INGRAM MICRO HOLDING CORPORATION
NOTES TO CONSOLIDATED FINANCIAL STATEMENTS
(Amounts in thousands, except share, unit and per share data)
In the Fiscal Year Ended 2023 (Successor), as a result of changing global and local market conditions, we initiated a global restructuring plan which resulted in organizational and staffing changes, including a headcount reduction of 628 employees, primarily in our North American segment. We anticipate additional charges in the range of $24,000 and $28,000 in the first quarter of 2024 in connection with the continuance of this restructuring plan.
A summary of the restructuring costs incurred in the Fiscal Year Ended 2023 (Successor), are as follows:
| Restructuring Costs | ||||||||||||||||
| Headcount Reduction (Number of Employees) |
Employee Termination Benefits |
Facility and Other Costs |
Total Restructuring Costs |
|||||||||||||
| Fiscal Year Ended 2023 (Successor) |
||||||||||||||||
| North America |
$ | 12,050 | $ | 3,401 | $ | 15,451 | ||||||||||
| EMEA |
1,878 | 18 | 1,896 | |||||||||||||
| Asia-Pacific |
1,341 | | 1,341 | |||||||||||||
| Latin America |
109 | | 109 | |||||||||||||
|
|
|
|
|
|
|
|
|
|||||||||
| Total |
628 | $ | 15,378 | $ | 3,419 | $ | 18,797 | |||||||||
|
|
|
|
|
|
|
|
|
|||||||||
The remaining liabilities, which are recorded within accrued expenses and other on our Consolidated Balance Sheets, and activities associated with the aforementioned actions for the Fiscal Year Ended 2023 (Successor) are summarized in the tables below:
| Restructuring Liability | ||||||||||||||||||||
| Beginning Liability |
Expenses, Net |
Amounts Paid and Charged Against the Liability |
Foreign Currency Translation |
Remaining Liability as of December 30, 2023 |
||||||||||||||||
| Fiscal Year Ended 2023 (Successor) |
||||||||||||||||||||
| Employee termination benefits |
$ | 1,144 | $ | 15,378 | $ | (14,549 | ) | $ | 87 | $ | 2,060 | |||||||||
| Facility and other costs |
10 | 3,419 | (3,429 | ) | | | ||||||||||||||
|
|
|
|
|
|
|
|
|
|
|
|||||||||||
| Total |
$ | 1,154 | $ | 18,797 | $ | (17,978 | ) | $ | 87 | $ | 2,060 | |||||||||
|
|
|
|
|
|
|
|
|
|
|
|||||||||||
The remaining liability will be substantially paid by the first quarter of 2024.
Note 10 Commitments and Contingencies
As a company with a substantial employee population and with operations in a large number of countries, Ingram Micro is involved, either as a plaintiff or defendant, in a variety of ongoing claims, demands, suits, investigations, tax matters and proceedings that arise from time to time in the ordinary course of its business. The Company records a provision with respect to a claim, suit, investigation, or proceeding when it is probable that a liability has been incurred and the amount of the loss can be reasonably estimated. If there is at least a reasonable possibility that a material loss may have been incurred associated with pending legal claims, or when assertion of unasserted material claims are considered probable, we disclose such fact, and if reasonably estimable, we provide an estimate of the possible loss or range of possible loss. We record our best estimate of a loss related to pending legal and regulatory proceedings when the loss is considered probable and the amount can be reasonably estimated. Where a range of loss can be reasonably estimated with no best estimate in the range, we record the minimum estimated liability. As additional information becomes available, we assess the potential liability related to pending legal and regulatory proceedings and revise our estimates and update our disclosures accordingly. Significant judgment is required in both the determination of probability and the determination as to whether a loss is reasonably estimable. Our legal costs associated with legal matters are recorded to expense as incurred.
F-40
Table of Contents
INGRAM MICRO HOLDING CORPORATION
NOTES TO CONSOLIDATED FINANCIAL STATEMENTS
(Amounts in thousands, except share, unit and per share data)
The Company reviews claims, suits, investigations and proceedings at least quarterly, and decisions are made with respect to recording or adjusting provisions and disclosing reasonably possible losses or range of losses (individually or in the aggregate). Whether any losses, damages, or remedies finally determined in any claim, suit, investigation or proceeding could reasonably have a material effect on the Companys business, financial condition, results of operations or cash flows will depend on a number of variables, including: the timing and amount of such losses or damages; the structure and type of any such remedies; the significance of the impact of such losses, damages or remedies may have in the consolidated financial statements; and the unique facts and circumstances of the particular matter that may give rise to additional factors.
In March 2021, the Supreme Federal Tribunal in Brazil handed down a decision regarding the incidence of indirect taxes on the sales of off-the-shelf software (New Leading Case). Based on the decision published in the official gazette, the New Leading Case establishes the obligation to pay a certain indirect tax, called ISS, on sales of off-the-shelf software. ISS tax rates vary by municipality, typically approximately 2% to 3%, and are a cost passed on to our customers and based on the New Leading Case would only be applicable to a small subset of our total sales. The New Leading Case departs from the previous 1998 Supreme Court decision that provided that sales of off-the-shelf software were not subject to ISS; therefore, we have adjusted our tax administration of ISS to align to the New Leading Case prospectively. Based on the published New Leading Case and further based upon the advice of counsel, the New Leading Case resulted in establishment of a tax reserve in the first quarter of 2021 for approximately Brazilian Reais 23,301 for unassessed periods where the government could potentially attempt to assert ISS tax is due on certain sales. As a result of the Supreme Federal Tribunal decision which occurred in March 2021, we also believe the total increase in ISS tax exposures, that do not represent a probable liability, including historical cases in litigation, is Brazilian Reais 113,582 ($23,462 at December 30, 2023 exchange rates) in principal and associated penalties, interest, and fines.
In May 2021, the Supreme Federal Tribunal in Brazil delivered a decision regarding whether Imposto de Circulação de Mercadorias e Serviços (ICMS), a state level sales tax, should be included in the tax base used to calculate contributions to the Social Integration Program (PIS) and contributions to Finance Social Security (COFINS), a federal tax levied on revenue. The court decided in the taxpayers favor by excluding ICMS from the PIS and COFINS tax basis. We have recalculated our PIS and COFINS balances for the open tax years of 2012 to 2021 to align with the Supreme Federal Tribunal decision which resulted in a tax benefit being recorded in the second quarter of 2021 of Brazilian Reais 82,380 including principal and interest. We also believe the total increase in PIS and COFINS tax exposures associated with the tax authorities application of the decision, that do not represent a probable liability, is Brazilian Reais 42,665 ($8,813 at December 30, 2023 exchange rates).
Our Brazilian subsidiary has received a number of tax assessments primarily related to reporting compliance topics as well as transaction-tax related matters largely involving applicability of tax and categorization of products and services. The total amount related to these assessments, assessments described above and similar tax exposures that are not yet assessed that gives rise to a probable risk where a reserve has been established is Brazilian Reais 61,945 ($12,795 at December 30, 2023 exchange rates) in principal and associated penalties, interest and fines. The total amount related to these assessments, assessments described above and similar tax exposures that are not yet assessed that we believe gives rise to a reasonably possible loss is Brazilian Reais 735,948 ($152,017 at December 30, 2023 exchange rates) in principal and associated penalties, interest and fines.
In June 2013, the French Competition Authority (FCA) launched an investigation of our subsidiary in France (Ingram Micro France), one of our competitors and one of our vendors in relation to alleged anticompetitive practices. In October 2018, the investigation services of the FCA filed a Statement of Objections against Ingram Micro France, as primary infringer, and Ingram Micro Europe BVBA and Ingram Micro, as parent companies (Ingram). In March 2020, the Board of the FCA issued its decision imposing a fine of
F-41
Table of Contents
INGRAM MICRO HOLDING CORPORATION
NOTES TO CONSOLIDATED FINANCIAL STATEMENTS
(Amounts in thousands, except share, unit and per share data)
62,900 on Ingram regarding volume allocations of Apple products. In July 2020, we appealed the decision of the Board of the FCA to the Paris Court of Appeals. On October 6, 2022, the Paris Court of Appeals issued a decision maintaining the infraction of volume allocation and reducing the fine to 19,500. In November 2022, the Company further appealed this matter to the Cour de Cassation. As the appeal to the Cour de Cassation did not suspend the obligation to pay the fine, in the third quarter of 2022, we recorded a contingent liability at that time within our Consolidated Balance Sheets. Under the payment plan agreed with the French Treasury, Ingram Micro France had already paid approximately $11,000 to date. On November 4, 2022, Ingram Micro France made an additional payment of approximately $9,000 to complete the total amount of the fine and the French Treasury released the third-party surety bond. As a result of the appeals court ruling, the Company determined that the best estimate of probable loss related to this matter is limited to the amounts already paid to date. On June 3, 2021, the reseller whose complaint to the FCA gave rise to the investigation filed a follow-on civil claim in the Paris Commercial Court seeking approximately 95,000 ($100,491 at December 30, 2023 exchange rates) in damages from Ingram, one of our competitors and one of our vendors. On May 30, 2022, the Paris Commercial Court postponed the hearing on this reseller claim pending resolution of the appeal on the main case. On October 24, 2022, the reseller requested the re-opening of the proceedings and we petitioned the Paris Commercial Court to stay the proceedings until the main case is decided by the Cour de Cassation. On May 15, 2023, the Paris Commercial Court did not accept the request to suspend the case and set a calendar for a final hearing in June 2024. We are currently evaluating this matter and cannot currently estimate the probability or amount of any potential loss.
On January 26, 2021, we first learned through external sources that on June 27, 2019, the Court of Additional Chief Metropolitan Magistrate (Special Acts), Central District, Tis Hazari in New Delhi (the New Delhi Court) issued a summoning order naming Ingram Micro India Ltd. (IMIL) as one of 40 legal entity defendants in a criminal complaint. IMIL is accused by the Serious Fraud Office of cheating and criminal conspiracy based on four payments it made over 15 years ago at the request of a certain vendor. In February 2021 outside legal counsel appeared on IMILs behalf at the New Delhi Court and requested relevant documentation pertaining to these charges to assess IMILs legal position. IMIL has vigorously contested the charges as we believe the charges to be meritless and in December 2021 filed a motion to dismiss.
In September 2021, the Companys subsidiary in Saudi Arabia received a tax assessment for Saudi Riyal 238,152 ($63,515 at December 30, 2023 exchange rates) in tax and associated penalties issued by ZATCA (tax and customs authority) asserting that withholding tax was due on software purchases held for resale from non-resident vendors from 2015 through 2020. We believe the tax assessment gives rise to a reasonably possible loss of Saudi Riyal 159,853 ($42,633 at December 30, 2023 exchange rates) in tax and a probable risk of Saudi Riyal 5,598 ($1,493 at December 30, 2023 exchange rates) in tax. In addition, we believe it is likely tax authorities will assess us for software purchases held for resale from non-vendors for the years 2021 through 2023, which gives rise to a reasonably possible loss of Saudi Riyal 264,059 ($70,425 at December 30, 2023 exchange rates) in tax and a probable risk of Saudi Riyal 775 ($207 at December 30, 2023 exchange rates) in tax. Associated penalties have a remote risk due to the assessments being based on a difference in interpretation of Saudi tax law. In October 2023, at our request, the court granted a second 6-month suspension of the case. In early February 2024, ZATCA issued new guidelines on taxation of software purchases, which largely appears to no longer assert that withholding tax is due on software purchases held for resale from non-resident vendors. While we continue to analyze the guidelines it is unclear how ZATCA will utilize the guidelines with respect to the pre-guidelines periods since they are only applicable on a prospective basis; however, we believe they are a positive development as the new guidelines appear to be largely consistent with the interpretation before the assessments were made. We strongly believe that we have administered taxes correctly, that these purchases of software held for resale are not subject to withholding tax and that we will ultimately prevail in this matter.
F-42
Table of Contents
INGRAM MICRO HOLDING CORPORATION
NOTES TO CONSOLIDATED FINANCIAL STATEMENTS
(Amounts in thousands, except share, unit and per share data)
We may be subject to non-income based tax unasserted claims related to transactions with certain non-U.S. affiliates and indirect tax related matters. As of December 30, 2023, the Company is unable to reasonably estimate the possible losses or range of losses, if any, arising from unasserted claims due to a number of factors, including the presence of complex or novel legal theories and the ongoing discovery and development of information important to potential unasserted claims. Claims, suits, investigations and proceedings are inherently uncertain, and it is not possible to predict the ultimate outcome of unasserted claims. It is possible that the Companys business, financial condition, results of operations or cash flows could be materially affected in any particular period by the resolution of potential claims.
As is customary in the IT distribution industry, we have arrangements with certain finance companies that provide inventory-financing facilities for our customers. In conjunction with certain of these arrangements, we have agreements with the finance companies that would require us to repurchase certain inventory that might be repossessed from the customers by the finance companies. Due to various reasons, including among other items, the lack of information regarding the amount of salable inventory purchased from us that is still on hand with the customer at any point in time, repurchase obligations relating to inventory cannot be reasonably estimated. Repurchases of inventory by us under these arrangements have been insignificant to date.
We have guarantees to third parties that provide financing to a limited number of our customers. Net sales under these arrangements accounted for less than one percent of our consolidated net sales for each of the periods presented. The guarantees require us to reimburse the third party for defaults by these customers up to an aggregate of $5,839. The fair value of these guarantees has been recognized as cost of sales on the Consolidated Statements of Income to these customers and is included in accrued expenses and other on the Consolidated Balance Sheets.
Note 11 Employee Awards
Activity related to the cash awards was as follows:
|
Number of Cash Awards (in thousands) |
||||
| Non-vested at January 2, 2021 (Predecessor) |
112,089 | |||
| Granted |
65,747 | |||
| Vested |
(49,796 | ) | ||
| Forfeited |
(27,331 | ) | ||
|
|
|
|||
| Non-vested at July 2, 2021 (Predecessor) |
100,709 | |||
|
|
||||
| Non-vested at July 3, 2021 (Successor) |
100,709 | |||
| Granted |
2,513 | |||
| Vested |
(6,883 | ) | ||
| Forfeited |
(3,014 | ) | ||
|
|
|
|||
| Non-vested at January 1, 2022 (Successor) |
93,325 | |||
| Granted |
45,501 | |||
| Vested |
(45,870 | ) | ||
| Forfeited |
(16,234 | ) | ||
|
|
|
|||
| Non-vested at December 31, 2022 (Successor) |
76,722 | |||
| Granted |
44,885 | |||
| Vested |
(46,690 | ) | ||
| Forfeited |
(7,319 | ) | ||
|
|
|
|||
| Non-vested at December 30, 2023 (Successor) |
67,598 | |||
|
|
|
|||
F-43
Table of Contents
INGRAM MICRO HOLDING CORPORATION
NOTES TO CONSOLIDATED FINANCIAL STATEMENTS
(Amounts in thousands, except share, unit and per share data)
| Predecessor | Successor | Successor | Successor | |||||||||||||
| Period from January 3, 2021 to July 2, 2021 |
Period from July 3, 2021 to January 1, 2022 |
Fiscal Year Ended |
Fiscal Year Ended |
|||||||||||||
| 2022 | 2023 | |||||||||||||||
| Compensation expense - cash awards |
$ | 27,428 | $ | 28,576 | $ | 35,418 | $ | 31,040 | ||||||||
|
|
|
|
|
|
|
|
|
|||||||||
| Related income tax benefit |
$ | 6,857 | $ | 7,144 | $ | 8,854 | $ | 7,760 | ||||||||
|
|
|
|
|
|
|
|
|
|||||||||
As of December 30, 2023, the unrecognized compensation costs related to the cash awards was $31,909. We expect this cost to be recognized over a remaining weighted-average period of approximately 1.4 years.
Activity related to the awards granted in the Participation Plan was as follows:
|
Number of Units (in thousands) |
||||
| Non-vested at July 3, 2021 (Successor) |
| |||
| Granted |
216,875 | |||
| Vested |
| |||
| Forfeited |
| |||
|
|
|
|||
| Non-vested at January 1, 2022 (Successor) |
216,875 | |||
| Granted |
11,039 | |||
| Vested |
| |||
| Forfeited |
(36,200 | ) | ||
|
|
|
|||
| Non-vested at December 31, 2022 (Successor) |
191,714 | |||
| Granted |
4,306 | |||
| Vested |
| |||
| Forfeited |
(1,420 | ) | ||
|
|
|
|||
| Non-vested at December 30, 2023 (Successor) |
194,600 | |||
|
|
|
|||
Through December 30, 2023, there was no compensation cost recognized for these awards.
Note 12 Segment Information
ASC 280, Segment Reporting, establishes standards for reporting information about operating segments. Operating segments are defined as components of an enterprise about which separate financial information is evaluated regularly by the chief operating decision maker (CODM) in deciding how to allocate resources and in assessing performance. Our CODM is our Chief Executive Officer. Our reportable segments coincide with the geographic operating segments which include North America, Europe (which includes Middle East and Africa), Asia-Pacific, and Latin America. The measure of segment profit is income from operations.
Geographic areas in which we operated our reportable segments during 2023 include North America (the United States and Canada), EMEA (Austria, Belgium, Bosnia and Herzegovina, Bulgaria, Croatia, Czech Republic, Denmark, Egypt, Finland, France, Germany, Hungary, Ireland, Israel, Italy, Kosovo, Lebanon, Luxembourg, Macedonia, Morocco, Netherlands, Norway, Oman, Pakistan, Poland, Portugal, Qatar, Romania, Russian Federation, Saudi Arabia, Serbia, Slovenia, Spain, Sweden, Switzerland, Turkey, United Arab Emirates and the United Kingdom), Asia-Pacific (Australia, Bangladesh, the Peoples Republic of China including Hong Kong, India, Indonesia, Japan, Malaysia, New Zealand, Philippines, Singapore, Sri Lanka, and Thailand), and Latin America (Argentina, Brazil, Chile, Colombia, Costa Rica, Ecuador, Mexico, Peru, Uruguay and our Latin American export operations in Miami).
F-44
Table of Contents
INGRAM MICRO HOLDING CORPORATION
NOTES TO CONSOLIDATED FINANCIAL STATEMENTS
(Amounts in thousands, except share, unit and per share data)
We do not allocate time-vested and performance-vested cash-based compensation recognized to our reportable segments (see Note 11, Employee Awards), certain Corporate costs, and the gain from the CLS Sale; therefore, we are reporting these amounts separately . Assets by reportable segment are not presented below as our CODM does not review assets by reportable segment.
Financial information by reportable segment is as follows:
| Predecessor | Successor | Successor | Successor | |||||||||||||
| Period from January 3, 2021 to July 2, 2021 |
Period from July 3, 2021 to January 1, 2022 |
Fiscal Year Ended |
Fiscal Year Ended |
|||||||||||||
| 2022 | 2023 | |||||||||||||||
| Net sales |
||||||||||||||||
| North America |
$ | 10,568,316 | $ | 11,572,674 | $ | 20,908,493 | $ | 18,195,652 | ||||||||
| EMEA |
8,538,634 | 8,526,486 | 15,052,242 | 14,481,069 | ||||||||||||
| Asia-Pacific |
5,519,718 | 6,097,137 | 11,184,575 | 11,573,489 | ||||||||||||
| Latin America |
1,780,201 | 1,852,406 | 3,679,180 | 3,790,154 | ||||||||||||
|
|
|
|
|
|
|
|
|
|||||||||
| Total Net sales |
$ | 26,406,869 | $ | 28,048,703 | $ | 50,824,490 | $ | 48,040,364 | ||||||||
|
|
|
|
|
|
|
|
|
|||||||||
| Income from operations |
||||||||||||||||
| North America |
$ | 201,981 | $ | 202,717 | $ | 414,128 | $ | 350,850 | ||||||||
| EMEA |
170,646 | 196,473 | 314,823 | 317,199 | ||||||||||||
| Asia-Pacific |
114,637 | 127,399 | 230,494 | 247,143 | ||||||||||||
| Latin America |
64,770 | 61,310 | 113,473 | 93,515 | ||||||||||||
| Gain on CLS Sale |
| | 2,283,820 | | ||||||||||||
| Corporate |
894 | (235,563 | ) | (72,390 | ) | (33,320 | ) | |||||||||
| Cash-based compensation |
(27,428 | ) | (28,576 | ) | (35,418 | ) | (31,040 | ) | ||||||||
|
|
|
|
|
|
|
|
|
|||||||||
| Total |
$ | 525,500 | $ | 323,760 | $ | 3,248,930 | $ | 944,347 | ||||||||
|
|
|
|
|
|
|
|
|
|||||||||
| Capital expenditures |
||||||||||||||||
| North America |
$ | 41,352 | $ | 38,867 | $ | 100,671 | $ | 170,862 | ||||||||
| EMEA |
16,827 | 41,342 | 22,507 | 16,221 | ||||||||||||
| Asia-Pacific |
3,973 | 4,064 | 6,190 | 7,943 | ||||||||||||
| Latin America |
1,008 | 2,311 | 6,417 | 6,509 | ||||||||||||
|
|
|
|
|
|
|
|
|
|||||||||
| Total |
$ | 63,160 | $ | 86,584 | $ | 135,785 | $ | 201,535 | ||||||||
|
|
|
|
|
|
|
|
|
|||||||||
| Depreciation |
||||||||||||||||
| North America |
$ | 41,825 | $ | 57,411 | $ | 72,991 | $ | 66,153 | ||||||||
| EMEA |
18,786 | 20,734 | 18,016 | 17,056 | ||||||||||||
| Asia-Pacific |
4,558 | 5,851 | 8,669 | 7,834 | ||||||||||||
| Latin America |
2,574 | 3,026 | 6,396 | 6,102 | ||||||||||||
|
|
|
|
|
|
|
|
|
|||||||||
| Total |
$ | 67,743 | $ | 87,022 | $ | 106,072 | $ | 97,145 | ||||||||
|
|
|
|
|
|
|
|
|
|||||||||
| Amortization of intangible assets |
||||||||||||||||
| North America |
$ | 17,020 | $ | 23,030 | $ | 42,253 | $ | 42,175 | ||||||||
| EMEA |
12,866 | 14,592 | 25,126 | 23,782 | ||||||||||||
| Asia-Pacific |
749 | 11,568 | 20,308 | 17,594 | ||||||||||||
| Latin America |
1,164 | 1,272 | 3,352 | 3,452 | ||||||||||||
|
|
|
|
|
|
|
|
|
|||||||||
| Total |
$ | 31,799 | $ | 50,462 | $ | 91,039 | $ | 87,003 | ||||||||
|
|
|
|
|
|
|
|
|
|||||||||
F-45
Table of Contents
INGRAM MICRO HOLDING CORPORATION
NOTES TO CONSOLIDATED FINANCIAL STATEMENTS
(Amounts in thousands, except share, unit and per share data)
The integration, transition and other costs included in income from operations by reportable segments are as follows:
| Predecessor | Successor | Successor | Successor | |||||||||||||
| Period from January 3, 2021 to July 2, 2021 |
Period from July 3, 2021 to January 1, 2022 |
Fiscal Year Ended | Fiscal Year Ended | |||||||||||||
| Integration, transition and other costs (a) | 2022 | 2023 | ||||||||||||||
| North America |
$ | (1,408 | ) | $ | (369 | ) | $ | (2,334 | ) | $ | 15,745 | |||||
| EMEA |
1,175 | 3,737 | 16,497 | (31 | ) | |||||||||||
| Asia-Pacific |
(161 | ) | | 6,864 | (8 | ) | ||||||||||
| Latin America |
(6,529 | ) | (78 | ) | 2,428 | 4,388 | ||||||||||
| Corporate |
(894 | ) | 235,563 | 72,390 | 33,320 | |||||||||||
| Gain on CLS Sale |
| | (2,283,820 | ) | | |||||||||||
|
|
|
|
|
|
|
|
|
|||||||||
| Total |
$ | (7,817 | ) | $ | 238,853 | $ | (2,187,975 | ) | $ | 53,414 | ||||||
|
|
|
|
|
|
|
|
|
|||||||||
| (a) | Costs are primarily related to (i) professional, consulting and integration costs associated with our acquisitions and the Imola Mergers, and (ii) consulting, retention and transition costs associated with our organizational effectiveness program charged to SG&A. |
Net sales and long-lived assets for the United States, which is our country of domicile, are as follows:
| Predecessor | Successor | Successor | Successor | |||||||||||||||||||||||||||||||||
| Period from January 3, 2021 to July 2, 2021 |
Period from July 3, 2021 to January 1, 2022 |
Fiscal Year Ended | Fiscal Year Ended | |||||||||||||||||||||||||||||||||
| 2022 | 2023 | |||||||||||||||||||||||||||||||||||
| Net sales: |
||||||||||||||||||||||||||||||||||||
| United States |
$ | 9,770,273 | 37 | % | $ | 10,707,388 | 38 | % | $ | 19,464,781 | 38 | % | $ | 17,300,808 | 36 | % | ||||||||||||||||||||
| Outside of the United States |
16,636,596 | 63 | 17,341,315 | 62 | 31,359,709 | 62 | 30,739,556 | 64 | ||||||||||||||||||||||||||||
|
|
|
|
|
|
|
|
|
|
|
|
|
|
|
|
|
|||||||||||||||||||||
| Total |
$ | 26,406,869 | 100 | % | $ | 28,048,703 | 100 | % | $ | 50,824,490 | 100 | % | $ | 48,040,364 | 100 | % | ||||||||||||||||||||
|
|
|
|
|
|
|
|
|
|
|
|
|
|
|
|
|
|||||||||||||||||||||
| December 31, 2022 | December 30, 2023 | December 31, 2022 | December 30, 2023 | |||||||||||||
| Long-lived assets: |
||||||||||||||||
| United States |
$ | 795,801 | $ | 858,364 | 47 | % | 49 | % | ||||||||
| Outside of the United States |
883,768 | 905,387 | 53 | % | 51 | % | ||||||||||
|
|
|
|
|
|
|
|
|
|||||||||
| Total(1) |
$ | 1,679,569 | $ | 1,763,751 | 100 | % | 100 | % | ||||||||
|
|
|
|
|
|
|
|
|
|||||||||
| (1) | Includes $957,471 and $880,433 of intangible assets, net of which $401,998 and $362,572 are located within the United States as of December 31, 2022 and December 30, 2023, respectively. |
F-46
Table of Contents
INGRAM MICRO HOLDING CORPORATION
NOTES TO CONSOLIDATED FINANCIAL STATEMENTS
(Amounts in thousands, except share, unit and per share data)
The following table summarizes additional entity-wide disclosure of net sales by product category for the following periods:
| Predecessor | Successor | Successor | Successor | |||||||||||||||||||||||||||||||||
| Period from January 3, 2021 to July 2, 2021 |
Period from July 3, 2021 to January 1, 2022 |
Fiscal Year Ended | Fiscal Year Ended | |||||||||||||||||||||||||||||||||
| 2022 | 2023 | |||||||||||||||||||||||||||||||||||
| Net sales: |
||||||||||||||||||||||||||||||||||||
| Commercial & Consumer |
$ | 16,900,639 | 64 | % | $ | 18,310,621 | 65 | % | $ | 31,994,972 | 63 | % | $ | 29,149,776 | 61 | % | ||||||||||||||||||||
| Advanced Solutions |
7,329,449 | 28 | % | 8,309,073 | 30 | % | 17,353,836 | 34 | % | 17,883,252 | 37 | % | ||||||||||||||||||||||||
| Cloud-based Solutions |
125,975 | 1 | % | 161,669 | 1 | % | 325,981 | 1 | % | 383,329 | 1 | % | ||||||||||||||||||||||||
| Other(1) |
2,050,806 | 7 | % | 1,267,340 | 4 | % | 1,149,701 | 2 | % | 624,007 | 1 | % | ||||||||||||||||||||||||
|
|
|
|
|
|
|
|
|
|
|
|
|
|
|
|
|
|||||||||||||||||||||
| Total |
$ | 26,406,869 | 100 | % | $ | 28,048,703 | 100 | % | $ | 50,824,490 | 100 | % | $ | 48,040,364 | 100 | % | ||||||||||||||||||||
|
|
|
|
|
|
|
|
|
|
|
|
|
|
|
|
|
|||||||||||||||||||||
| (1) | Other net sales consists mainly of revenues associated with our Commerce & Lifecycle Services business, the majority of which was disposed of and sold effective April 4, 2022. |
Note 13 Derivative Financial Instruments
We use foreign currency forward contracts primarily to manage currency risk associated with foreign currency-denominated trade accounts receivable, accounts payable and intercompany loans. At December 31, 2022 and December 30, 2023, we had no derivatives that were designated as hedging instruments.
In the first quarter of 2023, we entered into agreements to purchase interest rate caps, which established a 5.5% upper limit on the LIBOR interest rate applicable to a substantial portion of the borrowings under the Term Loan Credit Facility through the first quarter of 2025. These interest rate cap agreements qualify for hedge accounting treatment and, accordingly, we recorded the fair value of the agreements as an asset and the change in fair value within accumulated other comprehensive loss during the period in which the change occurs. Due to the cessation of the LIBOR interest rate on June 30, 2023, we amended the interest rate cap agreements during the second quarter of 2023 to establish a 5.317% upper limit on the SOFR interest rate in order to align with the conversion to a SOFR-based rate for the underlying Term Loan Credit Facility. We elected to apply the practical expedient under ASU 2020-04 and continued to apply hedge accounting treatment until September 2023, when we dedesignated the interest rate cap in connection with the refinancing of our Term Loan Credit Facility (See Note 7, Debt), the impact of which was immaterial.
F-47
Table of Contents
INGRAM MICRO HOLDING CORPORATION
NOTES TO CONSOLIDATED FINANCIAL STATEMENTS
(Amounts in thousands, except share, unit and per share data)
The notional amounts and fair values of derivative instruments in our Consolidated Balance Sheets are as follows:
| Notional Amounts(1) | Fair Value | |||||||||||||||
| December 31, 2022 (Successor) |
December 30, 2023 (Successor) |
December 31, 2022 (Successor) |
December 30, 2023 (Successor) |
|||||||||||||
| Derivatives not receiving hedge accounting treatment recorded in: | ||||||||||||||||
| Other current assets: |
||||||||||||||||
| Foreign exchange contracts |
$ | 558,974 | $ | 515,691 | $ | 5,170 | $ | 1,805 | ||||||||
| Interest rate cap |
| 1,099,807 | | 707 | ||||||||||||
| Other(2) |
1,265 | 1,265 | 6,917 | 8,758 | ||||||||||||
| Other assets: |
||||||||||||||||
| Interest rate cap |
| 275,193 | | 177 | ||||||||||||
| Accrued expenses and other: |
||||||||||||||||
| Foreign exchange contracts |
1,187,413 | 1,162,669 | (17,139 | ) | (11,416 | ) | ||||||||||
|
|
|
|
|
|
|
|
|
|||||||||
| Total |
$ | 1,747,652 | $ | 3,054,625 | $ | (5,052 | ) | $ | 31 | |||||||
|
|
|
|
|
|
|
|
|
|||||||||
| (1) | Notional amounts represent the gross amount of foreign currency bought or sold at maturity for foreign exchange contracts. |
| (2) | Related to a convertible note receivable derivative. |
F-48
Table of Contents
INGRAM MICRO HOLDING CORPORATION
NOTES TO CONSOLIDATED FINANCIAL STATEMENTS
(Amounts in thousands, except share, unit and per share data)
The amount recognized in earnings from our derivative instruments not receiving hedge accounting treatment, including ineffectiveness, is recorded in net foreign currency exchange (gain) loss as follows and is largely offset by the change in fair value of the underlying hedged assets or liabilities:
| Predecessor | Successor | Successor | Successor | |||||||||||||||
| Location of (gain) |
Period from January 3, 2021 to July 2, 2021 |
Period from July 3, 2021 to January 1, 2022 |
Fiscal Year Ended | Fiscal Year Ended | ||||||||||||||
| 2022 | 2023 | |||||||||||||||||
| Derivative instruments not qualifying as cash flow hedges: |
||||||||||||||||||
| Net loss (gain) recognized in earnings |
Net foreign currency exchange (gain) loss |
(33,637 | ) | (21,500 | ) | 30,310 | 43,096 | |||||||||||
| Interest expense |
| | | 5,211 | ||||||||||||||
| Derivative instruments qualifying as hedging instruments: |
||||||||||||||||||
| Gain recognized in accumulated other comprehensive income |
| | | (1,188 | ) | |||||||||||||
| Gain reclassified from accumulated other comprehensive income to interest expense |
Interest expense |
| | | (349 | ) | ||||||||||||
There were no material gain or loss amounts excluded from the assessment of effectiveness. We report our derivatives at fair value as either assets or liabilities within our Consolidated Balance Sheets. See Note 14, Fair Value Measurements, for information on derivative fair values recorded on our Consolidated Balance Sheets for the periods presented.
Note 14 Fair Value Measurements
Our assets and liabilities carried at fair value are classified and disclosed in one of the following three categories: Level 1 quoted market prices in active markets for identical assets and liabilities; Level 2 observable market-based inputs or unobservable inputs that are corroborated by market data; and Level 3 unobservable inputs that are not corroborated by market data.
F-49
Table of Contents
INGRAM MICRO HOLDING CORPORATION
NOTES TO CONSOLIDATED FINANCIAL STATEMENTS
(Amounts in thousands, except share, unit and per share data)
As of December 31, 2022, our assets and liabilities measured at fair value on a recurring basis are categorized in the table below:
| December 31, 2022 (Successor) | ||||||||||||||||
| Total | Level 1 | Level 2 | Level 3 | |||||||||||||
| Assets: |
||||||||||||||||
| Derivative assets |
$ | 12,087 | $ | | $ | 12,087 | $ | | ||||||||
| Investments held in Rabbi Trust |
70,432 | 70,432 | | | ||||||||||||
|
|
|
|
|
|
|
|
|
|||||||||
| Total assets at fair value |
$ | 82,519 | $ | 70,432 | $ | 12,087 | $ | | ||||||||
|
|
|
|
|
|
|
|
|
|||||||||
| Liabilities: |
||||||||||||||||
| Derivative liabilities |
$ | 17,139 | $ | | $ | 17,139 | $ | | ||||||||
| Contingent consideration |
4,307 | | | 4,307 | ||||||||||||
|
|
|
|
|
|
|
|
|
|||||||||
| Total liabilities at fair value |
$ | 21,446 | $ | | $ | 17,139 | $ | 4,307 | ||||||||
|
|
|
|
|
|
|
|
|
|||||||||
As of December 30, 2023, our assets and liabilities measured at fair value on a recurring basis are categorized in the table below:
| December 30, 2023 (Successor) | ||||||||||||||||
| Total | Level 1 | Level 2 | Level 3 | |||||||||||||
| Assets: |
||||||||||||||||
| Derivative assets |
$ | 10,563 | $ | | $ | 10,563 | $ | | ||||||||
| Interest rate cap |
884 | | 884 | | ||||||||||||
| Investments held in Rabbi Trust |
82,498 | 82,498 | | | ||||||||||||
|
|
|
|
|
|
|
|
|
|||||||||
| Total assets at fair value |
$ | 93,945 | $ | 82,498 | $ | 11,447 | $ | | ||||||||
|
|
|
|
|
|
|
|
|
|||||||||
| Liabilities: |
||||||||||||||||
| Derivative liabilities |
$ | 11,416 | $ | | $ | 11,416 | $ | | ||||||||
| Contingent consideration |
4,391 | | | 4,391 | ||||||||||||
|
|
|
|
|
|
|
|
|
|||||||||
| Total liabilities at fair value |
$ | 15,807 | $ | | $ | 11,416 | $ | 4,391 | ||||||||
|
|
|
|
|
|
|
|
|
|||||||||
The fair value of the cash equivalents approximated its carrying value and the gain or loss on the marketable trading securities was recognized in the Consolidated Statements of Income to reflect these investments at fair value.
Our senior secured notes due in 2029 and Term Loan Credit Facility are stated at amortized cost, and their respective fair values were determined based on Level 2 criteria. The fair values and carrying values of these notes are shown in the tables below:
| December 31, 2022 (Successor) | ||||||||||||||||||||
| Fair Value | ||||||||||||||||||||
| Carrying Value |
Total | Level 1 | Level 2 | Level 3 | ||||||||||||||||
| Liabilities: |
||||||||||||||||||||
| Senior secured notes, 4.75% due 2029 |
$ | 1,955,732 | $ | 1,735,000 | $ | | $ | 1,735,000 | $ | | ||||||||||
| Term loan credit facility |
1,907,741 | 1,940,450 | | 1,940,450 | | |||||||||||||||
|
|
|
|
|
|
|
|
|
|
|
|||||||||||
| $ | 3,863,473 | $ | 3,675,450 | $ | | $ | 3,675,450 | $ | | |||||||||||
|
|
|
|
|
|
|
|
|
|
|
|||||||||||
F-50
Table of Contents
INGRAM MICRO HOLDING CORPORATION
NOTES TO CONSOLIDATED FINANCIAL STATEMENTS
(Amounts in thousands, except share, unit and per share data)
| December 30, 2023 (Successor) | ||||||||||||||||||||
| Fair Value | ||||||||||||||||||||
| Carrying Value |
Total | Level 1 | Level 2 | Level 3 | ||||||||||||||||
| Liabilities: |
||||||||||||||||||||
| Senior secured notes, 4.75% due 2029 |
$ | 1,962,750 | $ | 1,875,000 | $ | | $ | 1,875,000 | $ | | ||||||||||
| Term loan credit facility |
1,362,487 | 1,402,950 | | 1,402,950 | | |||||||||||||||
|
|
|
|
|
|
|
|
|
|
|
|||||||||||
| $ | 3,325,237 | $ | 3,277,950 | $ | | $ | 3,277,950 | $ | | |||||||||||
|
|
|
|
|
|
|
|
|
|
|
|||||||||||
The carrying amounts of our trade accounts receivable, accounts payable and accrued expenses and other approximate fair value because of the short maturity of these items. Our ABL Credit Facilities and European revolving trade accounts receivable-backed financing program bear interest at variable rates based on designated local reference rates and commercial paper rates, respectively, plus a predetermined fixed margin. The interest rates of our revolving unsecured credit facilities and other debt are dependent upon the local short-term bank indicator rate for a particular currency, which also resets regularly. The carrying amounts of all these facilities approximate their fair value because of the revolving nature of the borrowings and because the all-in rate (consisting of variable rates and fixed margin) adjusts regularly to reflect current market rates with appropriate consideration for our credit profile.
Note 15 Employee Benefit Plans
Our U.S.-based employee savings benefit plans permit eligible employees to make contributions up to certain limits, which are matched by us at stipulated percentages. Our contributions charged to expense were $7,844, $6,762, $12,901 and $11,589 in the Predecessor Period from January 3, 2021 to July 2, 2021 and the Successor Periods from July 3, 2021 to January 1, 2022, the Fiscal Year Ended 2022 (Successor) and the Fiscal Year Ended 2023 (Successor), respectively.
Deferred Compensation Plan
During 2017, we established a non-qualified deferred compensation plan (NQDC) that provides certain key officers and employees the ability to defer a portion of their compensation until a later date. The assets are held in a Rabbi Trust which invests in various mutual funds as directed by the plan participants. The Rabbi Trust is intended to be used as a source of funds to match respective funding obligations to participants. The assets of the trust are subject to the claims of our creditors in the event that we become insolvent. The assets and liabilities of the plan are recorded within other assets and other liabilities, respectively, in the Consolidated Balance Sheets. Changes in the deferred compensation balance are recorded to compensation expense and reflected within SG&A expenses of our Consolidated Statements of Income. For amounts currently held on the Consolidated Balance Sheets, see Note 14, Fair Value Measurements.
Self-Insurance
In 2020, we began to self-insure coverage for certain U.S. employee medical claims. Amounts accrued for such medical insurance coverage aggregates to $8,467 and $7,051 as of December 31, 2022 and December 30, 2023, respectively, and are classified within accrued expenses and other on the Consolidated Balance Sheet.
F-51
Table of Contents
INGRAM MICRO HOLDING CORPORATION
NOTES TO CONSOLIDATED FINANCIAL STATEMENTS
(Amounts in thousands, except share, unit and per share data)
Note 16 Stockholders Equity
Following Imola Mergers, our certificate of incorporation authorizes us to issue 30,000 shares of Class A common stock and 300 shares of Class B common stock, of which 26,382 and 198, respectively, were issued and outstanding as of December 30, 2023. The rights of the holders of Class A and Class B common stock are identical except for voting rights. Under the Former Parent of Ingram Micro Inc., our certificate of incorporation authorized us to issue 500 shares, of which 100 were issued and outstanding prior to the Imola Mergers.
Dividends Paid to Stockholders
During the Predecessor Period from January 3, 2021 to July 2, 2021, the Board of Directors approved and paid cash dividends totaling $215,182, which were paid to the stockholder of record, GCL Investment Holdings Inc., a subsidiary of HNA Tech. During the Fiscal Year Ended 2022 (Successor), we paid a cash dividend of $1,750,000 to Platinum from the proceeds of the CLS Sale. In addition, we paid a cash dividend of $3,697 to the Aptec Saudi minority interest stockholders of record for the Fiscal Year Ended 2022 (Successor). In the Fiscal Year Ended 2023 (Successor), we paid $9,909 to the Aptec Saudi minority interest stockholders of record, as well as $553 to the Aptec Turkey minority interest stockholders of record.
Note 17 Related Party Transactions
In connection with the Imola Mergers, we entered into a Corporate Advisory Services Agreement (the CASA) with Platinum Equity Advisors, LLC (Platinum Advisors), an entity affiliated with Platinum, pursuant to which Platinum Advisors provides corporate and advisory services to us. The Company will incur an annual fee of $25,000, plus expenses incurred by Platinum Advisors in rendering such services. For the Successor Periods from July 3, 2021 to January 1, 2022, the Fiscal Year Ended 2022 and the Fiscal Year Ended 2023, we incurred fees and expenses of $16,665, $51,767 and $26,927, respectively, under the CASA. These amounts have been included within SG&A expenses within the Consolidated Statements of Income.
In July 2021, we issued loans to management for approximately $7,000 in connection with their participation as non-material limited partners in the Imola Mergers. The loans were fully repaid on April 7, 2022.
In October 2021, we entered into an executive transition agreement with our former CEO and current Executive Chairman which, subject to certain terms, resulted in payments totaling $27,800 in 2022. During the Successor Periods from July 3, 2021 to January 1, 2022 and the Fiscal Year Ended 2022, we recognized $9,400 and $18,683, respectively, of expense related to this agreement.
In March 2022, we repaid in full a loan of approximately $19,805 due to an entity affiliated with Platinum that was issued in connection with the Imola Mergers.
Note 18 Quarterly Information (Unaudited)
During the second quarter of 2023, we identified the following four errors, identified as (1a), (1b), (1c), and (1d) below, related to an error in the accounting for and presentation of certain of our trade accounts receivable factoring programs:
(1a) errors in the accounting for and presentation of certain programs located in EMEA that contained a deferred purchase price (DPP). As the trade receivables are sold on a non-recourse basis and have met the derecognition and sale accounting criteria under ASC 860, the entire amount of trade receivables sold on the date of sale should have been derecognized from the Consolidated Balance Sheets, with the DPP portion of the
F-52
Table of Contents
INGRAM MICRO HOLDING CORPORATION
NOTES TO CONSOLIDATED FINANCIAL STATEMENTS
(Amounts in thousands, except share, unit and per share data)
receivables sold and recognized as an other current asset on our Consolidated Balance Sheets. We had been incorrectly derecognizing the portion of trade receivables sold upon payment of the DPP. In addition, the DPP should have been disclosed as a non-cash investing activity on the date of sale and the cash proceeds from the payment of the DPP should have been presented as an investing activity in our Consolidated Statements of Cash Flows instead of an operating activity where it was incorrectly recorded;
(1b) errors in the accounting for and presentation of the servicing of our sold trade receivables in certain of our factoring programs, whereby we collect cash payments from our customers on behalf of the financial institutions. These obligations were previously incorrectly recorded as a contra-asset within trade accounts receivable or within accounts payable on the Consolidated Balance Sheets with the net change in unremitted cash collections presented within operating activities on the Consolidated Statement of Cash Flows. Unremitted amounts have been corrected to be presented within accrued expenses and other on the Consolidated Balance Sheets with the net change in unremitted cash collections presented within financing activities on the Consolidated Statement of Cash Flows;
(1c) errors in the accounting for and presentation of two programs in EMEA, that upon further review of the arrangement due to the misstatements discussed in (1a) and (1b) above, were determined not to have met the criteria for derecognition and sale accounting under ASC 860. As such, amounts have been restated to present these programs as short-term borrowings, for which the borrowings and repayments are presented net within financing activities on the Consolidated Statement of Cash Flows; and
(1d) errors in the accounting for and presentation of upfront payments from a financial institution related to one program in EMEA that should have been accounted for as financing transactions, as the activity did not qualify for derecognition and sale accounting under the factoring program.
In addition, identified in the tables below and footnoted with a (2) are immaterial errors that were corrected and restated in accordance with ASC 250.
Upon identification of the errors in the second quarter of 2023, management determined that these errors in aggregate were cumulatively material to the previously issued financial statements and determined it appropriate to restate the Unaudited Condensed Consolidated Statement of Cash Flows for the Thirteen Weeks Ended April 1, 2023 (Successor) and the Unaudited Condensed Consolidated Balance Sheet as of April 1, 2023 (Successor). As the Unaudited Condensed Consolidated Financial Statements have not been reissued and will not be reissued until the financial statements are presented in connection with the corresponding 2024 interim period, the impacts of the restatement on the Unaudited Condensed Consolidated Balance Sheet and the Unaudited Condensed Consolidated Statement of Cash Flows as of and for the thirteen weeks ended April 1, 2023 have been presented below.
Furthermore, as more fully described in Note 2, Significant Accounting Policies, in the fourth quarter of 2023 we identified errors related to the gross versus net presentation of our multi-period software licenses within our Consolidated Balance Sheet as of December 31, 2022 and interim periods within 2023. Management has evaluated and concluded the impact of these errors is not material to any of our previously issued interim unaudited condensed consolidated financial statements. However, because we are presenting the tables below related to the errors identified in the second quarter of 2023, we have added in the table below the impact of these errors related to multi-period software licenses on our Unaudited Condensed Consolidated Balance Sheet and Statement of Cash Flows as of and for the quarter ended April 1, 2023, as footnoted with a (3). Previously issued
F-53
Table of Contents
INGRAM MICRO HOLDING CORPORATION
NOTES TO CONSOLIDATED FINANCIAL STATEMENTS
(Amounts in thousands, except share, unit and per share data)
Unaudited Condensed Consolidated Balance Sheets and Statements of Cash Flows as of and for the twenty-six weeks ended July 1, 2023 and as of and for the thirty-nine weeks ended September 30, 2023, will be revised to correct for these errors when presented in future filings.
| April 1, 2023 (Successor) | ||||||||||||
| As Previously Reported |
Adjustments | As Restated | ||||||||||
| Condensed Consolidated Balance Sheet: |
||||||||||||
| Cash and cash equivalents |
$ | 1,470,427 | $ | (1,563 | ) | $ | 1,468,864 | |||||
| Trade accounts receivable (less allowances of $157,375) |
$ | 8,303,662 | $ | (75,190 | ) | $ | 8,228,472 | |||||
| $ | (34,537 | ) (1a) | ||||||||||
| $ | 380 | (1b) | ||||||||||
| $ | 67,915 | (1c) | ||||||||||
| $ | (108,948 | ) (3) | ||||||||||
| Other current assets |
$ | 985,649 | $ | (262,132 | ) | $ | 723,517 | |||||
| $ | 34,537 | (1a) | ||||||||||
| $ | 1,563 | (2) | ||||||||||
| $ | (298,232 | ) (3) | ||||||||||
| Total current assets |
$ | 15,648,632 | $ | (338,885 | ) | $ | 15,309,747 | |||||
| Other assets |
$ | 423,329 | $ | (21,989 | ) (3) | $ | 401,340 | |||||
| Total assets |
$ | 18,640,763 | $ | (360,874 | ) | $ | 18,279,889 | |||||
| Accounts payable |
$ | 9,066,974 | $ | (126,538 | ) | $ | 8,940,436 | |||||
| $ | (6,133 | ) (1b) | ||||||||||
| $ | (120,405 | ) (3) | ||||||||||
| Accrued expenses and other |
$ | 1,400,942 | $ | (277,262 | ) | $ | 1,123,680 | |||||
| $ | 6,513 | (1b) | ||||||||||
| $ | (283,775 | ) (3) | ||||||||||
| Short-term debt and current maturities of long-term debt |
$ | 132,788 | $ | 67,915 | (1c) | $ | 200,703 | |||||
| Total current liabilities |
$ | 10,700,542 | $ | (335,885 | ) | $ | 10,364,657 | |||||
| Other liabilities |
$ | 251,762 | $ | (24,989 | ) (3) | $ | 226,773 | |||||
| Total liabilities |
$ | 15,454,113 | $ | (360,874 | ) | $ | 15,093,239 | |||||
| Total liabilities and stockholders equity |
$ | 18,640,763 | $ | (360,874 | ) | $ | 18,279,889 | |||||
F-54
Table of Contents
INGRAM MICRO HOLDING CORPORATION
NOTES TO CONSOLIDATED FINANCIAL STATEMENTS
(Amounts in thousands, except share, unit and per share data)
| Thirteen Weeks Ended April 1, 2023 (Successor) | ||||||||||||
| As Previously Reported |
Adjustments | As Restated | ||||||||||
| Condensed Consolidated Statement of Cash Flow |
||||||||||||
| Cash Flow from Operating Activities: |
||||||||||||
| Changes in operating assets and liabilities, net of effects of acquisitions: |
||||||||||||
| Trade accounts receivable |
$ | 599,020 | $ | (31,569 | ) | $ | 567,451 | |||||
| $ | (41,459 | ) (1a) | ||||||||||
| $ | 19,632 | (1b) | ||||||||||
| $ | (25,725 | ) (1c) | ||||||||||
| $ | 16,408 | (1d) | ||||||||||
| $ | 58 | (2) | ||||||||||
| $ | (483 | ) (3) | ||||||||||
| Other assets |
$ | (208,322 | ) | $ | 193,265 | $ | (15,057 | ) | ||||
| $ | 2,196 | (1a) | ||||||||||
| $ | (88 | ) (2) | ||||||||||
| 191,157 | (3) | |||||||||||
| Accounts payable |
$ | (794,899 | ) | $ | (1,235 | ) | $ | (796,134 | ) | |||
| $ | 7,806 | (1b) | ||||||||||
| $ | (9,041 | ) (3) | ||||||||||
| Accrued Expenses and other |
$ | 169,824 | $ | (181,633 | ) (3) | $ | (11,809 | ) | ||||
| Cash provided by operating activities |
$ | 188,773 | $ | (21,172 | ) | $ | 167,601 | |||||
| Cash flows from investing activities |
||||||||||||
| Proceeds from deferred purchase price of factored receivables |
$ | | $ | 39,263 | $ | 39,263 | ||||||
| Cash used in investing activities |
$ | (57,850 | ) | $ | 39,263 | $ | (18,587 | ) | ||||
| Cash flows from financing activities |
||||||||||||
| Change in unremitted cash collections from servicing factored receivables |
$ | | $ | (27,438 | ) (1b) | $ | (27,438 | ) | ||||
| Net proceeds (repayments) from revolving and other credit facilities |
$ | (21,207 | ) | $ | 9,317 | $ | (11,890 | ) | ||||
| $ | 25,725 | (1c) | ||||||||||
| $ | (16,408 | ) (1d) | ||||||||||
| Cash used in financing activities |
$ | (27,278 | ) | $ | (18,121 | ) | $ | (45,399 | ) | |||
| Effect of exchange rate changes on cash and cash equivalents |
$ | 45,170 | $ | (58 | ) | $ | 45,112 | |||||
| Increase in cash and cash equivalents |
$ | 148,815 | $ | (88 | ) | $ | 148,727 | |||||
| Cash and cash equivalents at beginning of period |
$ | 1,321,612 | $ | (1,475 | ) | $ | 1,320,137 | |||||
| Cash and cash equivalents at end of period |
$ | 1,470,427 | $ | (1,563 | ) | $ | 1,468,864 | |||||
| Supplemental disclosure of non-cash investing and financing information: |
||||||||||||
| Amounts obtained as a beneficial interest in exchange for transferring trade receivables in factoring arrangements |
$ | | $ | 36,892 | (1a) | $ | 36,892 | |||||
Note 19 Subsequent Events
As a result of continued market challenges, in February 2024, we began communicating further actions to be taken under our existing global restructuring plan initiated in July 2023, which will result in organizational and
F-55
Table of Contents
INGRAM MICRO HOLDING CORPORATION
NOTES TO CONSOLIDATED FINANCIAL STATEMENTS
(Amounts in thousands, except share, unit and per share data)
staffing changes, including an additional headcount reduction of approximately 525 employees. We currently expect to complete the majority of this restructuring plan by the end of 2024, with total pre-tax expenses related primarily to severance costs expected to range from $24,000 to $28,000.
We have evaluated the impact of subsequent events of Ingram Micro through March 13, 2024, the date the consolidated financial statements were available to be issued, and have determined that no additional subsequent events required disclosure in the consolidated financial statements.
In connection with the reissuance of the financial statements, we have evaluated subsequent events through September 6, 2024, the date the financial statements were available to be reissued, and have determined that no additional subsequent events required disclosure in the consolidated financial statements.
F-56
Table of Contents
INGRAM MICRO HOLDING CORPORATION
NOTES TO CONSOLIDATED FINANCIAL STATEMENTS
(Amounts in thousands, except share, unit and per share data)
SCHEDULE II VALUATION AND QUALIFYING ACCOUNTS
(In 000s)
| Description |
Balance at Beginning of Year |
Charged to Costs and Expenses |
Deductions | Other(*) | Held for Sale |
Balance at End of Year |
||||||||||||||||||
| Allowance for doubtful accounts: |
||||||||||||||||||||||||
| 2023 (Successor) |
$ | 140,328 | 58,197 | (31,591 | ) | (3,207 | ) | | $ | 163,727 | ||||||||||||||
| 2022 (Successor) |
143,311 | 26,804 | (27,706 | ) | (2,081 | ) | | 140,328 | ||||||||||||||||
| Period from July 3, 2021 to January 1, 2022 (Successor) |
141,606 | 24,239 | (16,377 | ) | (3,976 | ) | (2,181 | ) | 143,311 | |||||||||||||||
| Period from January 3, 2021 to July 2, 2021 (Predecessor) |
143,646 | 38,089 | (17,758 | ) | (22,371 | ) | | 141,606 | ||||||||||||||||
| Allowance for sales returns: |
||||||||||||||||||||||||
| 2023 (Successor) |
$ | 23,424 | 6,106 | (11,073 | ) | 459 | | $ | 18,916 | |||||||||||||||
| 2022 (Successor) |
20,753 | 52,407 | (50,117 | ) | 381 | | 23,424 | |||||||||||||||||
| Period from July 3, 2021 to January 1, 2022 (Successor) |
18,919 | 98,472 | (96,505 | ) | (133 | ) | | 20,753 | ||||||||||||||||
| Period from January 3, 2021 to July 2, 2021 (Predecessor) |
17,048 | 75,391 | (73,433 | ) | (87 | ) | | 18,919 | ||||||||||||||||
| (*) | Other includes recoveries, acquisitions, and the effect of fluctuation in foreign currency. |
F-57
Table of Contents
INGRAM MICRO HOLDING CORPORATION
CONDENSED CONSOLIDATED BALANCE SHEETS
(Amounts in thousands, except par value and share data)
(Unaudited)
| December 30, 2023 |
June 29, 2024 |
|||||||
| ASSETS |
||||||||
| Current assets: |
||||||||
| Cash and cash equivalents |
$ | 948,490 | $ | 928,762 | ||||
| Trade accounts receivable (less allowances of $163,727 and $170,392 respectively) |
8,988,799 | 8,116,713 | ||||||
| Inventory |
4,659,624 | 4,739,344 | ||||||
| Other current assets |
757,404 | 784,204 | ||||||
|
|
|
|
|
|||||
| Total current assets |
15,354,317 | 14,569,023 | ||||||
| Property and equipment, net |
452,613 | 471,999 | ||||||
| Operating lease right-of-use assets |
430,705 | 414,159 | ||||||
| Goodwill |
851,780 | 843,099 | ||||||
| Intangible assets, net |
880,433 | 826,142 | ||||||
| Other assets |
450,466 | 487,150 | ||||||
|
|
|
|
|
|||||
| Total assets |
$ | 18,420,314 | $ | 17,611,572 | ||||
|
|
|
|
|
|||||
| LIABILITIES AND STOCKHOLDERS EQUITY |
||||||||
| Current liabilities: |
||||||||
| Accounts payable |
$ | 9,230,439 | $ | 8,917,460 | ||||
| Accrued expenses and other |
1,061,409 | 932,957 | ||||||
| Short-term debt and current maturities of long-term debt |
265,719 | 206,153 | ||||||
| Short-term operating lease liabilities |
105,564 | 103,202 | ||||||
|
|
|
|
|
|||||
| Total current liabilities |
10,663,131 | 10,159,772 | ||||||
| Long-term debt, less current maturities |
3,657,889 | 3,423,377 | ||||||
| Long-term operating lease liabilities, net of current portion |
366,139 | 353,855 | ||||||
| Other liabilities |
226,866 | 210,863 | ||||||
|
|
|
|
|
|||||
| Total liabilities |
14,914,025 | 14,147,867 | ||||||
|
|
|
|
|
|||||
| Commitments and contingencies (Note 10) |
||||||||
| Stockholders equity: |
||||||||
| Class A Common Stock, par value $0.01, 30,000 shares authorized at December 30, 2023 and June 29, 2024, respectively; and 26,382 shares issued and outstanding at December 30, 2023 and June 29, 2024, respectively |
| | ||||||
| Class B Common Stock, par value $0.01, 300 shares authorized at December 30, 2023 and June 29, 2024, respectively; and 198 shares issued and outstanding at December 30, 2023 and June 29, 2024, respectively |
| | ||||||
| Additional paid-in capital |
2,658,000 | 2,658,000 | ||||||
| Retained earnings |
1,079,776 | 1,177,314 | ||||||
| Accumulated other comprehensive loss |
(231,487 | ) | (371,609 | ) | ||||
|
|
|
|
|
|||||
| Total stockholders equity |
3,506,289 | 3,463,705 | ||||||
|
|
|
|
|
|||||
| Total liabilities and stockholders equity |
$ | 18,420,314 | $ | 17,611,572 | ||||
|
|
|
|
|
|||||
See accompanying notes to these unaudited condensed consolidated financial statements.
F-58
Table of Contents
INGRAM MICRO HOLDING CORPORATION
CONDENSED CONSOLIDATED STATEMENTS OF INCOME
(Amounts in thousands, except per share data)
(Unaudited)
| Twenty-Six Weeks Ended July 1, 2023 |
Twenty-Six Weeks Ended June 29, 2024 |
|||||||
| Net sales |
$ | 23,095,490 | $ | 22,876,373 | ||||
| Cost of sales |
21,381,857 | 21,213,005 | ||||||
|
|
|
|
|
|||||
| Gross profit |
1,713,633 | 1,663,368 | ||||||
|
|
|
|
|
|||||
| Operating expenses: |
||||||||
| Selling, general and administrative |
1,312,623 | 1,289,594 | ||||||
| Restructuring costs |
| 22,525 | ||||||
|
|
|
|
|
|||||
| Total operating expenses |
1,312,623 | 1,312,119 | ||||||
|
|
|
|
|
|||||
| Income from operations |
401,010 | 351,249 | ||||||
| Other (income) expense: |
||||||||
| Interest income |
(16,381 | ) | (20,365 | ) | ||||
| Interest expense |
186,430 | 171,536 | ||||||
| Net foreign currency exchange loss |
29,103 | 19,263 | ||||||
| Other |
12,497 | 20,971 | ||||||
|
|
|
|
|
|||||
| Total other (income) expense |
211,649 | 191,405 | ||||||
|
|
|
|
|
|||||
| Income before income taxes |
189,361 | 159,844 | ||||||
| Provision for income taxes |
59,956 | 55,707 | ||||||
|
|
|
|
|
|||||
| Net income |
$ | 129,405 | $ | 104,137 | ||||
|
|
|
|
|
|||||
| Basic and diluted earnings per share for Class A and Class B shares |
$ | 4,869 | $ | 3,918 | ||||
|
|
|
|
|
|||||
See accompanying notes to these unaudited condensed consolidated financial statements.
F-59
Table of Contents
INGRAM MICRO HOLDING CORPORATION
CONDENSED CONSOLIDATED STATEMENTS OF COMPREHENSIVE INCOME (LOSS)
(Amounts in thousands)
(Unaudited)
| Twenty-Six Weeks Ended July 1, 2023 |
Twenty-Six Weeks Ended June 29, 2024 |
|||||||
| Net income |
$ | 129,405 | $ | 104,137 | ||||
|
|
|
|
|
|||||
| Other comprehensive income (loss), net of tax |
||||||||
| Foreign currency translation adjustment |
73,156 | (139,780 | ) | |||||
| Other |
1,200 | (342 | ) | |||||
|
|
|
|
|
|||||
| Other comprehensive income (loss), net of tax |
74,356 | (140,122 | ) | |||||
|
|
|
|
|
|||||
| Comprehensive income (loss) |
$ | 203,761 | $ | (35,985 | ) | |||
|
|
|
|
|
|||||
See accompanying notes to these unaudited condensed consolidated financial statements.
F-60
Table of Contents
INGRAM MICRO HOLDING CORPORATION
CONDENSED CONSOLIDATED STATEMENTS OF STOCKHOLDERS EQUITY
(Amounts in thousands, except share data)
(Unaudited)
| Class A Common Stock | Class B Common Stock |
Additional Paid-in Capital |
Retained Earnings |
Accumulated Other Comprehensive Loss |
Total | |||||||||||||||||||||||||||
| Shares | Amount | Shares | Amount | |||||||||||||||||||||||||||||
| Balance at December 31, 2022 |
26,382 | $ | | 198 | $ | | $ | 2,658,000 | $ | 737,526 | $ | (337,458 | ) | $ | 3,058,068 | |||||||||||||||||
| Dividends declared |
| | | | | (10,462 | ) | | (10,462 | ) | ||||||||||||||||||||||
| Net income |
| | | | | 129,405 | | 129,405 | ||||||||||||||||||||||||
| Foreign currency translation adjustment |
| | | | | | 73,156 | 73,156 | ||||||||||||||||||||||||
| Other |
| | | | | | 1,200 | 1,200 | ||||||||||||||||||||||||
|
|
|
|
|
|
|
|
|
|
|
|
|
|
|
|
|
|||||||||||||||||
| Balance at July 1, 2023 |
26,382 | $ | | 198 | $ | | $ | 2,658,000 | $ | 856,469 | $ | (263,102 | ) | $ | 3,251,367 | |||||||||||||||||
|
|
|
|
|
|
|
|
|
|
|
|
|
|
|
|
|
|||||||||||||||||
| Class A Common Stock | Class B Common Stock |
Additional Paid-in Capital |
Retained Earnings |
Accumulated Other Comprehensive Loss |
Total | |||||||||||||||||||||||||||
| Shares | Amount | Shares | Amount | |||||||||||||||||||||||||||||
| Balance at December 30, 2023 |
26,382 | $ | | 198 | $ | | $ | 2,658,000 | $ | 1,079,776 | $ | (231,487 | ) | $ | 3,506,289 | |||||||||||||||||
| Dividends declared |
| | | | | (6,599 | ) | | (6,599 | ) | ||||||||||||||||||||||
| Net income |
| | | | | 104,137 | | 104,137 | ||||||||||||||||||||||||
| Foreign currency translation adjustment |
| | | | | | (139,780 | ) | (139,780 | ) | ||||||||||||||||||||||
| Other |
| | | | | | (342 | ) | (342 | ) | ||||||||||||||||||||||
|
|
|
|
|
|
|
|
|
|
|
|
|
|
|
|
|
|||||||||||||||||
| Balance at June 29, 2024 |
26,382 | $ | | 198 | $ | | $ | 2,658,000 | $ | 1,177,314 | $ | (371,609 | ) | $ | 3,463,705 | |||||||||||||||||
|
|
|
|
|
|
|
|
|
|
|
|
|
|
|
|
|
|||||||||||||||||
See accompanying notes to these unaudited condensed consolidated financial statements.
F-61
Table of Contents
INGRAM MICRO HOLDING CORPORATION
CONDENSED CONSOLIDATED STATEMENTS OF CASH FLOWS
(Amounts in thousands)
(Unaudited)
| Twenty-Six Weeks Ended July 1, 2023 |
Twenty-Six Weeks Ended June 29, 2024 |
|||||||
| Cash flows from operating activities: |
||||||||
| Net income |
$ | 129,405 | $ | 104,137 | ||||
| Adjustments to reconcile net income to cash provided by operating activities: |
||||||||
| Depreciation and amortization |
94,238 | 92,461 | ||||||
| Noncash charges for interest and bond discount amortization |
16,435 | 15,078 | ||||||
| Amortization of operating lease asset |
53,349 | 64,567 | ||||||
| Deferred income taxes |
(20,943 | ) | (20,493 | ) | ||||
| (Gain) loss on foreign exchange |
(2,177 | ) | 8,163 | |||||
| Other |
(6,054 | ) | (6,803 | ) | ||||
| Changes in operating assets and liabilities, net of effects of acquisitions: |
||||||||
| Trade accounts receivable |
541,426 | 600,052 | ||||||
| Inventory |
591,983 | (163,490 | ) | |||||
| Other assets |
(46,359 | ) | (65,273 | ) | ||||
| Accounts payable |
(608,439 | ) | (257,156 | ) | ||||
| Change in book overdrafts |
(216,612 | ) | 92,193 | |||||
| Operating lease liabilities |
(59,035 | ) | (62,520 | ) | ||||
| Accrued expenses and other |
(151,445 | ) | (99,998 | ) | ||||
|
|
|
|
|
|||||
| Cash provided by operating activities |
315,772 | 300,918 | ||||||
| Cash flows from investing activities: |
||||||||
| Capital expenditures |
(104,207 | ) | (68,688 | ) | ||||
| Proceeds from deferred purchase price of factored receivables |
76,418 | 128,515 | ||||||
| Issuance of notes receivable |
| (43,374 | ) | |||||
| Proceeds from notes receivable |
| 21,597 | ||||||
| Other |
(1,063 | ) | 9,017 | |||||
|
|
|
|
|
|||||
| Cash (used in) provided by investing activities |
(28,852 | ) | 47,067 | |||||
| Cash flows from financing activities: |
||||||||
| Dividends paid to shareholders |
(553 | ) | (6,174 | ) | ||||
| Change in unremitted cash collections from servicing factored receivables |
(10,623 | ) | (8,630 | ) | ||||
| Repayment of Term Loans |
(510,000 | ) | (150,000 | ) | ||||
| Gross proceeds from other debt |
17,078 | 41,826 | ||||||
| Gross repayments of other debt |
(17,927 | ) | (49,833 | ) | ||||
| Net repayments of revolving and other credit facilities |
(12,844 | ) | (136,918 | ) | ||||
| Other |
(466 | ) | (934 | ) | ||||
|
|
|
|
|
|||||
| Cash used in financing activities |
(535,335 | ) | (310,663 | ) | ||||
|
|
|
|
|
|||||
| Effect of exchange rate changes on cash and cash equivalents |
61,070 | (57,050 | ) | |||||
|
|
|
|
|
|||||
| Decrease in cash and cash equivalents |
(187,345 | ) | (19,728 | ) | ||||
| Cash and cash equivalents at beginning of period |
1,320,137 | 948,490 | ||||||
|
|
|
|
|
|||||
| Cash and cash equivalents at end of period |
$ | 1,132,792 | $ | 928,762 | ||||
| Supplemental disclosure of non-cash investing information: |
||||||||
| Amounts obtained as a beneficial interest in exchange for transferring trade receivables in factoring arrangements |
$ | 68,616 | $ | 124,809 | ||||
See accompanying notes to these unaudited condensed consolidated financial statements.
F-62
Table of Contents
INGRAM MICRO HOLDING CORPORATION
NOTES TO UNAUDITED CONDENSED CONSOLIDATED FINANCIAL STATEMENTS
(Amounts in thousands, except share, unit and per share data)
Note 1 Organization and Basis of Presentation
Ingram Micro Holding Corporation and its subsidiaries (Ingram Micro) are primarily engaged in the distribution of information technology (IT) products, cloud and other services worldwide. Ingram Micro operates in North America; Europe, Middle East and Africa (EMEA); Asia-Pacific; and Latin America. Unless the context otherwise requires, the use of the terms Ingram Micro, we, us and our in these notes to the unaudited condensed consolidated financial statements refers to Ingram Micro Holding Corporation together with its consolidated subsidiaries. The use of the term Platinum means Platinum Equity, LLC together with its affiliated investment vehicles.
The accompanying unaudited condensed consolidated financial statements have been prepared by us pursuant to accounting principles generally accepted in the United States of America (U.S. GAAP). In the opinion of management, the accompanying unaudited condensed consolidated financial statements contain all material adjustments (consisting of only normal, recurring adjustments) necessary to fairly state our consolidated financial position as of June 29, 2024, our consolidated results of operations and comprehensive income for the Twenty-Six Weeks Ended July 1, 2023 and the Twenty-Six Weeks Ended June 29, 2024 and our consolidated cash flows for the Twenty-Six Weeks Ended July 1, 2023 and the Twenty-Six Weeks Ended June 29, 2024. The accompanying unaudited condensed consolidated interim financial information has been prepared in accordance with Article 10 of the Securities and Exchange Commissions (SEC) Regulation S-X. Accordingly, as permitted by Article 10 of the SECs Regulation S-X, it does not include all of the information required by U.S. GAAP for complete financial statements. The Condensed Consolidated Balance Sheet as of December 30, 2023 was derived from the audited financial statements at that date and does not include all the disclosures required by U.S. GAAP, as permitted by Article 10 of the SECs Regulation S-X. All intercompany accounts and transactions have been eliminated in consolidation. The consolidated results of operations for the Twenty-Six Weeks Ended June 29, 2024 may not be indicative of the consolidated results of operations that can be expected for the full year.
Note 2 Summary of Significant Accounting Policies
Use of Estimates
The preparation of financial statements in conformity with U.S. GAAP requires us to make estimates and assumptions that affect the reported amounts of assets and liabilities, disclosure of contingent assets and liabilities at the financial statement date and reported amounts of revenue and expenses during the reporting period. We review our estimates and assumptions on an on-going basis. Significant estimates primarily relate to the realizable value of accounts receivable, vendor programs, inventory, goodwill, intangible and other long- lived assets, income taxes and contingencies and litigation. Actual results could differ significantly from these estimates.
Revenue Recognition
In our distribution services model, we buy, hold title to and sell technology products and provide services to resellers, referred to subsequently as our customer, while also providing resellers with multi-vendor solutions, integration services, electronic commerce tools, marketing, financing, training and enablement, technical support and inventory management. In both Technology Solutions, which consists of Client and Endpoint Solutions (formerly referred to as Commercial & Consumer) and Advanced Solutions, and Cloud, we generally sell products and services to our customers (resellers) based on purchase orders instead of long-term contracts. Our agreements are generally not subject to minimum purchase requirements. Our customers place purchase orders with us for each transaction. Generally, our customers may cancel, delay or modify their purchase orders. In
F-63
Table of Contents
INGRAM MICRO HOLDING CORPORATION
NOTES TO UNAUDITED CONDENSED CONSOLIDATED FINANCIAL STATEMENTS
(Amounts in thousands, except share, unit and per share data)
order to set up an account to trade with us, our customers generally have to accept our standard terms and conditions of sale which, together with the purchase order, form a binding contract on each individual order to which the purchase order applies. Our pricing varies greatly and depends on many factors including costs, competitive pressure, availability of inventory, seasonality and vendor promotional programs, among others. We may offer early payment discounts or volume incentive rebates to our customers. The customer contracts relating to our Other services generally provide for an initial term of three to five years, subject to extension by the mutual agreement of the parties, allow for termination for convenience by either party generally after the second year and the pricing is fixed by discrete type of service and typically varies depending on the volume of the relevant services. We do not believe any contract related to our Other services has a material impact on our business or financial condition. Products are delivered via shipment from our facilities, drop-shipment directly from our vendor, or by electronic delivery of keys for software products. We recognize revenue when the control of products is transferred to our customers, which generally happens at the point of shipment or point of delivery.
Any supplemental distribution services we provide are typically recognized over time as the services are performed. Service contracts may be based on a fixed price or on a fixed unit-price per transaction or other objective measure of output. Additionally, we offer services related to our supply chain management and CloudBlue platform. Our fee-based commerce and supply chain services are billed and recognized on a per-item service fee arrangement at the point when the service is provided. Our CloudBlue platform generates revenue through licensing the right to use the intellectual property (on-premise license), which is recognized at a point in time, providing the right to access (platform as a service), which is recognized over time across the term of the contract, or through our cloud marketplace, which is recognized in the amount of the net fee associated with serving as an agent when the services are provided. Service revenues represented less than 10% of total net sales for the Twenty-Six Weeks Ended July 1, 2023 and the Twenty-Six Weeks Ended June 29, 2024. Related contract liabilities were not material for the periods presented.
Agency Services
We have contracts with certain customers where our performance obligation is to arrange for the products or services to be provided by another party. In these arrangements, as we assume an agency relationship in the transaction, revenue is recognized in the amount of the net fee associated with serving as an agent when the services are completed. These arrangements primarily relate to certain fulfillment contracts, as well as sales of certain software products, and extended vendor services, such as vendor warranties.
Variable Consideration
We, under specific conditions, permit our customers to return or exchange products. The provision for estimated sales returns is recorded concurrently with the recognition of revenue. A liability is recorded within accrued expenses and other on the Condensed Consolidated Balance Sheets for estimated product returns based upon historical experience and an asset is recorded within inventory on the Condensed Consolidated Balance Sheets for the amount expected to be recorded for inventory upon product return. Amounts recorded within inventory are $127,143 and $117,835 as of December 30, 2023 and June 29, 2024, respectively.
We also provide volume discounts, early payment discounts and other discounts to certain customers which are considered variable consideration. A provision for such discounts is recorded as a reduction of revenue at the time of sale based on an evaluation of the contract terms and historical experience.
F-64
Table of Contents
INGRAM MICRO HOLDING CORPORATION
NOTES TO UNAUDITED CONDENSED CONSOLIDATED FINANCIAL STATEMENTS
(Amounts in thousands, except share, unit and per share data)
Practical Expedients
We account for shipping and handling activities that occur after the customer has obtained control of a good as fulfillment activities rather than a promised service. Accordingly, we accrue all fulfillment costs related to the shipping and handling of goods at the time of shipment. Additionally, we exclude the amount of certain taxes collected concurrent with revenue-producing activities from revenue.
We disaggregate revenue by geography, which we believe provides a meaningful depiction of the nature of our revenue, (see Note 11, Segment Information).
Book Overdrafts
Book overdrafts of $409,420 and $501,574 as of December 30, 2023 and June 29, 2024, respectively, represent checks issued on disbursement bank accounts but not yet paid by such banks. These amounts are classified as accounts payable in our Condensed Consolidated Balance Sheets. We typically fund these overdrafts through normal collections of funds or transfers from other bank balances at other financial institutions. Under the terms of our facilities with the banks, the respective financial institutions are not legally obligated to honor the book overdraft balances as of December 30, 2023 and June 29, 2024, nor any balance on any given date.
Factoring Programs
We have several uncommitted factoring programs under which trade accounts receivable of several customers may be sold, without recourse, to financial institutions. Available capacity under these programs is dependent on the level of our trade accounts receivable eligible to be sold into these programs and the financial institutions willingness to purchase such receivables. The receivables under these factoring programs are sold at face value and are excluded from our Condensed Consolidated Balance Sheets. We account for these transactions as sales of receivables because control of the underlying asset is transferred and subsequent to the date of transfer, we typically do not have any continuing involvement in the transferred asset, except as discussed below.
For certain of our factoring programs in EMEA, there is a deferred purchase price (DPP) which is paid to us at a later time once the customer pays the factored invoices. Subsequent to the sale, the DPP represents a beneficial interest in the transferred trade accounts receivable and is disclosed as a non-cash investing activity in our Condensed Consolidated Statements of Cash Flows. Accordingly, cash proceeds from the payments of DPPs are presented as investing activities in our Condensed Consolidated Statements of Cash Flows. At December 30, 2023 and June 29, 2024, there were $48,532 and $44,177, respectively, of DPP recorded within other current assets on our Condensed Consolidated Balance Sheets. In arrangements where we collect the customer payments on behalf of the financial institution, the net cash flows related to these collections are reported as financing activities in the Condensed Consolidated Statements of Cash Flows. At December 30, 2023 and June 29, 2024, we recorded unremitted cash within accrued expenses and other of $16,066 and $7,129, respectively.
At December 30, 2023 and June 29, 2024, we had a total of $738,714 and $741,244, respectively, of trade accounts receivable sold to and held by financial institutions under these programs. Factoring fees of $12,203 and $18,473 were incurred for the Twenty-Six Weeks Ended July 1, 2023 and the Twenty-Six Weeks Ended June 29, 2024, respectively. Factoring fees were related to the sale of trade accounts receivable under the facilities and are included in other (income) expense within the other (income) expense section of our Condensed Consolidated Statements of Income.
F-65
Table of Contents
INGRAM MICRO HOLDING CORPORATION
NOTES TO UNAUDITED CONDENSED CONSOLIDATED FINANCIAL STATEMENTS
(Amounts in thousands, except share, unit and per share data)
Inventory
Our inventory consists of finished goods purchased from various vendors for resale. We value our inventory at the lower of its cost or net realizable value, cost being determined on a moving average cost basis, which approximates the first-in, first-out method. We write down our inventory for estimated excess or obsolescence equal to the difference between the cost of inventory and the net realizable value based upon an aging analysis of the inventory on hand, specifically known inventory-related risks (such as technological obsolescence and the nature of vendor terms surrounding price protection and product returns), foreign currency fluctuations for foreign-sourced products and assumptions about future demand. Market conditions or changes in terms and conditions by our vendors that are less favorable than those projected by management may require additional inventory write-downs, which could have an adverse effect on our consolidated financial results. Inventory is determined from the price we pay vendors, including freight and duties; we do not include labor, overhead or other general or administrative costs in our inventory.
Self-Insurance
We self-insure coverage for certain U.S. employee medical claims. Amounts accrued for such medical insurance coverage aggregate to $7,051 and $9,549 as of December 30, 2023 and June 29, 2024, respectively, and is classified within accrued expenses and other on the Condensed Consolidated Balance Sheets.
Dividends Paid to Shareholders
For the Twenty-Six Weeks Ended July 1, 2023, we paid a cash dividend of $553 to the Aptec Turkey minority interest stockholders of record and for the Twenty-Six Weeks Ended June 29, 2024, we paid a cash dividend of $6,174 to Aptec Saudi minority interest stockholders of record.
Earn-outs
We may be required to make earn-out payments upon the achievement of certain predefined targets attributable to acquisitions completed in recent years. At the acquisition date, the value of any earn-out is estimated using various valuation methodologies which include projections of future earnings as defined in each acquisition purchase agreement. Such projections are then discounted to reflect the risk in achieving the projected earnings, as well as the passage of time and time value of money. The fair value measurement of the earn-out is based primarily on significant inputs not observable in an active market and thus represents a Level 3 measurement as defined under U.S. GAAP. Changes in the fair value of the earn-out primarily reflects adjustments to the timing and amount of payments as well as the related accretion driven by the time value of money. These adjustments are recorded within selling, general and administrative (SG&A) expenses within the Condensed Consolidated Statements of Income, as applicable. The fair value of earn-out contingent consideration is presented within accrued expenses and other in our Condensed Consolidated Balance Sheets. For the amounts currently recognized on the Condensed Consolidated Balance Sheets, see Note 5, Fair Value Measurements.
Supplier Finance Programs
As part of our ongoing efforts to manage our working capital, we have worked with our vendors to optimize our terms and conditions, which include the related payment terms. We are party to agreements, initiated either by the vendor or us, which allow vendors, at their discretion, to determine invoices that they want to sell to participating financial institutions. We are not a party to the agreements between the participating financial institutions and the vendors in connection with these programs, and the financial institutions do not provide us
F-66
Table of Contents
INGRAM MICRO HOLDING CORPORATION
NOTES TO UNAUDITED CONDENSED CONSOLIDATED FINANCIAL STATEMENTS
(Amounts in thousands, except share, unit and per share data)
with incentives such as rebates. There are no assets pledged under these agreements and no interest is charged by the financial institutions as balances are typically paid when they are due. Certain agreements may require a parent guarantee, although parent guarantees are also required in certain vendor agreements that do not involve financial institutions. The payment terms under these arrangements typically range from 30 to 90 days. Certain programs provide for extended payment terms which are within standard industry practice and consistent with the range of payment terms we negotiate with our vendors, regardless of whether they have an agreement with a financial institution. At December 30, 2023 and June 29, 2024, the outstanding payment obligations under these arrangements included in accounts payable in the Condensed Consolidated Balance Sheets were $2,373,913 and $1,904,555, respectively.
In situations where amounts are not paid within the specified payment terms and interest is incurred, we reclassify the amount from accounts payable to debt. There were no outstanding payment obligations under these programs included in short-term debt and current maturities of long-term debt in the Condensed Consolidated Balance Sheets as of December 30, 2023 and June 29, 2024, respectively.
Revision of Previously Issued Unaudited Condensed Consolidated Financial Statements
In connection with our prior year-end reporting procedures, we identified errors related to the balance sheet presentation of our multi-period software license agreements, for which the unbilled amounts were incorrectly presented on a gross basis within accounts receivable, other current assets, other assets, accounts payable, accrued expenses and other, and other liabilities. These unbilled amounts should have been presented on a net basis as we serve as an agent in these transactions and do not have a present right to payment until we have the contractual right to bill and the vendor satisfies its performance obligations under the arrangement.
Upon identification, management evaluated and concluded the impact of these errors was not material to any of our previously issued interim unaudited condensed consolidated financial statements. However, in order to present the condensed consolidated financial statements for the Twenty-Six Weeks Ended July 1, 2023 correctly and consistent with the condensed consolidated financial statements for the Twenty-Six Weeks Ended June 29, 2024, we have revised the Condensed Consolidated Statement of Cash Flows for that period as follows:
| Twenty-Six Weeks Ended July 1, 2023 | ||||||||||||
| As Reported | Adjustment | As Revised | ||||||||||
| Condensed Consolidated Statement of Cash Flows: |
||||||||||||
| Cash flows from Operating Activities: |
||||||||||||
| Changes in operating assets and liabilities, net of effects of acquisitions: |
||||||||||||
| Trade accounts receivable |
$ | 456,612 | $ | 84,814 | $ | 541,426 | ||||||
| Other assets |
$ | (255,600 | ) | $ | 209,241 | $ | (46,359 | ) | ||||
| Accounts payable |
$ | (537,064 | ) | $ | (71,375 | ) | $ | (608,439 | ) | |||
| Accrued expenses and other |
$ | 71,235 | $ | (222,680 | ) | $ | (151,445 | ) | ||||
| Cash provided by operating activities |
$ | 315,772 | $ | | $ | 315,772 | ||||||
In the second quarter of 2024, we identified fraudulent activity within our India Professional Services business involving certain of our then-current employees (which employees were subsequently terminated or resigned) and a relatively small number of customers of our subsidiary in India dating back to 2023. As part of these activities and the collusion of these former employees and customers, our India Professional Services business hired providers and paid for professional services that were never performed and recognized revenue for the sale of professional services that were never provided by our customers to the end users. As a result, our net
F-67
Table of Contents
INGRAM MICRO HOLDING CORPORATION
NOTES TO UNAUDITED CONDENSED CONSOLIDATED FINANCIAL STATEMENTS
(Amounts in thousands, except share, unit and per share data)
sales, cost of sales, selling, general and administrative expenses, and provision for income taxes were misstated on our Condensed Consolidated Statements of Income, and our accounts receivable, inventory, other current assets, other assets, accounts payable, and accrued expenses and other were misstated on our Condensed Consolidated Balance Sheets. We are working to recover amounts paid to such customers, and we intend to vigorously pursue all legal remedies available to us. We will record a benefit when and if any such amounts are deemed probable of recovery.
Management has determined that these misstatements were not material to the previously issued consolidated financial statements as of and for the Fiscal Year Ended December 30, 2023, and the Thirteen Weeks Ended March 30, 2024. However, in order to appropriately reflect the impacts of the identified misstatements in the appropriate period, management has determined to revise the financial statements as of and for the Fiscal Year Ended December 30, 2023, which have been revised and are included in the Audited Consolidated Financial Statements, and the Thirteen Weeks Ended March 30, 2024, the next time such financial statements are filed. All misstatements related to the India Professional Services business are identified as (1) in the tables below. Additionally, other identified immaterial errors that have been corrected and revised are footnoted with a (2) in the tables below.
The following tables present a summary of the impact of the corrections by financial statement line item:
| March 30, 2024 | ||||||||||||
| As Reported | Adjustment | As Revised | ||||||||||
| Condensed Consolidated Balance Sheet: |
||||||||||||
| Trade accounts receivable (1) (2) |
$ | 8,297,613 | $ | (15,301 | ) | $ | 8,282,312 | |||||
| (18,896 | )(1) | |||||||||||
| 3,595 | (2) | |||||||||||
| Inventory (1) |
4,679,975 | (3,382 | ) | 4,676,593 | ||||||||
| Other current assets (1) |
735,795 | 404 | 736,199 | |||||||||
|
|
|
|
|
|
|
|||||||
| Total current assets |
14,570,960 | (18,279 | ) | 14,552,681 | ||||||||
| Other assets (1) |
483,334 | 4,076 | 487,410 | |||||||||
|
|
|
|
|
|
|
|||||||
| Total assets |
$ | 17,651,495 | $ | (14,203 | ) | $ | 17,637,292 | |||||
|
|
|
|
|
|
|
|||||||
| Accounts payable (1) |
$ | 8,518,159 | $ | (2,504 | ) | $ | 8,515,655 | |||||
| Accrued expenses and other (1) |
1,009,487 | (3,582 | ) | 1,005,905 | ||||||||
| Short-term debt and current maturities of long-term debt (2) |
351,591 | 3,595 | 355,186 | |||||||||
|
|
|
|
|
|
|
|||||||
| Total current liabilities |
9,984,654 | (2,491 | ) | 9,982,163 | ||||||||
|
|
|
|
|
|
|
|||||||
| Total liabilities |
14,618,012 | (2,491 | ) | 14,615,521 | ||||||||
| Retained earnings (1) |
1,141,040 | (11,712 | ) | 1,129,328 | ||||||||
|
|
|
|
|
|
|
|||||||
| Total stockholders equity |
3,483,483 | (11,712 | ) | 3,471,771 | ||||||||
|
|
|
|
|
|
|
|||||||
| Total liabilities and stockholders equity |
$ | 17,651,495 | $ | (14,203 | ) | $ | 17,637,292 | |||||
|
|
|
|
|
|
|
|||||||
F-68
Table of Contents
INGRAM MICRO HOLDING CORPORATION
NOTES TO UNAUDITED CONDENSED CONSOLIDATED FINANCIAL STATEMENTS
(Amounts in thousands, except share, unit and per share data)
| Thirteen Weeks Ended March 30, 2024 | ||||||||||||
| As Reported | Adjustment | As Revised | ||||||||||
| Condensed Consolidated Statement of Income |
||||||||||||
| Net sales (1) |
$ | 11,345,520 | $ | (10,586 | ) | $ | 11,334,934 | |||||
| Cost of sales (1) |
10,506,173 | (6,177 | ) | 10,499,996 | ||||||||
|
|
|
|
|
|
|
|||||||
| Gross profit |
839,347 | (4,409 | ) | 834,938 | ||||||||
| Selling, general and administrative expenses (1) |
640,175 | 1,977 | 642,152 | |||||||||
|
|
|
|
|
|
|
|||||||
| Total operating expenses |
662,840 | 1,977 | 664,817 | |||||||||
|
|
|
|
|
|
|
|||||||
| Income from operations |
176,507 | (6,386 | ) | 170,121 | ||||||||
|
|
|
|
|
|
|
|||||||
| Income before income taxes |
83,067 | (6,386 | ) | 76,681 | ||||||||
| Provision for income taxes (1) |
29,140 | (2,011 | ) | 27,129 | ||||||||
|
|
|
|
|
|
|
|||||||
| Net income |
$ | 53,927 | $ | (4,375 | ) | $ | 49,552 | |||||
|
|
|
|
|
|
|
|||||||
| Basic and diluted earnings per share for Class A and Class B shares |
2,029 | (165 | ) | 1,864 | ||||||||
|
|
|
|
|
|
|
|||||||
| Thirteen Weeks Ended March 30, 2024 | ||||||||||||
| As Reported | Adjustment | As Restated | ||||||||||
| Condensed Consolidated Statement of Comprehensive Income |
||||||||||||
| Net income (1) |
$ | 53,927 | $ | (4,375 | ) | $ | 49,552 | |||||
|
|
|
|
|
|
|
|||||||
| Comprehensive income |
$ | (30,143 | ) | $ | (4,375 | ) | $ | (34,518 | ) | |||
|
|
|
|
|
|
|
|||||||
| Thirteen Weeks Ended March 30, 2024 | ||||||||||||||||||||||||
| As Reported | Adjustment | As Revised | As Reported | Adjustment | As Revised | |||||||||||||||||||
| Retained Earnings | Total | |||||||||||||||||||||||
| Condensed Consolidated Statement of Stockholders Equity: |
||||||||||||||||||||||||
| Balance at December 30, 2023 (1) |
$ | 1,087,113 | $ | (7,337 | ) | $ | 1,079,776 | $ | 3,513,626 | $ | (7,337 | ) | $ | 3,506,289 | ||||||||||
| Net income (1) |
53,927 | (4,375 | ) | 49,552 | 53,927 | (4,375 | ) | 49,552 | ||||||||||||||||
|
|
|
|
|
|
|
|
|
|
|
|
|
|||||||||||||
| Balance at March 30, 2024 |
$ | 1,141,040 | $ | (11,712 | ) | $ | 1,129,328 | $ | 3,483,483 | $ | (11,712 | ) | $ | 3,471,771 | ||||||||||
|
|
|
|
|
|
|
|
|
|
|
|
|
|||||||||||||
F-69
Table of Contents
INGRAM MICRO HOLDING CORPORATION
NOTES TO UNAUDITED CONDENSED CONSOLIDATED FINANCIAL STATEMENTS
(Amounts in thousands, except share, unit and per share data)
| Thirteen Weeks Ended March 30, 2024 | ||||||||||||
| As Reported | Adjustment | As Revised | ||||||||||
| Condensed Consolidated Statement of Cash Flow |
||||||||||||
| Cash flows used in operating activities: |
||||||||||||
| Net income (1) |
$ | 53,927 | $ | (4,375 | ) | $ | 49,552 | |||||
| Changes in operating assets and liabilities, net of effects of acquisitions: |
||||||||||||
| Trade accounts receivable (1) (2) |
536,150 | 7,144 | 543,294 | |||||||||
| 7,159 | (1) | |||||||||||
| (15 | )(2) | |||||||||||
| Inventory (1) |
(78,254 | ) | 2,876 | (75,378 | ) | |||||||
| Other assets (1) |
(4,588 | ) | (2,011 | ) | (6,599 | ) | ||||||
| Accounts payable (1) |
(577,588 | ) | (2,258 | ) | (579,846 | ) | ||||||
| Accrued expenses and other (1) |
(25,433 | ) | (1,391 | ) | (26,824 | ) | ||||||
|
|
|
|
|
|
|
|||||||
| Cash used in operating activities |
(100,251 | ) | (15 | ) | (100,266 | ) | ||||||
|
|
|
|
|
|
|
|||||||
| Cash flows from financing activities: |
||||||||||||
| Net proceeds from revolving and other credit facilities (2) |
22,475 | 15 | 22,490 | |||||||||
|
|
|
|
|
|
|
|||||||
| Cash provided by financing activities |
3,501 | 15 | 3,516 | |||||||||
|
|
|
|
|
|
|
|||||||
New Accounting Standards
In November 2023, the FASB issued ASU 2023-07, Segment Reporting (Topic 280) Improvements to Reportable Segment Disclosures, which requires public entities to disclose information about their reportable segments significant expenses on an interim and annual basis. This update is effective for annual periods beginning after December 15, 2023, and interim periods within fiscal years beginning after December 15, 2024, and requires retrospective application to all prior periods presented in the financial statements. We are currently evaluating the adoption impact of this ASU will have on our segment reporting disclosures in the notes to our consolidated financial statements.
In December 2023, the FASB issued ASU 2023-09, Income Taxes (Topic 740) Improvements to Income Tax Disclosures, which requires public entities to disclose specific categories in the rate reconciliation and provide additional information for reconciling items that meet a quantitative threshold on an annual basis in order to enhance the transparency and decision usefulness of income tax disclosures. This update is effective for annual periods beginning after December 15, 2024, with early adoption permitted. We are currently evaluating the adoption impact of this ASU will have on our income tax disclosures in the notes to our consolidated financial statements.
Note 3 Employee Awards
We issue cash awards to certain employees, which include both time-vested and performance-vested awards. The time-vested cash awards vest over a time period of three years, and the performance-vested cash awards vest upon the achievement of a certain performance targets measured after a time period of three years.
F-70
Table of Contents
INGRAM MICRO HOLDING CORPORATION
NOTES TO UNAUDITED CONDENSED CONSOLIDATED FINANCIAL STATEMENTS
(Amounts in thousands, except share, unit and per share data)
The performance condition for the cash awards for grants to management is based on earnings growth. Cumulative compensation expense for cash awards is recognized as a liability. Each cash award has a fixed fair value of $1.00. We recognize these compensation costs, net of an estimated forfeiture rate, over the requisite service period of the award, which is the vesting term of the outstanding cash award. We estimate the forfeiture rate based on our historical experience.
Activity related to the cash awards is as follows:
|
Number of Cash Awards (in thousands) |
||||
| Non-vested at December 30, 2023 |
67,598 | |||
| Granted |
33,871 | |||
| Vested |
(21,074 | ) | ||
| Forfeited |
(3,161 | ) | ||
|
|
|
|||
| Non-vested at June 29, 2024 |
77,234 | |||
|
|
|
|||
| Twenty-Six Weeks Ended July 1, 2023 |
Twenty-Six Weeks Ended June 29, 2024 |
|||||||
| Compensation expense cash awards |
$ | 19,338 | $ | 12,245 | ||||
|
|
|
|
|
|||||
| Related income tax benefit |
$ | 4,834 | $ | 3,061 | ||||
|
|
|
|
|
|||||
As of June 29, 2024, the unrecognized compensation costs related to the cash awards were $43,851. We expect these costs to be recognized over a remaining weighted-average period of approximately 1.8 years.
Participation Plan for Certain Key Employees
In July 2021, we adopted the 2021 Participation Plan (the Plan) to provide incentive compensation to certain key management. Under the Plan, participants are granted units, the value of which are related to our financial performance. Half of the units vest over a period of time specified in the applicable award agreement, typically in annual tranches over five years. Once vested, certain qualifying events are required for any payment related to these units, with accelerated vesting in the event of certain change in control or public offering events, in each case subject to the participants continued employment through the applicable vesting date. The other half are payable to participants only upon the occurrence of certain qualifying events. Any payment to a participant under the time-based or performance-based units is conditioned on our reaching a minimum valuation at the time of a qualifying event or through a series of qualifying events. A qualifying event may be either a sale of some or all of our capital stock or a sale of all or substantially all of our assets. Each performance unit granted under the Plan has an initial grant date value of $1.00. As of June 29, 2024, no qualifying events have occurred or are probable of occurring, no awards under the Plan have vested (i.e., upon reaching a minimum qualifying event value) and no liability or compensation expense has been recognized by us. Further, no amounts have been paid under the Plan.
F-71
Table of Contents
INGRAM MICRO HOLDING CORPORATION
NOTES TO UNAUDITED CONDENSED CONSOLIDATED FINANCIAL STATEMENTS
(Amounts in thousands, except share, unit and per share data)
Activity related to the awards granted in the Plan was as follows:
|
Number of Units (in thousands) |
||||
| Non-vested at December 30, 2023 |
194,600 | |||
| Granted |
14,580 | |||
| Vested |
| |||
| Forfeited |
| |||
|
|
|
|||
| Non-vested at June 29, 2024 |
209,180 | |||
|
|
|
|||
Through June 29, 2024, there has been no compensation costs recognized for these awards.
Note 4 Derivative Financial Instruments
We use foreign currency forward contracts that are not designated as hedges primarily to manage currency risk associated with foreign currency-denominated trade accounts receivable, accounts payable and intercompany loans. At December 30, 2023 and June 29, 2024, we had no derivatives that were designated as hedging instruments.
In the first quarter of 2023, we entered into agreements to purchase interest rate caps, which established a 5.5% upper limit on the LIBOR interest rate applicable to a substantial portion of the borrowings under the Term Loan Credit Facility through the first quarter of 2025. These interest rate cap agreements qualify for hedge accounting treatment and, accordingly, we recorded the fair value of the agreements as an asset and the change in fair value within accumulated other comprehensive loss during the period in which the change occurs. Due to the cessation of the LIBOR interest rate on June 30, 2023, we amended the interest rate cap agreements to establish a 5.317% upper limit on the Secured Overnight Financing Rate (SOFR) interest rate in order to align with the conversion to a SOFR-based rate for the underlying Term Loan Credit Facility. We elected to apply the practical expedient under ASU 2020-04 and continued to apply hedge accounting treatment until September 2023 when we dedesignated the interest rate cap in connection with the refinancing of our Term Loan Credit Facility, the impact of which was immaterial.
The notional amounts and fair values of derivative instruments in our Condensed Consolidated Balance Sheets are as follows:
| Notional Amounts(1) | Fair Value | |||||||||||||||
| December 30, 2023 |
June 29, 2024 |
December 30, 2023 |
June 29, 2024 |
|||||||||||||
| Derivatives not receiving hedge accounting treatment recorded in: |
||||||||||||||||
| Other current assets |
||||||||||||||||
| Foreign exchange contracts |
$ | 515,691 | $ | 456,355 | $ | 1,805 | $ | 3,707 | ||||||||
| Interest rate cap |
1,099,807 | 1,375,000 | 707 | 199 | ||||||||||||
| Other(2) |
1,265 | 1,265 | 8,758 | 8,240 | ||||||||||||
| Other assets |
||||||||||||||||
| Interest rate cap |
275,193 | | 177 | | ||||||||||||
| Accrued expenses and other |
||||||||||||||||
| Foreign exchange contracts |
1,162,669 | 433,381 | (11,416 | ) | (2,186 | ) | ||||||||||
|
|
|
|
|
|
|
|
|
|||||||||
| Total |
$ | 3,054,625 | $ | 2,266,001 | $ | 31 | $ | 9,960 | ||||||||
|
|
|
|
|
|
|
|
|
|||||||||
F-72
Table of Contents
INGRAM MICRO HOLDING CORPORATION
NOTES TO UNAUDITED CONDENSED CONSOLIDATED FINANCIAL STATEMENTS
(Amounts in thousands, except share, unit and per share data)
| (1) | Notional amounts represent the gross amount of foreign currency bought or sold at maturity for foreign exchange contracts. |
| (2) | Related to a convertible note receivable derivative. |
The amount recognized in earnings from our derivative instruments is as follows and is largely offset by the change in fair value of the underlying hedged assets or liabilities:
| Location of (gain) |
Twenty-Six Weeks Ended July 1, 2023 |
Twenty-Six Weeks Ended June 29, 2024 |
||||||||
| Derivative instruments not qualifying as cash flow hedges: |
||||||||||
| Net loss (gain) recognized in earnings |
Net foreign currency exchange loss (gain) | $ | 34,588 | $ | (9,955 | ) | ||||
| Interest expense | $ | | $ | 685 | ||||||
| Derivative instruments qualifying as hedging instruments: |
||||||||||
| (Gain) loss recognized in accumulated other comprehensive income |
$ | (1,188 | ) | $ | | |||||
| (Gain) loss reclassified from accumulated other comprehensive income to income |
Interest expense | $ | (12 | ) | $ | 342 | ||||
There were no material gain or loss amounts excluded from the assessment of effectiveness. We report our derivatives at fair value as either assets or liabilities within our Condensed Consolidated Balance Sheets. See Note 5, Fair Value Measurements, for information on derivative fair values recorded on our Condensed Consolidated Balance Sheets for the periods presented.
Note 5 Fair Value Measurements
Our assets and liabilities carried at fair value are classified and disclosed in one of the following three categories: Level 1 quoted market prices in active markets for identical assets and liabilities; Level 2 observable market-based inputs or unobservable inputs that are corroborated by market data; and Level 3 unobservable inputs that are not corroborated by market data.
As of December 30, 2023, our assets and liabilities measured at fair value on a recurring basis are categorized in the table below:
| December 30, 2023 | ||||||||||||||||
| Total | Level 1 | Level 2 | Level 3 | |||||||||||||
| Assets: |
||||||||||||||||
| Derivative assets |
$ | 10,563 | $ | | $ | 10,563 | $ | | ||||||||
| Interest rate cap |
884 | | 884 | | ||||||||||||
| Investments held in Rabbi Trust |
82,498 | 82,498 | | | ||||||||||||
|
|
|
|
|
|
|
|
|
|||||||||
| Total assets at fair value |
$ | 93,945 | $ | 82,498 | $ | 11,447 | $ | | ||||||||
|
|
|
|
|
|
|
|
|
|||||||||
| Liabilities: |
||||||||||||||||
| Derivative liabilities |
$ | 11,416 | $ | | $ | 11,416 | $ | | ||||||||
| Contingent consideration |
4,391 | | | 4,391 | ||||||||||||
|
|
|
|
|
|
|
|
|
|||||||||
| Total liabilities at fair value |
$ | 15,807 | $ | | $ | 11,416 | $ | 4,391 | ||||||||
|
|
|
|
|
|
|
|
|
|||||||||
F-73
Table of Contents
INGRAM MICRO HOLDING CORPORATION
NOTES TO UNAUDITED CONDENSED CONSOLIDATED FINANCIAL STATEMENTS
(Amounts in thousands, except share, unit and per share data)
As of June 29, 2024, our assets and liabilities measured at fair value on a recurring basis are categorized in the table below:
| June 29, 2024 | ||||||||||||||||
| Total | Level 1 | Level 2 | Level 3 | |||||||||||||
| Assets: |
||||||||||||||||
| Derivative assets |
$ | 11,947 | $ | | $ | 11,947 | $ | | ||||||||
| Interest rate cap |
199 | | 199 | | ||||||||||||
| Investments held in Rabbi Trust |
88,193 | 88,193 | | | ||||||||||||
|
|
|
|
|
|
|
|
|
|||||||||
| Total assets at fair value |
$ | 100,339 | $ | 88,193 | $ | 12,146 | $ | | ||||||||
|
|
|
|
|
|
|
|
|
|||||||||
| Liabilities: |
||||||||||||||||
| Derivative liabilities |
$ | 2,186 | $ | | $ | 2,186 | $ | | ||||||||
| Contingent consideration |
3,132 | | | 3,132 | ||||||||||||
|
|
|
|
|
|
|
|
|
|||||||||
| Total liabilities at fair value |
$ | 5,318 | $ | | $ | 2,186 | $ | 3,132 | ||||||||
|
|
|
|
|
|
|
|
|
|||||||||
The fair value of the cash equivalents approximated cost and the change in the fair value of the marketable trading securities was recognized in the Condensed Consolidated Statements of Income to reflect these investments at fair value.
Our senior secured notes due in 2029 and Term Loan Credit Facility are stated at amortized cost, and their respective fair values were determined based on Level 2 criteria. The fair values and carrying values of these notes are shown in the tables below:
| December 30, 2023 | ||||||||||||||||||||
| Fair Value | ||||||||||||||||||||
| Total | Level 1 | Level 2 | Level 3 | Carrying Value |
||||||||||||||||
| Senior secured notes, 4.75% due 2029 |
$ | 1,875,000 | $ | | $ | 1,875,000 | $ | | $ | 1,962,750 | ||||||||||
| Term loan credit facility |
1,402,950 | | 1,402,950 | | 1,362,487 | |||||||||||||||
|
|
|
|
|
|
|
|
|
|
|
|||||||||||
| $ | 3,277,950 | $ | | $ | 3,277,950 | $ | | $ | 3,325,237 | |||||||||||
|
|
|
|
|
|
|
|
|
|
|
|||||||||||
| June 29, 2024 | ||||||||||||||||||||
| Fair Value | ||||||||||||||||||||
| Total | Level 1 | Level 2 | Level 3 | Carrying Value |
||||||||||||||||
| Senior secured notes, 4.75% due 2029 |
$ | 1,865,000 | $ | | $ | 1,865,000 | $ | | $ | 1,966,259 | ||||||||||
| Term loan credit facility |
1,265,116 | | 1,265,116 | | 1,216,789 | |||||||||||||||
|
|
|
|
|
|
|
|
|
|
|
|||||||||||
| $ | 3,130,116 | $ | | $ | 3,130,116 | $ | | $ | 3,183,048 | |||||||||||
|
|
|
|
|
|
|
|
|
|
|
|||||||||||
Note 6 Acquisitions, Goodwill and Intangible Assets
Earn-out and Holdback Liabilities
Earn-out liabilities for the Twenty-Six Weeks Ended June 29, 2024 decreased by $1,259 to $3,132. Holdback liabilities for the Twenty-Six Weeks Ended June 29, 2024 decreased by $111 to $0.
F-74
Table of Contents
INGRAM MICRO HOLDING CORPORATION
NOTES TO UNAUDITED CONDENSED CONSOLIDATED FINANCIAL STATEMENTS
(Amounts in thousands, except share, unit and per share data)
Finite-lived Identifiable Intangible Assets
Finite-lived identifiable intangible assets are amortized over their remaining estimated useful lives ranging up to 13 years with the predominant amounts having lives of 10 to 13 years. The gross carrying amounts of finite-lived identifiable intangible assets are $1,106,751 and $1,093,049 at December 30, 2023 and June 29, 2024, respectively, and the net carrying amounts of finite-lived identifiable intangible assets by type are as follows:
| December 30, 2023 |
June 29, 2024 |
|||||||
| Customer and vendor relationships |
$ | 474,080 | $ | 443,391 | ||||
| Tradename and trademarks |
358,228 | 339,001 | ||||||
| Software and developed technology |
48,125 | 43,750 | ||||||
|
|
|
|
|
|||||
| Total Intangible assets, net |
$ | 880,433 | $ | 826,142 | ||||
|
|
|
|
|
|||||
Amortization expense was $43,523 and $43,494 for the Twenty-Six Weeks Ended July 1, 2023 and the Twenty-Six Weeks Ended June 29, 2024, respectively.
Note 7 Debt
The carrying value of our outstanding debt consists of the following:
| December 30, 2023 |
June 29, 2024 |
|||||||
| Senior secured notes, 4.75% due 2029, net of unamortized deferred financing costs of $37,250 and $33,741, respectively |
$ | 1,962,750 | $ | 1,966,259 | ||||
| Term loan credit facility, net of unamortized discount of $11,733 and $10,671, respectively, and unamortized deferred financing costs of $35,780 and $32,540, respectively |
1,362,487 | 1,216,789 | ||||||
| ABL revolving credit facility |
30,000 | | ||||||
| Revolving trade accounts receivable-backed financing programs |
331,920 | 240,329 | ||||||
| Lines of credit and other debt |
236,451 | 206,153 | ||||||
|
|
|
|
|
|||||
| 3,923,608 | 3,629,530 | |||||||
| Short-term debt and current maturities of long-term debt |
(265,719 | ) | (206,153 | ) | ||||
|
|
|
|
|
|||||
| $ | 3,657,889 | $ | 3,423,377 | |||||
|
|
|
|
|
|||||
In June 2024 we voluntarily repaid $150,000 on our Term loan credit facility.
Note 8 Restructuring Costs
In the third quarter of 2023, as a result of changing global and local market conditions, we initiated a global restructuring plan. In the first quarter of 2024, we took further actions under this plan, resulting in organizational
F-75
Table of Contents
INGRAM MICRO HOLDING CORPORATION
NOTES TO UNAUDITED CONDENSED CONSOLIDATED FINANCIAL STATEMENTS
(Amounts in thousands, except share, unit and per share data)
and staffing changes and a headcount reduction of 503 employees. We currently do not anticipate material future costs to be incurred under this restructuring plan.
A summary of the restructuring costs incurred in the Twenty-Six Weeks Ended June 29, 2024, are as follows:
| Restructuring Costs | ||||||||||||||||
| Headcount Reduction (Number of Employees) |
Employee Termination Benefits |
Facility and Other Costs |
Total Restructuring Costs |
|||||||||||||
| Twenty-Six Weeks Ended June 29, 2024 |
||||||||||||||||
| North America |
$ | 7,181 | $ | 230 | $ | 7,411 | ||||||||||
| EMEA |
11,390 | | 11,390 | |||||||||||||
| Asia-Pacific |
3,384 | | 3,384 | |||||||||||||
| Latin America |
281 | 59 | 340 | |||||||||||||
|
|
|
|
|
|
|
|
|
|||||||||
| Total |
503 | $ | 22,236 | $ | 289 | $ | 22,525 | |||||||||
|
|
|
|
|
|
|
|
|
|||||||||
The remaining liabilities, which are recorded within accrued expenses and other on our Condensed Consolidated Balance Sheets, and activities associated with the aforementioned actions for 2023 and 2024 are summarized in the tables below:
| Restructuring Liability | ||||||||||||||||||||
| Beginning Liability |
Expenses, Net |
Amounts Paid and Charged Against the Liability |
Foreign Currency Translation |
Remaining Liability |
||||||||||||||||
| Twenty-Six Weeks Ended June 29, 2024 |
||||||||||||||||||||
| Employee termination benefits |
$ | 2,060 | $ | 22,236 | $ | (16,336 | ) | $ | (172 | ) | $ | 7,788 | ||||||||
| Facility and other costs |
| 289 | (289 | ) | | | ||||||||||||||
|
|
|
|
|
|
|
|
|
|
|
|||||||||||
| Total |
$ | 2,060 | $ | 22,525 | $ | (16,625 | ) | $ | (172 | ) | $ | 7,788 | ||||||||
|
|
|
|
|
|
|
|
|
|
|
|||||||||||
The remaining liabilities will be substantially paid by the end of fiscal year 2024.
Note 9 Income Taxes
For the Twenty-Six Weeks Ended July 1, 2023, and the Twenty-Six Weeks Ended June 29, 2024, our effective tax rate was 31.7%, and 34.9%, respectively. Under U.S. accounting rules for income taxes, interim effective tax rates may vary significantly depending on the actual operating results in the various tax jurisdictions, as well as changes in the valuation allowance related to the expected recovery of deferred tax assets.
The tax provision for the Twenty-Six Weeks Ended July 1, 2023, included $3,686 of tax expense, or 1.9 percentage points of the effective tax rate, which is associated with withholding tax expense from our business operations in the Latin America region, primarily from our Miami Export business. The tax provision for the Twenty-Six Weeks Ended July 1, 2023 also included $2,180 of tax expense, or 1.2% of the effective tax rate, due to a reduction in estimated U.S. foreign tax credit utilization in 2023. The tax provision for the Twenty-Six Weeks Ended June 29, 2024, included $5,926 of tax expense, or 3.7 percentage points of the effective tax rate,
F-76
Table of Contents
INGRAM MICRO HOLDING CORPORATION
NOTES TO UNAUDITED CONDENSED CONSOLIDATED FINANCIAL STATEMENTS
(Amounts in thousands, except share, unit and per share data)
which is associated with withholding tax expense from our business operations in the Latin America region, primarily from our Miami Export business. In addition, the tax provision for the Twenty-Six Weeks Ended June 29, 2024, included $1,945 of tax expense, or 1.2 percentage points of the effective tax rate, due to foreign exchange losses generated by a foreign subsidiary that is currently under valuation allowance. The tax provision for the Twenty-Six Weeks Ended June 29, 2024, also included $1,678 of tax expense, or 1.0 percentage points of the effective tax rate, due to a reduction in estimated U.S. foreign tax credit utilization in 2024.
Our effective tax rate during these periods differed from the U.S. federal statutory rate of 21% primarily due to the items noted above, as well as the relative mix of earnings or losses and various tax rates, including state taxes, within the jurisdictions in which we operate, such as: (a) losses in certain jurisdictions in which we are not able to record a tax benefit; (b) changes in the valuation allowance on deferred tax assets; and (c) changes in tax laws or interpretations thereof.
At December 30, 2023, we had gross unrecognized tax benefits of $16,785 compared to $14,995 at June 29, 2024. Substantially all of the remaining gross unrecognized tax benefits, if recognized, would impact our effective tax rate in the period of recognition.
We recognize interest and penalties related to unrecognized tax benefits in income tax expense. Total accruals for interest and penalties on our unrecognized tax benefits were $9,282 and $8,982 at December 30, 2023, and June 29, 2024, respectively.
Our future effective tax rate will continue to be affected by changes in the relative mix of taxable income and losses and various tax rates in the tax jurisdictions in which we operate, changes in the valuation of deferred tax assets or changes in tax laws or interpretations thereof. In addition, in the normal course of business, we are subject to tax examination by taxing authorities in the U.S., states and over fifty foreign jurisdictions in which we operate. In our material tax jurisdictions, the statute of limitations is open, in general, for three to five years.
In the U.S., our federal tax returns for the tax years from 2019 to 2022 are under audit by the IRS. It is possible that within the next twelve months, (1) ongoing tax examinations of our U.S. federal tax returns, individual states and several of our foreign jurisdictions may be resolved, (2) new tax exams may commence and (3) other issues may be effectively settled. However, we do not expect our assessment of unrecognized tax benefits to change significantly over that time.
Note 10 Commitments and Contingencies
As a company with a substantial employee population and with operations in a large number of countries, Ingram Micro is involved, either as a plaintiff or defendant, in a variety of ongoing claims, demands, suits, investigations, tax matters and proceedings that arise from time to time in the ordinary course of its business. The Company records a provision with respect to a claim, suit, investigation, or proceeding when it is probable that a liability has been incurred and the amount of the loss can be reasonably estimated. If there is at least a reasonable possibility that a material loss may have been incurred associated with pending legal claims, or when assertion of unasserted material claims are considered probable, we disclose such fact, and if reasonably estimable, we provide an estimate of the possible loss or range of possible loss. We record our best estimate of a loss related to pending legal and regulatory proceedings when the loss is considered probable and the amount can be reasonably estimated. Where a range of loss can be reasonably estimated with no best estimate in the range, we record the minimum estimated liability. As additional information becomes available, we assess the potential liability related to pending legal and regulatory proceedings and revise our estimates and update our disclosures accordingly. Significant judgment is required in both the determination of probability and the determination as to
F-77
Table of Contents
INGRAM MICRO HOLDING CORPORATION
NOTES TO UNAUDITED CONDENSED CONSOLIDATED FINANCIAL STATEMENTS
(Amounts in thousands, except share, unit and per share data)
whether a loss is reasonably estimable. Our legal costs associated with legal matters are recorded to expense as incurred.
The Company reviews claims, suits, investigations and proceedings at least quarterly, and decisions are made with respect to recording or adjusting provisions and disclosing reasonably possible losses or range of losses (individually or in the aggregate). Whether any losses, damages, or remedies finally determined in any claim, suit, investigation or proceeding could reasonably have a material effect on the Companys business, financial condition, results of operations or cash flows will depend on a number of variables, including: the timing and amount of such losses or damages; the structure and type of any such remedies; the significance of the impact of such losses, damages or remedies may have in the consolidated financial statements; and the unique facts and circumstances of the particular matter that may give rise to additional factors.
Our Brazilian subsidiary has received a number of tax assessments primarily related to tax reporting compliance topics as well as transaction-tax related matters largely involving applicability of tax and categorization of products and services. The total amount related to these assessments and similar tax exposures that are not yet assessed that give rise to a probable risk where a reserve has been established is Brazilian Reais 40,206 ($7,233 at June 29, 2024 exchange rates) in principal and associated penalties, interest and fines. The total amount related to these assessments and similar tax exposures that are not yet assessed that we believe give rise to a reasonably possible loss is Brazilian Reais 760,375 ($136,784 at June 29, 2024 exchange rates) in principal and associated penalties, interest and fines.
In June 2013, the French Competition Authority (FCA) launched an investigation of our subsidiary in France (Ingram Micro France), one of our competitors and one of our vendors in relation to alleged anticompetitive practices. In October 2018, the investigation services of the FCA filed a Statement of Objections against Ingram Micro France, as primary infringer, and Ingram Micro Europe BVBA and Ingram Micro, as parent companies (Ingram). In March 2020, the Board of the FCA issued its decision imposing a fine of 62,900 on Ingram regarding volume allocations of Apple products. In July 2020, we appealed the decision of the Board of the FCA to the Paris Court of Appeals. On October 6, 2022, the Paris Court of Appeals issued a decision maintaining the infraction of volume allocation and reducing the fine to 19,500. In November 2022 the Company further appealed this matter to the Cour de Cassation. As the appeal to the Cour de Cassation did not suspend the obligation to pay the fine, in the third quarter of 2022, we recorded a contingent liability at that time within our Condensed Consolidated Balance Sheets. Under the payment plan agreed with the French Treasury, Ingram Micro France had already paid approximately $11,000. On November 4, 2022, Ingram Micro France made an additional payment of approximately $9,000 to complete the total amount of the fine and the French Treasury released the third-party surety bond. As a result of the appeals court ruling, the Company determined that the best estimate of probable loss related to this matter is limited to the amounts already paid to date. On June 3, 2021, the reseller whose complaint to the FCA gave rise to the investigation filed a follow-on civil claim in the Paris Commercial Court seeking approximately 95,000 ($101,802 at June 29, 2024 exchange rates) in damages from Ingram, one of our competitors and one of our vendors. On May 30, 2022, the Paris Commercial Court postponed the hearing on this reseller claim pending resolution of the appeal on the main case. On October 24, 2022, the reseller requested the re-opening of the proceedings and we petitioned the Paris Commercial Court to stay the proceedings until the main case is decided by the Cour de Cassation. On May 15, 2023, the Paris Commercial Court did not accept the request to suspend the case and set a calendar for a final hearing, which took place in June 2024. A decision is expected in October 2024. We are currently evaluating this matter and cannot currently estimate the probability or amount of any potential loss.
In January 2021, we first learned through external sources that in June 2019, the Court of Additional Chief Metropolitan Magistrate (Special Acts), Central District, Tis Hazari in New Delhi (the New Delhi Court)
F-78
Table of Contents
INGRAM MICRO HOLDING CORPORATION
NOTES TO UNAUDITED CONDENSED CONSOLIDATED FINANCIAL STATEMENTS
(Amounts in thousands, except share, unit and per share data)
issued a summoning order naming Ingram Micro India Ltd. (IMIL) as one of 40 legal entity defendants in a criminal complaint. IMIL is accused by the Serious Fraud Office of cheating and criminal conspiracy based on four payments it made over 15 years ago at the request of a certain vendor. In February 2021, outside legal counsel appeared on IMILs behalf at the New Delhi Court and requested relevant documentation pertaining to these charges to assess IMILs legal position. IMIL has vigorously contested the charges as we believe the charges to be meritless and in December 2021 filed a motion to dismiss.
In September 2021, the Companys subsidiary in Saudi Arabia received a tax assessment for Saudi Riyal 238,152 ($63,468 at June 29, 2024 exchange rates) in tax and associated penalties issued by ZATCA (tax and customs authority) asserting that withholding tax was due on payments to non-resident vendors for software distributed to resellers from 2015 through 2020. We believe the tax assessment gives rise to a reasonably possible loss of Saudi Riyal 159,853 ($42,601 at June 29, 2024 exchange rates) in tax and a probable risk of Saudi Riyal 5,598 ($1,492 at June 29, 2024 exchange rates) in tax. In addition, we believe it is possible the tax authorities will assess us for payments to non-resident vendors for software distributed to resellers for the years 2021 through the second quarter of 2024, which gives rise to a reasonably possible loss of Saudi Riyal 314,728 ($83,875 at June 29, 2024 exchange rates) in tax and a probable risk of Saudi Riyal 832 ($222 at June 29, 2024 exchange rates) in tax. Associated penalties have a remote risk due to the assessments being based on a difference in interpretation of Saudi tax law. In February 2024 and early April 2024, ZATCA issued new guidelines on taxation of payments for software, which largely appear to no longer assert that withholding tax is due on payments to non-resident vendors for software distributed to resellers. While we continue to analyze the guidelines it is unclear how ZATCA will utilize the guidelines with respect to the pre-guidelines periods since they are only applicable on a prospective basis; however, we believe they are a positive development as the new guidelines appear to be largely consistent with the interpretation before the assessments were made. In May 2024, at our request, the court granted a third 6-month suspension of the case. There is a probable risk listed above which constitutes a potential settlement position. We strongly believe that we have administered taxes correctly, that these payments to non-resident vendors for software distributed to resellers are not subject to withholding tax and that we will ultimately prevail in this matter.
We may be subject to non-income based tax unasserted claims related to transactions with certain non-U.S. affiliates and indirect tax related matters. As of June 29, 2024, the Company is unable to reasonably estimate the possible losses or range of losses, if any, arising from unasserted claims due to a number of factors, including the presence of complex or novel legal theories and the ongoing discovery and development of information important to potential unasserted claims. Claims, suits, investigations and proceedings are inherently uncertain, and it is not possible to predict the ultimate outcome of unasserted claims. It is possible that the Companys business, financial condition, results of operations or cash flows could be materially affected in any particular period by the resolution of potential claims.
As is customary in the IT distribution industry, we have arrangements with certain finance companies that provide inventory-financing facilities for our customers. In conjunction with certain of these arrangements, we have agreements with the finance companies that would require us to repurchase certain inventory that might be repossessed from the customers by the finance companies. Due to various reasons, including among other items, the lack of information regarding the amount of salable inventory purchased from us that is still on hand with the customer at any point in time, repurchase obligations relating to inventory cannot be reasonably estimated. Repurchases of inventory by us under these arrangements have been insignificant to date.
We have guarantees to third parties that provide financing to a limited number of our customers. Net sales under these arrangements accounted for less than one percent of our consolidated net sales for each of the periods presented. The guarantees require us to reimburse the third party for defaults by these customers up to an
F-79
Table of Contents
INGRAM MICRO HOLDING CORPORATION
NOTES TO UNAUDITED CONDENSED CONSOLIDATED FINANCIAL STATEMENTS
(Amounts in thousands, except share, unit and per share data)
aggregate of $5,256. The fair value of these guarantees has been recognized as cost of sales on the Condensed Consolidated Statements of Income to these customers and is included in accrued expenses and other on the Condensed Consolidated Balance Sheets.
Note 11 Segment Information
ASC 280, Segment Reporting, establishes standards for reporting information about operating segments. Operating segments are defined as components of an enterprise about which separate financial information is evaluated regularly by the chief operating decision maker (CODM) in deciding how to allocate resources and in assessing performance. Our CODM is our Chief Executive Officer. Our reportable segments coincide with the geographic operating segments which include North America, Europe, which includes Middle East and Africa (EMEA), Asia-Pacific and Latin America. The measure of segment profit is income from operations.
Geographic areas in which we operated our reportable segments during the periods presented include North America (the United States and Canada), EMEA, (Austria, Belgium, Bosnia and Herzegovina, Bulgaria, Croatia, Czech Republic, Denmark, Egypt, Finland, France, Germany, Hungary, Ireland, Israel, Italy, Kosovo, Lebanon, Luxembourg, Macedonia, Morocco, Netherlands, Norway, Oman, Pakistan, Poland, Portugal, Qatar, Romania, Saudi Arabia, Serbia, Slovenia, Spain, Sweden, Switzerland, Turkey, United Arab Emirates and the United Kingdom), Asia-Pacific (Australia, Bangladesh, the Peoples Republic of China including Hong Kong, India, Indonesia, Japan, Malaysia, New Zealand, Philippines, Singapore, Sri Lanka and Thailand) and Latin America (Brazil, Chile, Colombia, Costa Rica, Mexico, Peru, Uruguay and our Latin American export operations in Miami).
We do not allocate certain Corporate Costs or time-vested and performance-vested cash-based compensation recognized to our reportable segments (see Note 3, Employee Awards); therefore, we are reporting these amounts separately. Assets by reportable segment are not presented below as our CODM does not review assets by reportable segment.
Financial information by reportable segment is as follows:
| Twenty-Six Weeks Ended July 1, 2023 |
Twenty-Six Weeks Ended June 29, 2024 |
|||||||
| Net sales |
||||||||
| North America |
$ | 9,111,039 | $ | 8,420,643 | ||||
| EMEA |
6,881,232 | 6,724,163 | ||||||
| Asia-Pacific |
5,337,174 | 6,007,137 | ||||||
| Latin America |
1,766,045 | 1,724,430 | ||||||
|
|
|
|
|
|||||
| Total |
$ | 23,095,490 | $ | 22,876,373 | ||||
|
|
|
|
|
|||||
| Income from operations |
||||||||
| North America |
$ | 146,323 | $ | 123,644 | ||||
| EMEA |
138,157 | 101,646 | ||||||
| Asia-Pacific |
114,819 | 111,827 | ||||||
| Latin America |
39,376 | 47,716 | ||||||
| Corporate |
(18,327 | ) | (21,339 | ) | ||||
| Cash-based compensation expense |
(19,338 | ) | (12,245 | ) | ||||
|
|
|
|
|
|||||
| Total |
$ | 401,010 | $ | 351,249 | ||||
|
|
|
|
|
|||||
F-80
Table of Contents
INGRAM MICRO HOLDING CORPORATION
NOTES TO UNAUDITED CONDENSED CONSOLIDATED FINANCIAL STATEMENTS
(Amounts in thousands, except share, unit and per share data)
| Twenty-Six Weeks Ended July 1, 2023 |
Twenty-Six Weeks Ended June 29, 2024 |
|||||||
| Capital expenditures |
||||||||
| North America |
$ | 87,396 | $ | 63,188 | ||||
| EMEA |
10,222 | 5,514 | ||||||
| Asia-Pacific |
3,794 | 1,131 | ||||||
| Latin America |
2,795 | 1,840 | ||||||
|
|
|
|
|
|||||
| Total |
$ | 104,207 | $ | 71,673 | ||||
|
|
|
|
|
|||||
| Depreciation |
||||||||
| North America |
$ | 34,328 | $ | 34,859 | ||||
| EMEA |
9,215 | 7,666 | ||||||
| Asia-Pacific |
3,919 | 3,302 | ||||||
| Latin America |
3,253 | 3,140 | ||||||
|
|
|
|
|
|||||
| Total |
$ | 50,715 | $ | 48,967 | ||||
|
|
|
|
|
|||||
| Amortization of intangible assets |
||||||||
| North America |
$ | 21,089 | $ | 21,082 | ||||
| EMEA |
11,858 | 11,954 | ||||||
| Asia-Pacific |
8,873 | 8,726 | ||||||
| Latin America |
1,703 | 1,732 | ||||||
|
|
|
|
|
|||||
| Total |
$ | 43,523 | $ | 43,494 | ||||
|
|
|
|
|
|||||
| Integration, transition and other costs (1) |
||||||||
| North America |
$ | 16 | $ | 2,079 | ||||
| EMEA |
577 | 1,029 | ||||||
| Asia-Pacific |
(9 | ) | 112 | |||||
| Latin America |
1,976 | (1,352 | ) | |||||
| Corporate |
18,327 | 21,339 | ||||||
|
|
|
|
|
|||||
| Total |
$ | 20,887 | $ | 23,207 | ||||
|
|
|
|
|
|||||
| (1) | Costs are primarily related to (i) an advisory fee paid to Platinum Equity Advisors, LLC (Platinum Advisors), ii) professional, consulting and legal costs in connection with our initial public offering, and iii) consulting, retention and transition costs associated with our organizational effectiveness program charged to SG&A. |
Note 12 Earnings Per Share
Basic and diluted earnings per share is presented in conformity with the two-class method required for multiple classes of common stock. We report a dual presentation of basic earnings per share and diluted earnings per share. Basic earnings per share excludes dilution and is computed by dividing net income by the weighted average number of common shares outstanding during the reported period. Diluted earnings per share is computed the same as basic earnings per share as we do not have any participating securities for any of the periods presented.
F-81
Table of Contents
INGRAM MICRO HOLDING CORPORATION
NOTES TO UNAUDITED CONDENSED CONSOLIDATED FINANCIAL STATEMENTS
(Amounts in thousands, except share, unit and per share data)
The computation of basic earnings per share and diluted earnings per share is as follows:
| Twenty-Six Weeks Ended July 1, 2023 |
Twenty-Six Weeks Ended June 29, 2024 |
|||||||||||||||
| Class A | Class B | Class A | Class B | |||||||||||||
| Net income |
$ | 128,441 | $ | 964 | $ | 103,361 | $ | 776 | ||||||||
|
|
|
|
|
|
|
|
|
|||||||||
| Weighted average shares |
26,382 | 198 | 26,382 | 198 | ||||||||||||
|
|
|
|
|
|
|
|
|
|||||||||
| Basic earnings per share |
$ | 4,869 | $ | 4,869 | $ | 3,918 | $ | 3,918 | ||||||||
|
|
|
|
|
|
|
|
|
|||||||||
| Diluted earnings per share |
$ | 4,869 | $ | 4,869 | $ | 3,918 | $ | 3,918 | ||||||||
|
|
|
|
|
|
|
|
|
|||||||||
Note 13 Related Party Transactions
In connection with our acquisition by Platinum, we entered into a Corporate Advisory Services Agreement (the CASA) with Platinum Advisors, an entity affiliated with Platinum, pursuant to which Platinum Advisors provides corporate and advisory services to us. The Company incurs an annual fee of $25,000, plus expenses incurred by Platinum Advisors in rendering such services. During the Twenty-Six Weeks Ended July 1, 2023 and the Twenty-Six Weeks Ended June 29, 2024, we incurred fees and expenses of $12,781 and $12,651, respectively, under the CASA. These amounts have been included within SG&A expenses within the Condensed Consolidated Statements of Income.
Note 14 Subsequent Events
We have evaluated the impact of subsequent events of Ingram Micro Holding Corporation through September 6, 2024, the date the condensed consolidated financial statements were available to be issued and have determined that no additional subsequent events required disclosure in the unaudited condensed consolidated financial statements.
F-82
Table of Contents
Through and including the 25th day after the date of this prospectus, all dealers that effect transactions in these shares of our Common Stock, whether or not participating in this offering, may be required to deliver a prospectus. This is in addition to the dealers obligations to deliver a prospectus when acting as underwriters and with respect to their unsold allotments or subscriptions.

18,600,000 Shares
Common Stock
| Morgan Stanley | Goldman Sachs & Co. LLC | J.P. Morgan |
| BofA Securities | Deutsche Bank Securities | Evercore ISI | Jefferies | RBC Capital Markets |
| BNP PARIBAS | Guggenheim Securities | Raymond James | Rothschild & Co | Stifel | William Blair |
| Fifth Third Securities | Loop Capital Markets | |||||||||
PRELIMINARY PROSPECTUS
, 2024
Table of Contents
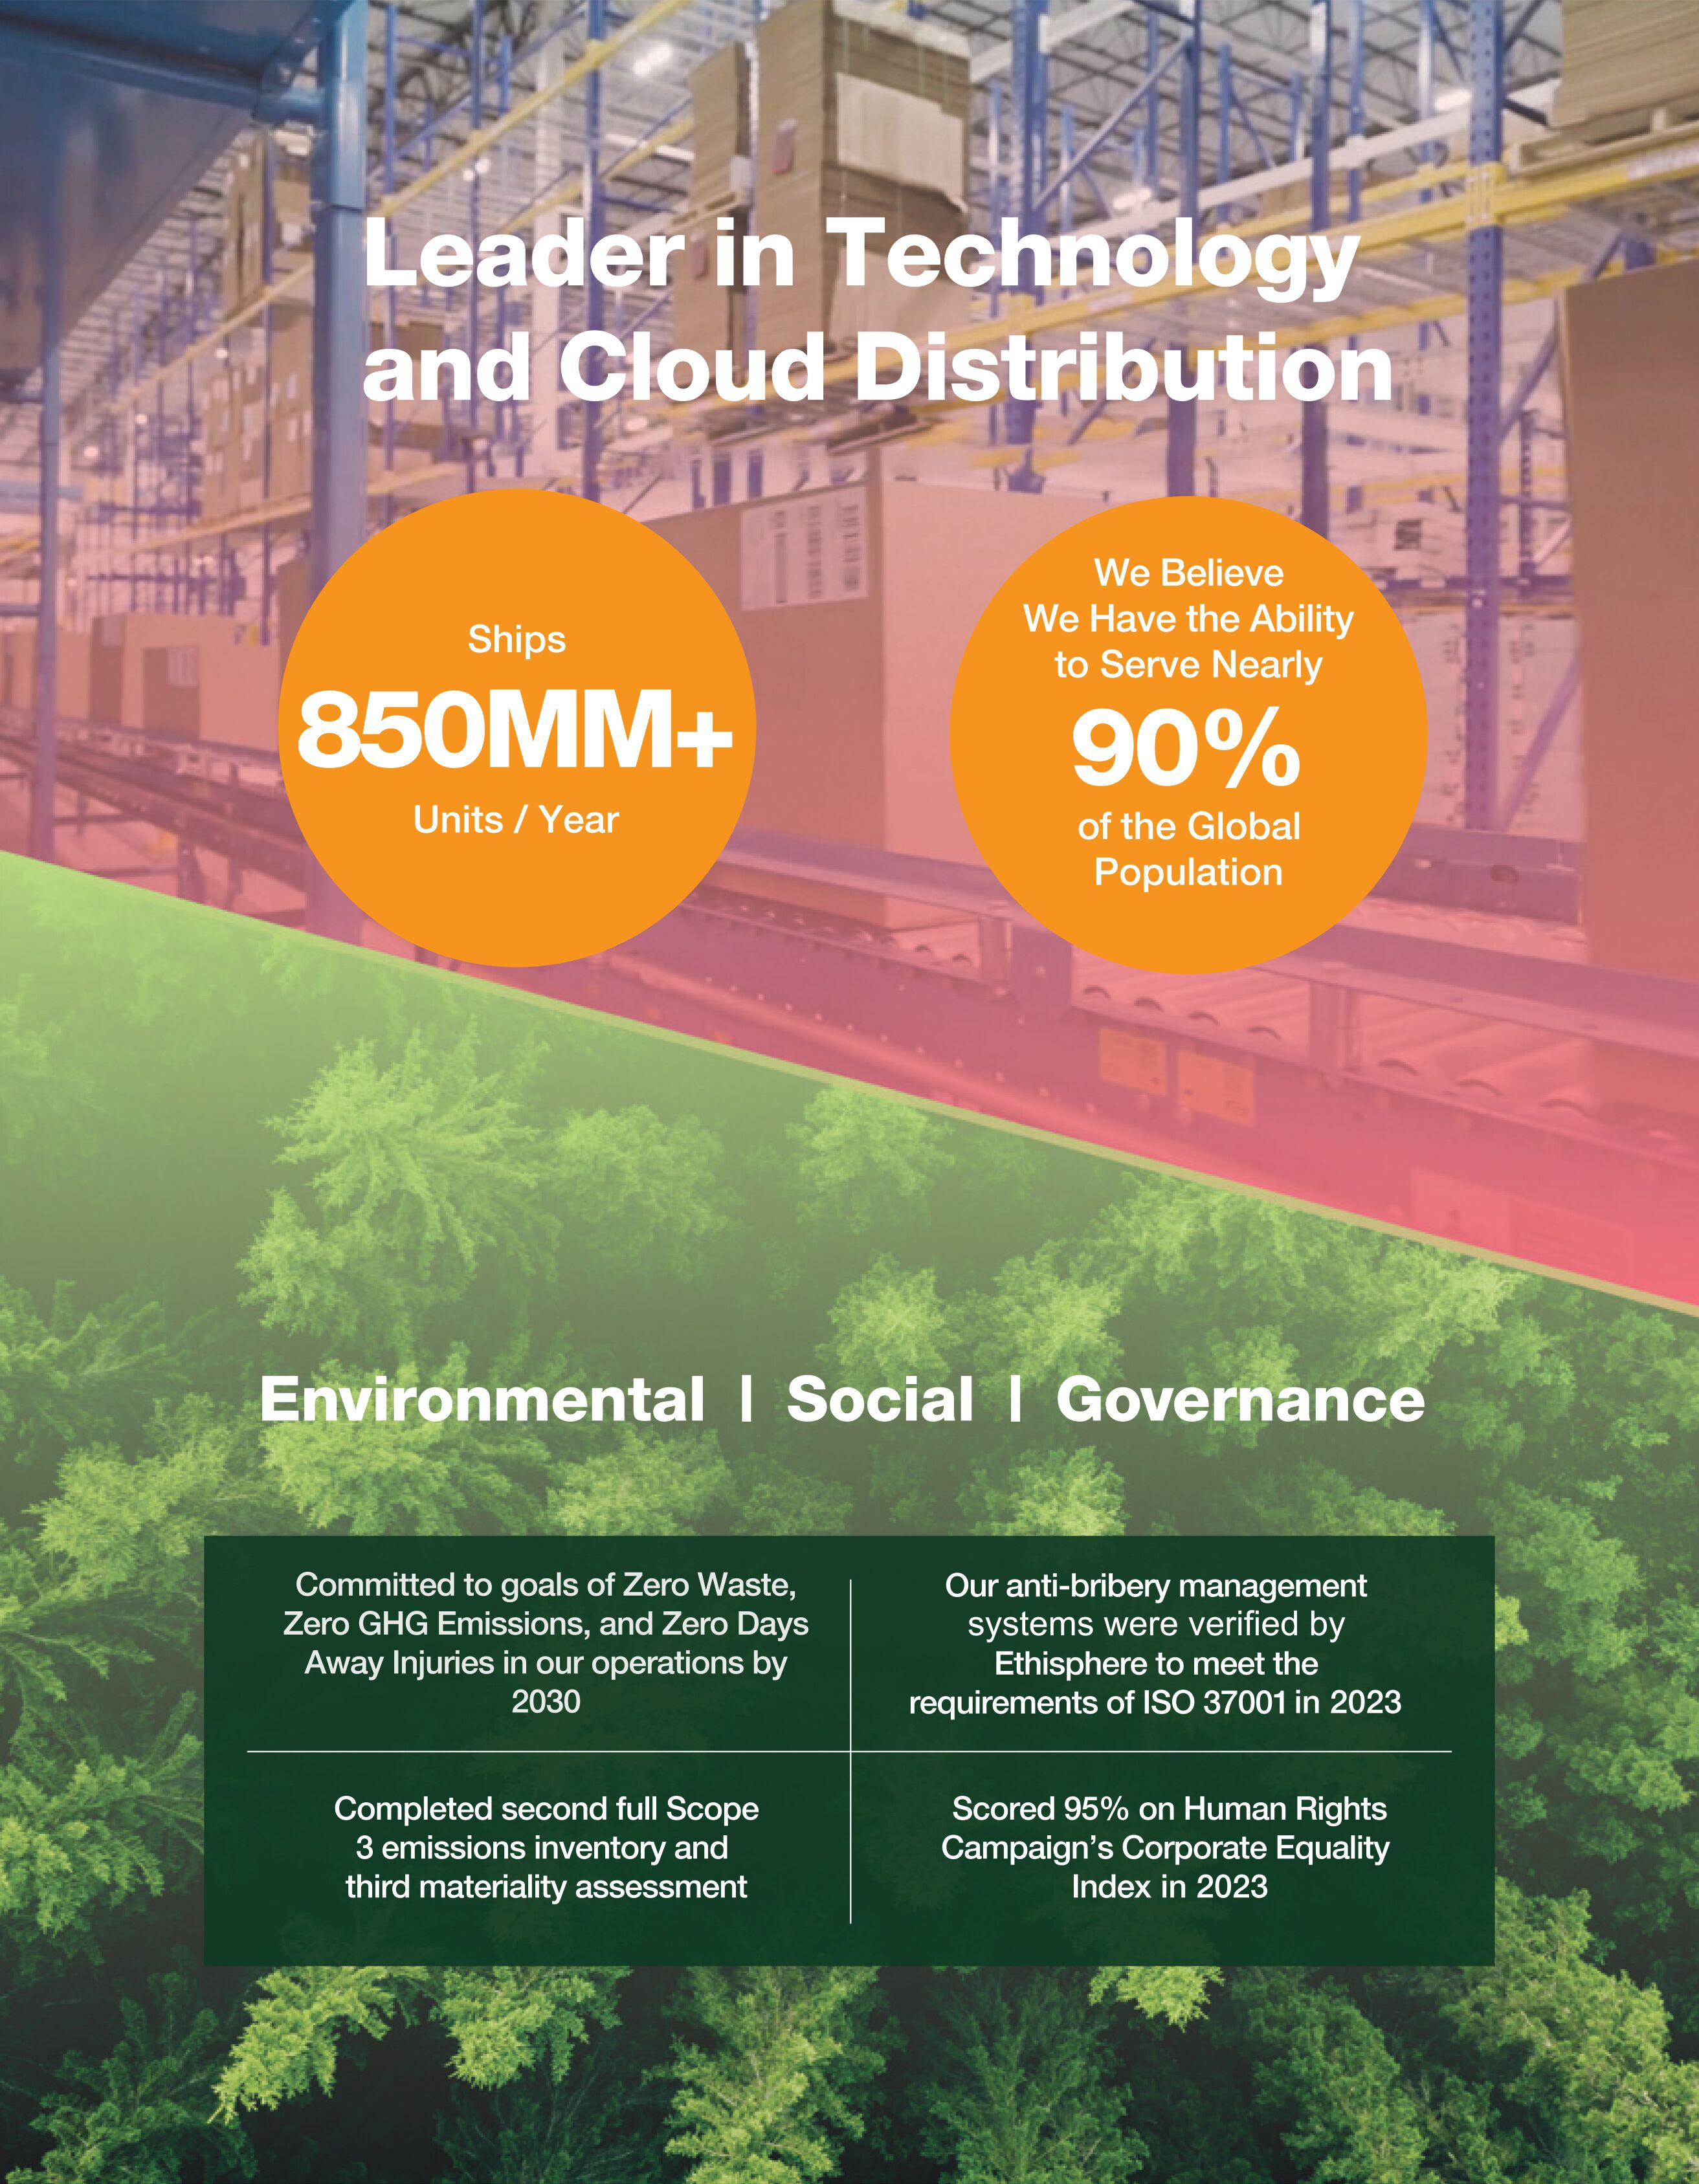
Table of Contents
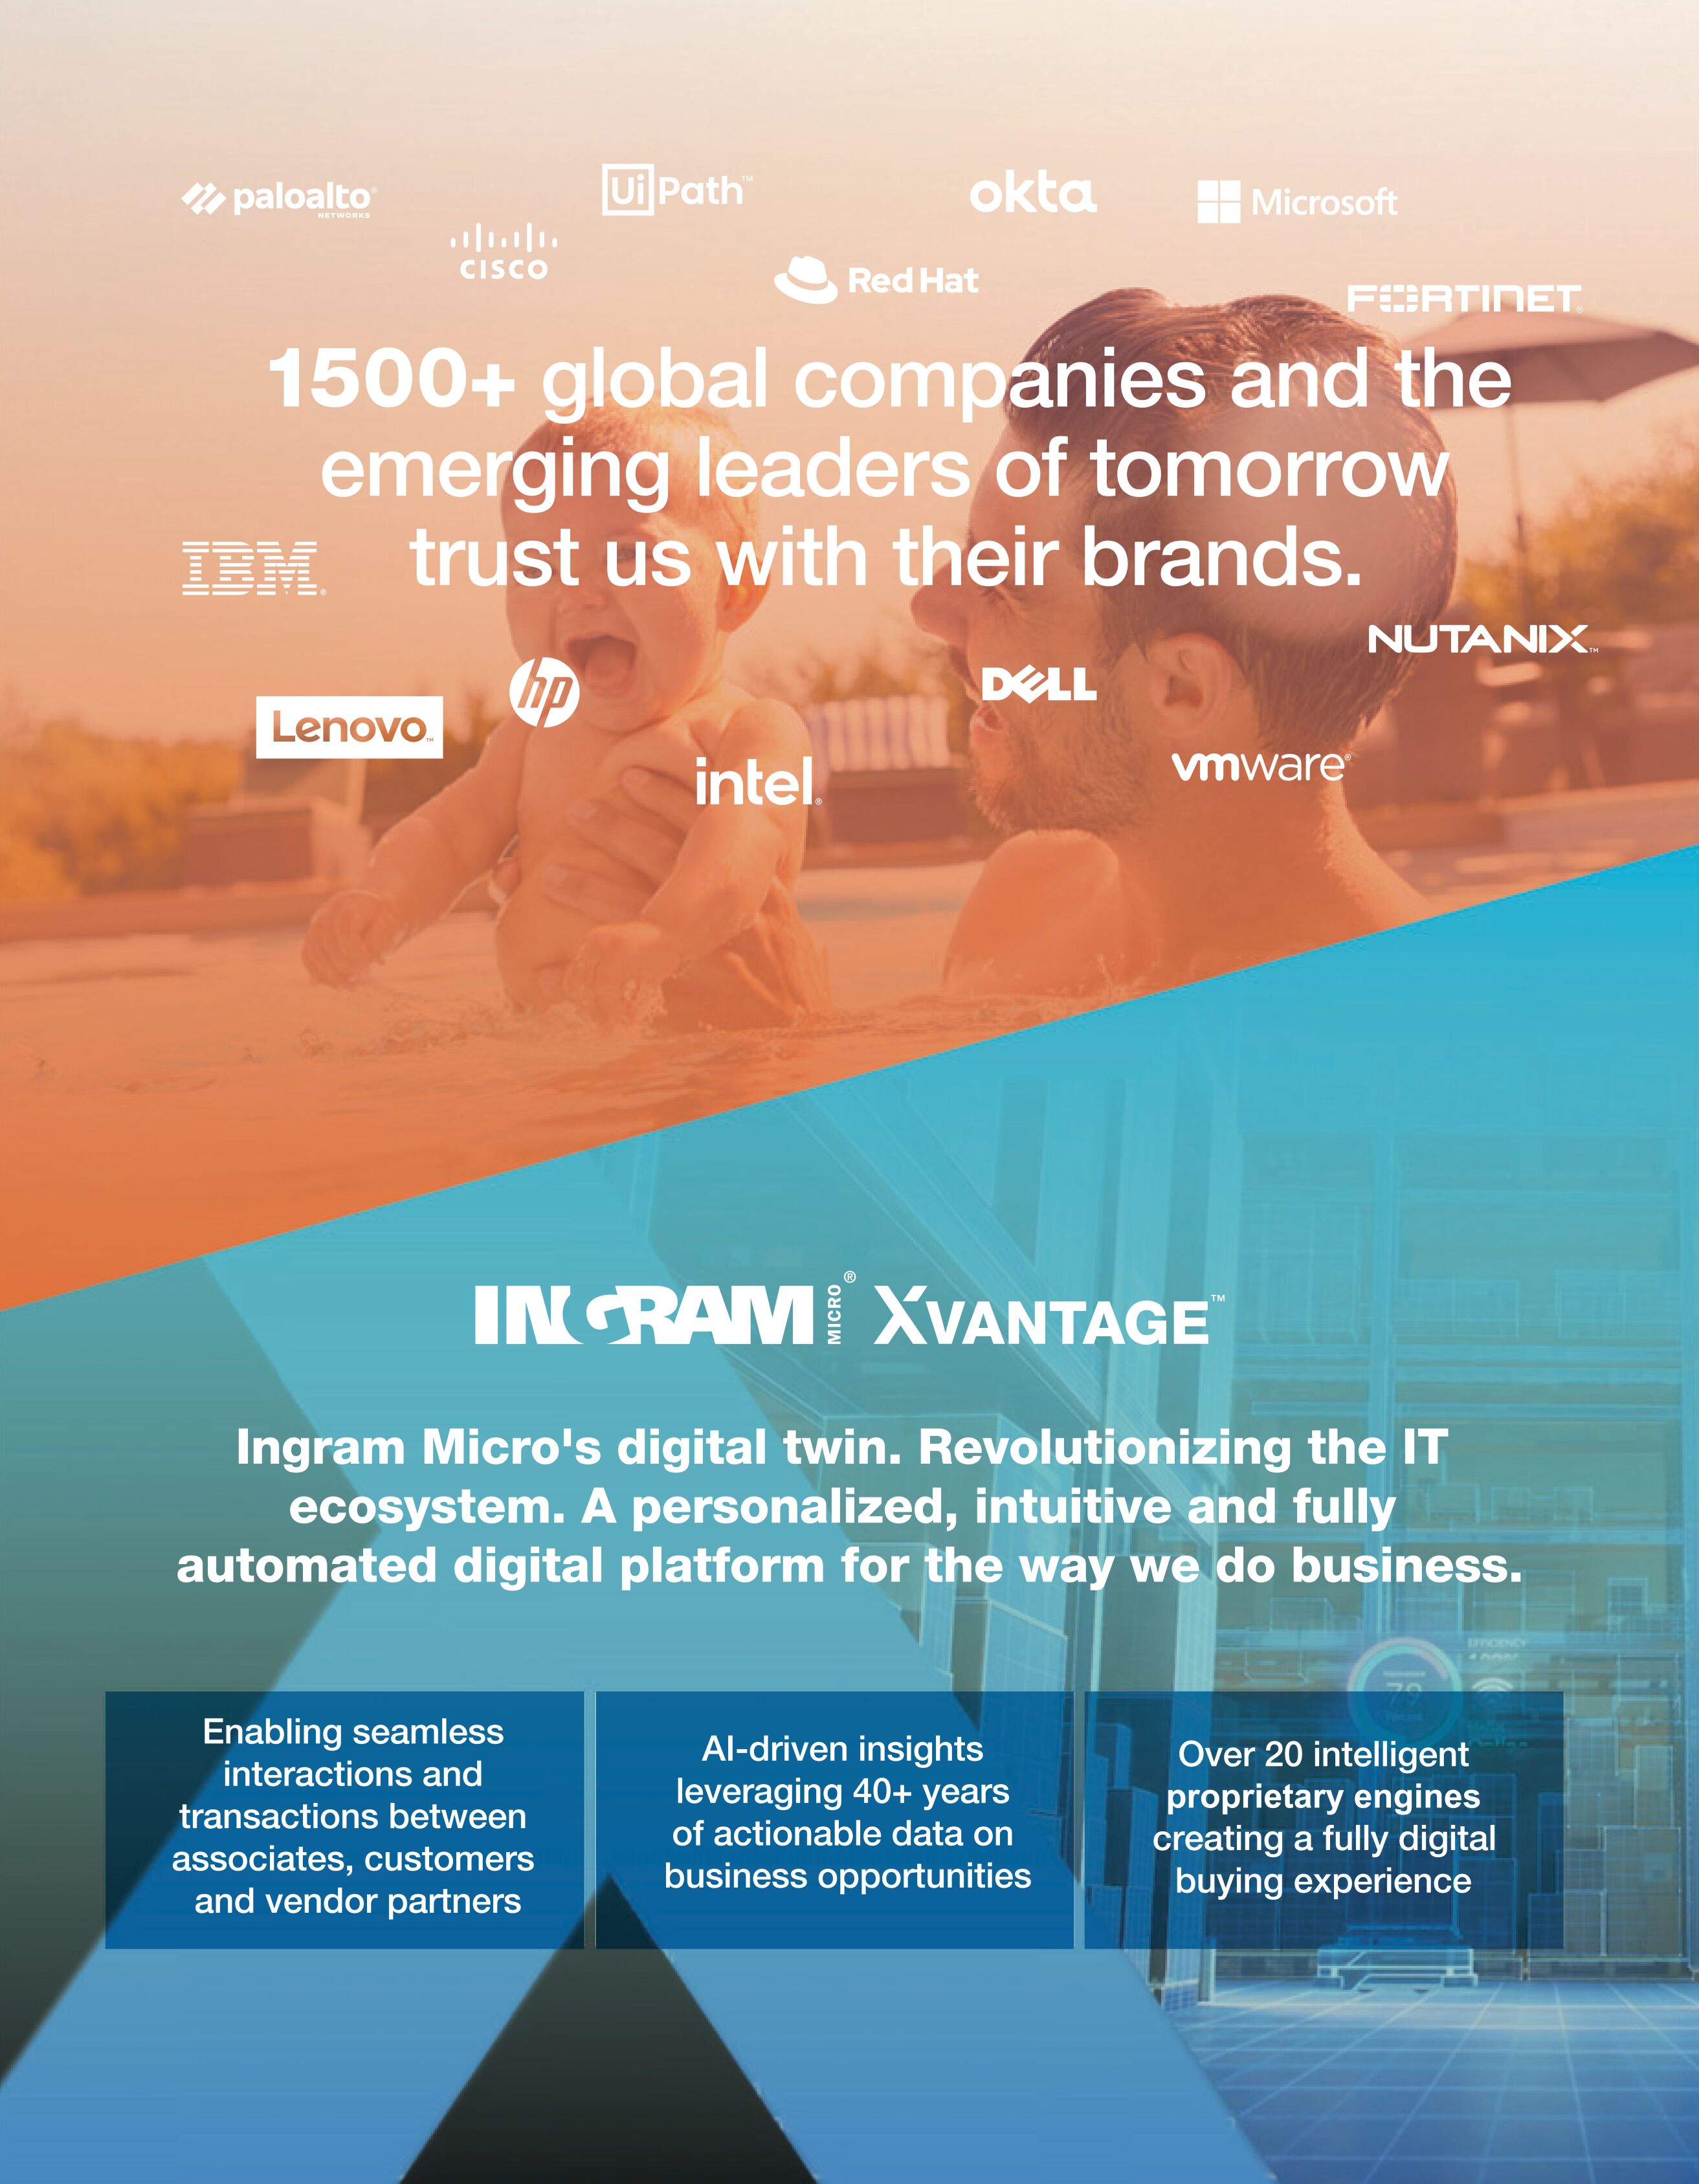
Table of Contents

Table of Contents

Table of Contents
PART II
INFORMATION NOT REQUIRED IN PROSPECTUS
Item 13. Other Expenses of Issuance and Distribution.
The following table sets forth all of the costs and expenses, other than underwriting discounts, payable in connection with the sale of the shares of Common Stock being registered hereby. Except as otherwise noted, the Company will pay all of the costs and expenses set forth in the following table. All amounts shown below are estimates, except the SEC registration fee, the Financial Industry Regulatory Authority (FINRA), filing fee and the stock exchange listing fee:
| Amount | ||||
| SEC registration fee |
$ | 75,321 | ||
| FINRA filing fee |
74,330 | |||
| Stock exchange listing fee |
300,000 | |||
| Printing fees |
1,900,000 | |||
| Legal fees and expenses |
5,000,000 | |||
| Accounting fees and expenses |
175,000 | |||
| Transfer agent and registrar fees |
3,700 | |||
| Miscellaneous expenses |
525,000 | |||
| Total |
$ | 8,053,351 | ||
Item 14. Indemnification of Directors and Officers.
Section 102(b)(7) of the DGCL allows a corporation to eliminate the personal liability of a director or certain officers to the corporation or its stockholders for monetary damages for breach of fiduciary duty as a director or officer, except for liability for (1) a director or officer for any breach of the directors or officers duty of loyalty to the corporation or its stockholders, (2) a director or officer for acts or omissions not in good faith or which involve intentional misconduct or a knowing violation of law, (3) a director or officer for any transaction from which the director or officer derived an improper personal benefit, (4) a director under Section 174 of the DGCL (regarding, among other things, the payment of unlawful dividends or unlawful stock purchases or redemptions) or (5) an officer in any action by or in the right of the corporation. Our amended and restated certificate of incorporation will contain a provision which eliminates directors and officers personal liability for monetary damages to the fullest extent permitted by the DGCL.
Our amended and restated certificate of incorporation and amended and restated bylaws will provide in effect that we shall indemnify our directors and officers to the extent permitted by the DGCL. Section 145 of the DGCL provides that a Delaware corporation has the power to indemnify its directors, officers, associates and agents in certain circumstances. Subsection (a) of Section 145 of the DGCL empowers a corporation to indemnify any director, officer, employee or agent, or former director, officer, employee or agent, who was or is a party, or is threatened to be made a party to any threatened, pending or completed action, suit or proceeding, whether civil, criminal, administrative or investigative (other than an action by or in the right of the corporation), against expenses (including attorneys fees), judgments, fines and amounts paid in settlement actually and reasonably incurred in connection with such action, suit or proceeding, provided that such director, officer, employee or agent acted in good faith and in a manner he or she reasonably believed to be in, or not opposed to, the best interests of the corporation and, with respect to any criminal action or proceeding, provided that such director, officer, employee or agent had no reasonable cause to believe that his or her conduct was unlawful.
Subsection (b) of Section 145 of the DGCL empowers a corporation to indemnify any director, officer, employee or agent, or former director, officer, employee or agent, who was or is a party or is threatened to be made a party to any threatened, pending or completed action or suit by or in the right of the corporation to
II-1
Table of Contents
procure a judgment in its favor by reason of the fact that such person acted in any of the capacities set forth above, against expenses (including attorneys fees) actually and reasonably incurred in connection with the defense or settlement of such action or suit provided that such person acted in good faith and in a manner he or she reasonably believed to be in or not opposed to the best interests of the corporation, except that no indemnification may be made in respect of any claim, issue or matter as to which such person shall have been adjudged to be liable to the corporation unless and only to the extent that the Court of Chancery or the court in which such action was brought shall determine that despite the adjudication of liability such person is fairly and reasonably entitled to indemnity for such expenses which the court shall deem proper.
Section 145 further provides that to the extent that a director or officer or employee of a corporation has been successful in the defense of any action, suit or proceeding referred to in subsections (a) and (b) of Section 145 or in the defense of any claim, issue or matter therein, he or she shall be indemnified against expenses (including attorneys fees) actually and reasonably incurred by him or her in connection therewith; that indemnification provided by Section 145 shall not be deemed exclusive of any other rights to which the party seeking indemnification may be entitled; and the corporation is empowered to purchase and maintain insurance on behalf of a director, officer, employee or agent of the corporation against any liability asserted against him or her or incurred by him or her in any such capacity or arising out of his or her status as such whether or not the corporation would have the power to indemnify him or her against such liabilities under Section 145; and that, unless indemnification is ordered by a court, the determination that indemnification under subsections (a) and (b) of Section 145 is proper because the director, officer, employee or agent has met the applicable standard of conduct under such subsections shall be made by (1) a majority vote of the directors who are not parties to such action, suit or proceeding, even though less than a quorum, (2) by a committee of such directors designated by majority vote of such directors, even though less than a quorum, (3) if there are no such directors, or if such directors so direct, by independent legal counsel in a written opinion or (4) by the stockholders.
We expect to maintain standard policies of insurance that provide coverage (1) to our directors and officers against loss arising from claims made by reason of breach of duty or other wrongful act and (2) to us with respect to indemnification payments that we may make to such directors and officers. In addition, prior to the completion of this offering, we expect to enter into indemnification agreements with each of our directors and officers. These indemnification agreements may require us, among other things, to indemnify each such director or officer, to the fullest extent permissible under Delaware law, against liabilities and for certain expenses, including attorneys fees, judgments, fines and settlement amounts incurred by such director or officer in any action or proceeding arising out of his or her service as one of our directors or officers. Insofar as indemnification for liabilities arising under the Securities Act may be permitted to directors, we have been informed that in the opinion of the SEC such indemnification is against public policy and is therefore unenforceable.
The underwriting agreement provides for indemnification by the underwriters of us and our officers and directors, and by us of the underwriters for certain liabilities arising under the Securities Act or otherwise in connection with this offering.
Item 15. Recent Sales of Securities.
Since January 1, 2021, the registrant has issued the following securities which were not registered under the Securities Act:
| | On October 8, 2021, the registrant issued 132.7 shares of Class B non-voting common stock to certain of its officers and associates in exchange for cash in an aggregate amount equal to $5,858,333 and promissory notes in an aggregate principal amount of approximately $7,411,667. Such promissory notes have been repaid in full. |
| | On October 8, 2021, the registrant issued 65.3536 shares of Class B non-voting common stock to certain other officers and associates for aggregate consideration of approximately $6,535,358. |
II-2
Table of Contents
| | On July 1, 2021, the registrant issued a promissory note with an aggregate principal amount of $20,000,000 to Imola JV Holdings, L.P. On October 5, 2021, the parties agreed to capitalize a portion of the outstanding balance of such promissory note and we issued 1.94642 shares of Class A voting common stock in exchange for the discharge and cancellation of an aggregate amount equal to $194,642 of the outstanding balance of such promissory note. On March 7, 2022, such promissory note was paid off in full and terminated. |
The issuances of such shares of Common Stock were not registered under the Securities Act, because the shares were offered and sold in transactions by the issuer not involving any public offering exempt from registration under Section 4(a)(2) of the Securities Act.
Item 16. Exhibits and Financial Statement Schedules.
(a) Exhibits.
See the Exhibit Index immediately preceding the signature pages hereto, which is incorporated by reference as if fully set forth herein.
(b) Financial Statement Schedules.
See accompanying Index to Financial Statements.
Item 17. Undertakings.
The undersigned Company hereby undertakes to provide to the underwriters at the closing specified in the underwriting agreement certificates in such denominations and registered in such names as required by the underwriters to permit prompt delivery to each purchaser.
Insofar as indemnification for liabilities arising under the Securities Act may be permitted to directors, officers and controlling persons of the Company pursuant to the foregoing provisions, or otherwise, the Company has been advised that in the opinion of the Securities and Exchange Commission such indemnification is against public policy as expressed in the Securities Act and is, therefore, unenforceable. In the event that a claim for indemnification against such liabilities (other than the payment by the Company of expenses incurred or paid by a director, officer or controlling person of the Company in the successful defense of any action, suit or proceeding) is asserted by such director, officer or controlling person in connection with the securities being registered, the Company will, unless in the opinion of its counsel the matter has been settled by controlling precedent, submit to a court of appropriate jurisdiction the question of whether such indemnification by it is against public policy as expressed in the Securities Act and will be governed by the final adjudication of such issue.
The undersigned Company hereby undertakes that:
(1) For purposes of determining any liability under the Securities Act, the information omitted from the form of prospectus filed as part of this registration statement in reliance upon Rule 430A and contained in a form of prospectus filed by the Company pursuant to Rule 424(b)(1) or (4) or 497(h) under the Securities Act shall be deemed to be part of this registration statement as of the time it was declared effective.
(2) For the purpose of determining any liability under the Securities Act, each post-effective amendment that contains a form of prospectus shall be deemed to be a new registration statement relating to the securities offered therein, and the offering of such securities at that time shall be deemed to be the initial bona fide offering thereof.
II-3
Table of Contents
EXHIBIT INDEX
II-4
Table of Contents
| + | Previously filed. |
| ** | Certain schedules and/or exhibits have been omitted. The Company agrees to furnish a supplemental copy of any omitted schedule or attachment to the SEC upon request. |
| | Indicates management contract or compensatory plan, contract or arrangement. |
II-5
Table of Contents
SIGNATURES
Pursuant to the requirements of the Securities Act of 1933, as amended, the Company has duly caused this registration statement to be signed on its behalf by the undersigned, thereunto duly authorized, in the City of Irvine, State of California, on October 15, 2024.
| INGRAM MICRO HOLDING CORPORATION | ||
| By: | /s/ Paul Bay | |
| Name: | Paul Bay | |
| Title: | Chief Executive Officer | |
Pursuant to the requirements of the Securities Act of 1933, as amended, this registration statement has been signed by the following persons in the capacities indicated on October 15, 2024:
| Signatures |
Title |
|
| /s/ Paul Bay Paul Bay |
Chief Executive Officer (principal executive officer) |
|
| * Michael Zilis |
Executive Vice President and Chief Financial Officer |
|
| * Cari Hornstein |
Senior Vice President, Controller and Chief Accounting Officer (principal accounting officer) |
|
| * Mary Ann Sigler |
Director |
|
| *By: | /s/ Paul Bay | |
| Name: Paul Bay | ||
| Title: Attorney-in-fact | ||
II-6